

The DOI matches its Crossref record.
CD5 Expression Is Developmentally Regulated By T Cell Receptor (TCR) Signals and TCR Avidity
Abstract
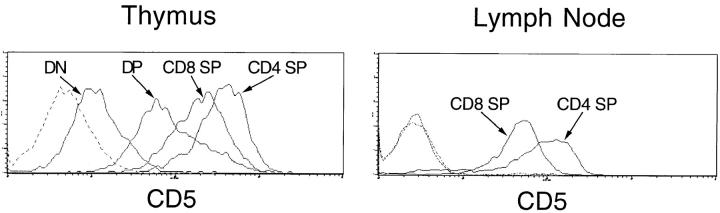
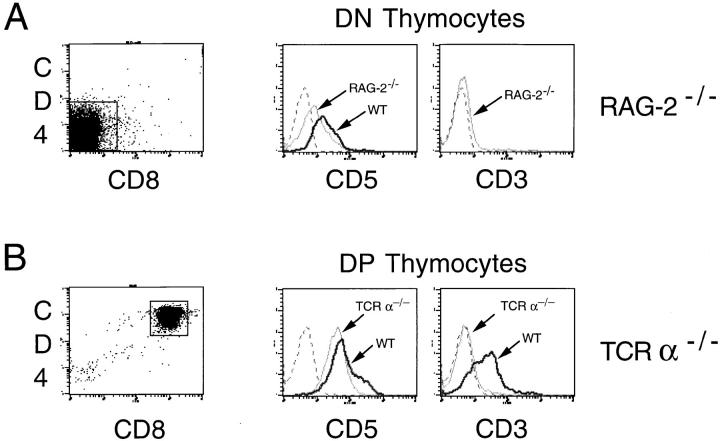
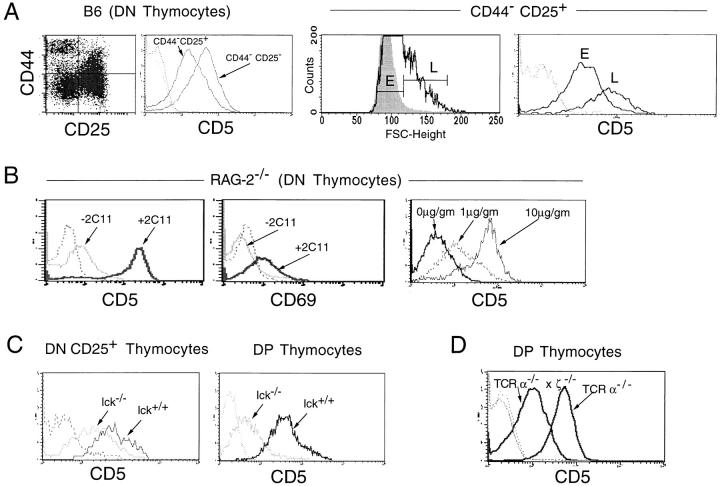
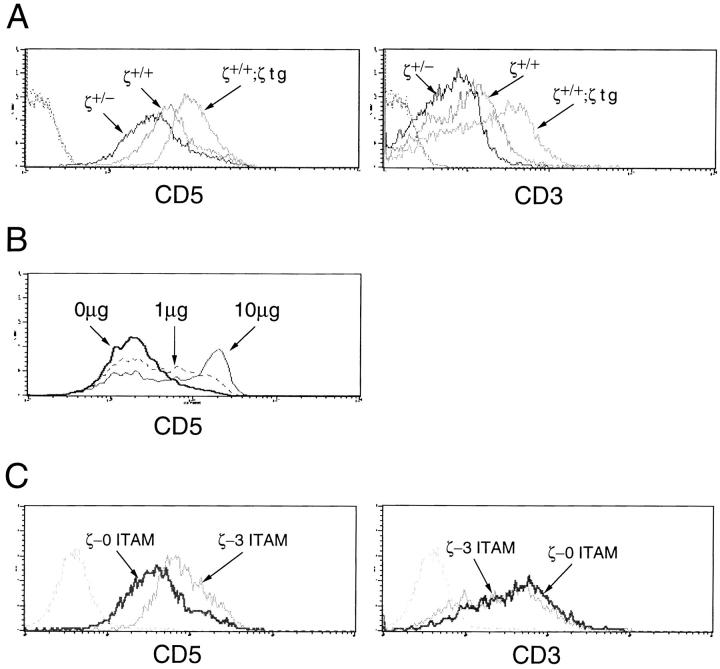
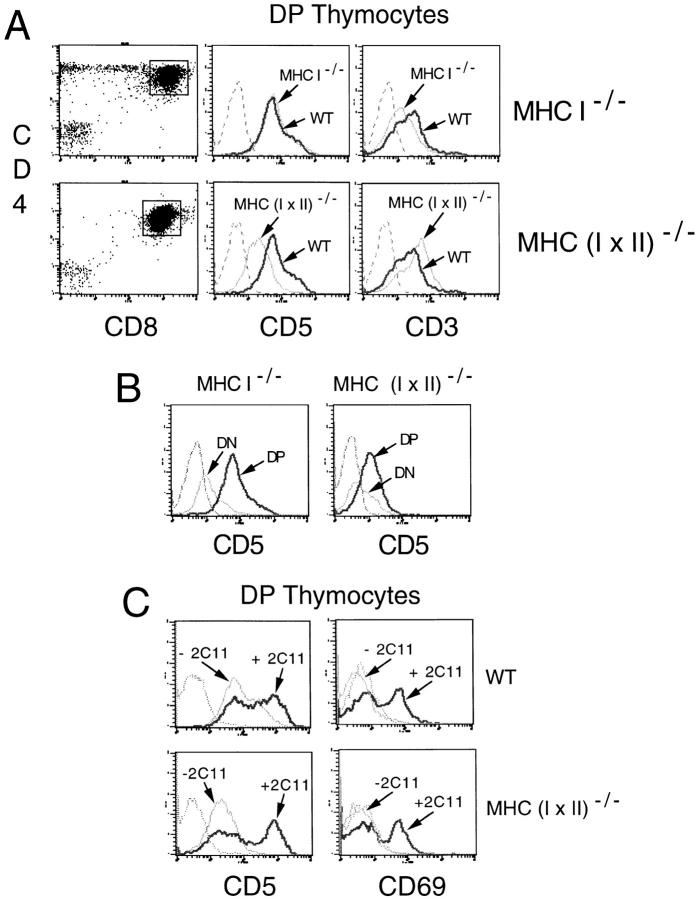
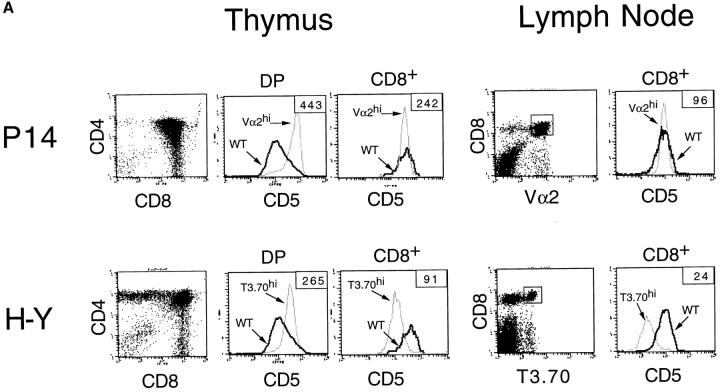
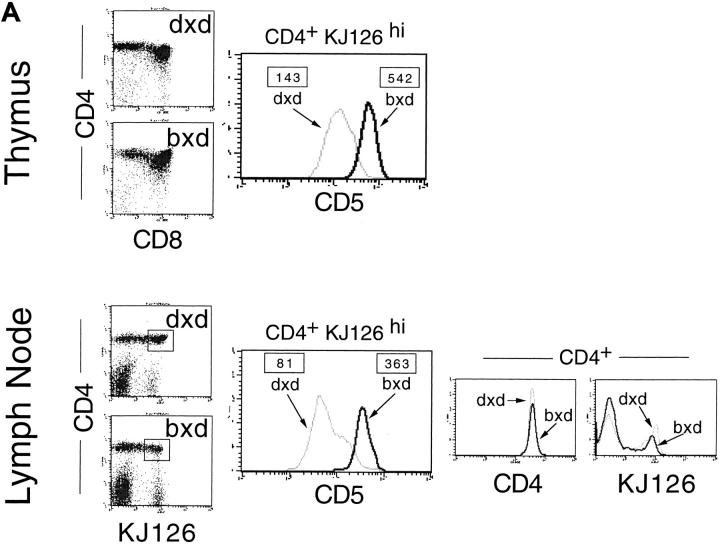
Recent data indicate that the cell surface glycoprotein CD5 functions as a negative regulator of T cell receptor (TCR)-mediated signaling. In this study, we examined the regulation of CD5 surface expression during normal thymocyte ontogeny and in mice with developmental and/or signal transduction defects. The results demonstrate that low level expression of CD5 on CD4−CD8− (double negative, DN) thymocytes is independent of TCR gene rearrangement; however, induction of CD5 surface expression on DN thymocytes requires engagement of the pre-TCR and is dependent upon the activity of p56lck. At the CD4+CD8+ (double positive, DP) stage, intermediate CD5 levels are maintained by low affinity TCR–major histocompatibility complex (MHC) interactions, and CD5 surface expression is proportional to both the surface level and signaling capacity of the TCR. High-level expression of CD5 on DP and CD4+ or CD8+ (single positive, SP) thymocytes is induced by engagement of the α/β-TCR by (positively or negatively) selecting ligands. Significantly, CD5 surface expression on mature SP thymocytes and T cells was found to directly parallel the avidity or signaling intensity of the positively selecting TCR–MHC-ligand interaction. Taken together, these observations suggest that the developmental regulation of CD5 in response to TCR signaling and TCR avidity represents a mechanism for fine tuning of the TCR signaling response.
Overview
The claims and statistics of this paper haven’t been checked yet.
Run the check — free, no account needed. It reads the open-access text and checks the sources it cites.
Integrity signals
Registry
Cites
Statistics
Figures
Verification
Claims the paper makes
The claims and statistics of this paper haven’t been checked yet.
Run the check — free, no account needed. It reads the open-access text and checks the sources it cites.
Claims other papers make about this one
Each is checked against this paper’s own text: does it say what the citing paper says it does?
In the citing paper
“Since expression levels of CD2 and CD5 correlate well to the strength of TCR signal [24, 25]”
From Overexpression of RhoH Permits to Bypass the Pre-TCR Checkpoint (2015) · cites this paper as [24]
Self-check
Percentages, sums and reported differences re-computed from the paper’s own numbers.
The self-check needs the paper’s full text.
Citations
Cites
No references could be resolved yet.
Research works printed but not linked: 50
- Ledbetter, 1980, T cell subsets defined by expression of Lyt-1,2,3 and Thy-1 antigens: two parameter immunofluorescence and cytotoxicity analysis with monoclonal antibodies modifies current views, J Exp Med, 152, 280, 10.1084/jem.152.2.280 · DOI
- Hayakawa, 1983, The “Ly-1 B” cell subpopulation in normal, immunodefective, and autoimmune mice, J Exp Med, 157, 202, 10.1084/jem.157.1.202 · DOI
- Fowlkes, 1985, Early T lymphocytes: differentiation in vivo of adult intrathymic precursor cells, J Exp Med, 162, 802, 10.1084/jem.162.3.802 · DOI
- Huang, 1987, Molecular cloning of Ly-1, a membrane glycoprotein of mouse T lymphocytes and a subset of B cells: molecular homology to its human counterpart Leu-1/T1 (CD5), Proc Natl Acad Sci USA, 84, 204, 10.1073/pnas.84.1.204 · DOI
- Van De Helde, 1991, The B-cell surface protein CD72/Lyb2 is the ligand for CD5, Nature, 351, 662, 10.1038/351662a0 · DOI
- Biancone, 1996, Identification of a novel inducible cell-surface ligand of CD5 on activated lymphocytes, J Exp Med, 184, 811, 10.1084/jem.184.3.811 · DOI
- Thomas, 1995, Of ITAMs and ITIMs: turning on and off the B cell antigen receptor, J Exp Med, 181, 1953, 10.1084/jem.181.6.1953 · DOI
- Davies, 1992, CD5 is phosphorylated on tyrosine after stimulation of the T-cell antigen receptor complex, Proc Natl Acad Sci USA, 89, 6368, 10.1073/pnas.89.14.6368 · DOI
- Beyers, 1992, Molecular associations between the T-lymphocyte antigen receptor complex and the surface antigens CD2, CD4, or CD8 and CD5, Proc Natl Acad Sci USA, 89, 2945, 10.1073/pnas.89.7.2945 · DOI
- Burgess, 1992, CD5 acts as a tyrosine kinase substrate within a receptor complex comprising T-cell receptor ζ chain/CD3 and protein-tyrosine kinases p56lck and p59fyn, Proc Natl Acad Sci USA, 89, 9311, 10.1073/pnas.89.19.9311 · DOI
- Pani, 1996, Signaling capacity of the T cell antigen receptor is negatively regulated by the PTP1C tyrosine phosphatase, J Exp Med, 184, 839, 10.1084/jem.184.3.839 · DOI
- Gary-Gouy, 1997, In vivo association of CD5 with tyrosine-phosphorylated Zap-70 and p21 phospho-ζ molecules in human CD3+thymocytes, J Immunol, 159, 3739, 10.4049/jimmunol.159.8.3739 · DOI
- Ceuppens, 1986, Monoclonal antibodies to the CD5 antigen can provide the necessary second signal for activation of isolated resting T cells by solid-phase-bound OKT3, J Immunol, 137, 1816, 10.4049/jimmunol.137.6.1816 · DOI
- Spertini, 1991, Induction of human T cell proliferation by a monoclonal antibody to CD5, J Immunol, 146, 47, 10.4049/jimmunol.146.1.47 · DOI
- Stanton, 1986, Anti-Ly-1 antibody induces interleukin 2 release from T cells, J Immunol, 136, 1734, 10.4049/jimmunol.136.5.1734 · DOI
- Tarakhovsky, 1995, A role for CD5 in TCR-mediated signal transduction and thymocyte selection, Science, 269, 535, 10.1126/science.7542801 · DOI
- Bikah, 1996, CD5-mediated negative regulation of antigen receptor-induced growth signals in B-1 B cells, Science, 274, 1906, 10.1126/science.274.5294.1906 · DOI
- Shinkai, 1992, Rag-2 deficient mice lack mature lymphocytes owing to inability to initiate V(D)J rearrangement, Cell, 68, 855, 10.1016/0092-8674(92)90029-C · DOI · Paper page
- Zijlstra, 1989, Germ-line transmission of β2-microglobulin gene produced by homologous recombination in embryonic stem cells, Nature, 342, 435, 10.1038/342435a0 · DOI
- Grusby, 1991, Depletion of CD4+T cells in major histocompatibility complex class II-deficient mice, Science, 253, 1417, 10.1126/science.1910207 · DOI
- Grusby, 1993, Mice lacking major histocompatibility complex class I and class II molecules, Proc Natl Acad Sci USA, 90, 3913, 10.1073/pnas.90.9.3913 · DOI
- Molina, 1992, Profound block in thymocyte development in mice lacking p56lck, Nature, 357, 161, 10.1038/357161a0 · DOI
- Pircher, 1989, Tolerance induction in double specific T-cell receptor transgenic mice varies with antigen, Nature, 342, 559, 10.1038/342559a0 · DOI
- Von Boehmer, 1990, Developmental biology of T cells in T cell receptor transgenic mice, Annu Rev Immunol, 8, 531, 10.1146/annurev.iy.08.040190.002531 · DOI
- Kaye, 1989, Selective development of CD4+T cells in transgenic mice expressing a class II MHC-restricted antigen receptor, Nature, 341, 746, 10.1038/341746a0 · DOI
- Murphy, 1990, Induction by antigen of intrathymic apoptosis of CD4+CD8+ TCRlothymocytes in vivo, Science, 250, 1720, 10.1126/science.2125367 · DOI
- Love, 1993, T cell development in mice that lack the ζ chain of the T cell antigen receptor complex, Science, 261, 918, 10.1126/science.7688481 · DOI
- Shores, 1994, Role of TCRζ chain in T cell development and selection, Science, 226, 1047, 10.1126/science.7526464 · DOI
- Borst, 1996, Composition and function of T-cell receptor and B-cell receptor complexes on precursor lymphocytes, Curr Opin Immunol, 8, 181, 10.1016/S0952-7915(96)80056-2 · DOI
- Punt, 1996, Lineage commitment in the thymus: only the most differentiated (TCRhibcl-2hi) subset of CD4+CD8+thymocytes has selectively terminated CD4 or CD8 synthesis, J Exp Med, 184, 2091, 10.1084/jem.184.6.2091 · DOI
- Godfrey, 1993, Control points in early T-cell development, Immunol Today, 14, 547, 10.1016/0167-5699(93)90186-O · DOI
- Hoffman, 1996, Productive T-cell receptor beta-chain rearrangement: coincident regulation of cell cycle and clonality during development in vivo, Genes Dev, 10, 948, 10.1101/gad.10.8.948 · DOI
- Levelt, 1993, Restoration of early thymocyte differentiation in T-cell receptor β-chain deficient mutant mice by transmembrane signaling through CD3ε, Proc Natl Acad Sci USA, 90, 11401, 10.1073/pnas.90.23.11401 · DOI
- Shinkai, 1993, Restoration of T cell development in RAG-2-deficient mice by functional TCR transgenes, Science, 259, 822, 10.1126/science.8430336 · DOI
- Wiest, 1995, The molecular chaperone calnexin is expressed on the surface of immature thymocytes in association with clonotype-independent CD3 complexes, EMBO (Eur Mol Biol Organ) J, 14, 3425, 10.1002/j.1460-2075.1995.tb07348.x · DOI
- Levelt, 1995, Regulation of thymocyte development through CD3: functional dissociation between p56lckand CD3ζ in early thymic selection, Immunity, 3, 215, 10.1016/1074-7613(95)90091-8 · DOI
- Kearse, 1995, Early molecular events induced by T cell receptor (TCR) signaling in immature CD4+CD3+thymocytes: increased synthesis of TCR-α protein is an early response to TCR signaling that compensates for TCR-α instability, improves TCR assembly, and parallels other indicators of positive selection, J Exp Med, 181, 193, 10.1084/jem.181.1.193 · DOI
- Sheard, 1996, Heterogeneous expression of recombination activating genes and surface CD5 in CD3low CD4+CD8+thymocytes, J Immunol, 43, 619
- Groves, 1997, TCR engagement of CD4+CD8+thymocytes in vitro induces early aspects of positive selection, but not apoptosis, J Immunol, 158, 65, 10.4049/jimmunol.158.1.65 · DOI
- Punt, 1994, Negative selection of CD4+CD8+thymocytes by T cell receptor–induced apoptosis requires a costimulatory signal that can be provided by CD28, J Exp Med, 179, 709, 10.1084/jem.179.2.709 · DOI
- Jameson, 1995, Positive selection of thymocytes, Annu Rev Immunol, 13, 93, 10.1146/annurev.iy.13.040195.000521 · DOI
- Matechak, 1996, MHC class II-specific T cells can develop in the CD8 lineage when CD4 is absent, Immunity, 4, 337, 10.1016/S1074-7613(00)80247-2 · DOI
- Liu, 1996, Thymocytes can become mature T cells without passing through the CD4+CD8+, double positive stage, J Exp Med, 184, 1619, 10.1084/jem.184.5.1619 · DOI
- I, 1996, Day 11 mouse fetal thymus: phenotype and search for the point of commitment, Differentiation, 61, 53, 10.1046/j.1432-0436.1996.6110053.x · DOI
- Suzuki, 1997, Commitment of immature CD4+CD8+thymocytes to the CD4 lineage requires CD3 signaling but does not require expression of clonotypic T cell receptor (TCR) chains, J Exp Med, 186, 17, 10.1084/jem.186.1.17 · DOI
- Malissen, 1996, Functions of TCR and pre-TCR subunits: lessons from gene ablation, Curr Opin Immunol, 8, 383, 10.1016/S0952-7915(96)80129-4 · DOI
- Groves, 1996, Fyn can partially substitute for Lck in T lymphocyte development, Immunity, 5, 417, 10.1016/S1074-7613(00)80498-7 · DOI
- Tarakhovsky, 1994, Lymphocyte populations and immune responses in CD5-deficient mice, Eur J Immunol, 24, 1678, 10.1002/eji.1830240733 · DOI
- Dutz, 1995, Distinct differentiative stages of CD4+CD8+thymocyte development defined by the lack of coreceptor binding in positive selection, J Immunol, 154, 2588, 10.4049/jimmunol.154.6.2588 · DOI
- Robey, 1994, Selective events in T cell development, Annu Rev Immunol, 12, 675, 10.1146/annurev.iy.12.040194.003331 · DOI
Cited by
Taghon, T., Yui, M. A., Pant, R., Diamond, R. A., & Rothenberg, E. V. (2006) · Immunity · doi:10.1016/j.immuni.2005.11.012 · Cited by 312
White, J. T., Cross, E. W., Burchill, M. A., Danhorn, T., McCarter, M. D., Rosen, H. R., O’Connor, B., & Kedl, R. M. (2016) · Nature Communications · doi:10.1038/ncomms11291 · Cited by 219
Gu, Y., Chae, H.-D., Siefring, J. E., Jasti, A. C., Hildeman, D. A., & Williams, D. A. (2006) · Nature Immunology · doi:10.1038/ni1396 · Cited by 110
LKB1 is essential for the proliferation of T‐cell progenitors and mature peripheral T cells
Tamás, P., Macintyre, A., Finlay, D., Clarke, R., Feijoo‐Carnero, C., Ashworth, A., & Cantrell, D. (2010) · European Journal of Immunology · doi:10.1002/eji.200939677 · Cited by 94
Quinn, K. M., Zaloumis, S. G., Cukalac, T., Kan, W.-T., Sng, X. Y. X., Mirams, M., Watson, K. A., McCaw, J. M., Doherty, P. C., Thomas, P. G., et al. (2016) · Proceedings of the National Academy of Sciences · doi:10.1073/pnas.1525167113 · Cited by 47
Metadata
- Authors
- Azzam, H. S., Grinberg, A., Lui, K., Shen, H., Shores, E. W., & Love, P. E.
- Affiliations
- From the *Laboratory of Mammalian Genes and Development, National Institute of Child Health and Human Development, National Institutes of Health, Bethesda, Maryland 20892; and the ‡Division of Hematologic Products, Center for Biologics Evaluation and Research, Food and Drug Administration, Bethesda, Maryland 20892
- Venue
- The Journal of Experimental Medicine
- Publisher
- Rockefeller University Press
- Published
- 1998-12-21
- Volume
- 188
- Issue
- 12
- Pages
- 2301-2311
- ISSN
- 0022-1007
- 1540-9538
- PMC
- PMC2212429
- Cited by
- 587
- References
- 0
- Language
- en
About these checks
Registry, retraction, Cites and statistics results are computed, not judged, with one exception: a printed reference that no index lists is read once by a model before it counts as a citation error. Claims are extracted by a model and kept only when their quote appears verbatim in the text; each cited source is then checked, with a model’s help, for whether it says what the claim relies on. Those verdicts can be wrong — read the claim’s quote and the cited source before relying on one.
Statistics and arithmetic are recomputed, not judged.
Confidence bands are shown only for fields calibrated on our annotated test set. None is calibrated yet, so no band is shown.
What counts as a claim ›How we measure confidence ›How we check this ›
Are you an author, or do you see a problem with this page? Request a review
How to cite
Cite CoChat for the checks on this page, and the paper for its own findings.
- This page
- CoChat. (2026). Citation check: CD5 Expression Is Developmentally Regulated By T Cell Receptor (TCR) Signals and TCR Avidity. https://app.cochat.ai/papers/10.1084/jem.188.12.2301
- The paper
- Azzam, H. S., Grinberg, A., Lui, K., Shen, H., Shores, E. W., & Love, P. E. (1998). CD5 Expression Is Developmentally Regulated By T Cell Receptor (TCR) Signals and TCR Avidity. The Journal of Experimental Medicine. https://doi.org/10.1084/jem.188.12.2301
