

The DOI matches its Crossref record; 16 of the 16 references it cites were found in a registry or an index.
Effect of Nasal Obstruction on Continuous Positive Airway Pressure Treatment: Computational Fluid Dynamics Analyses
Open accessAbstract
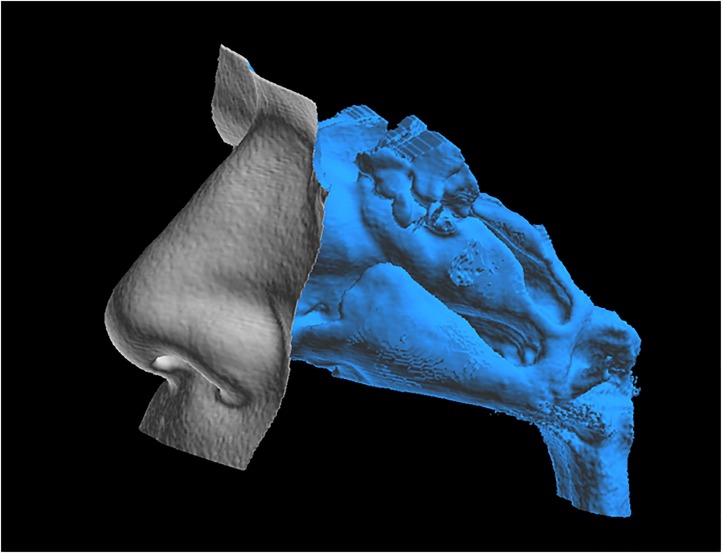
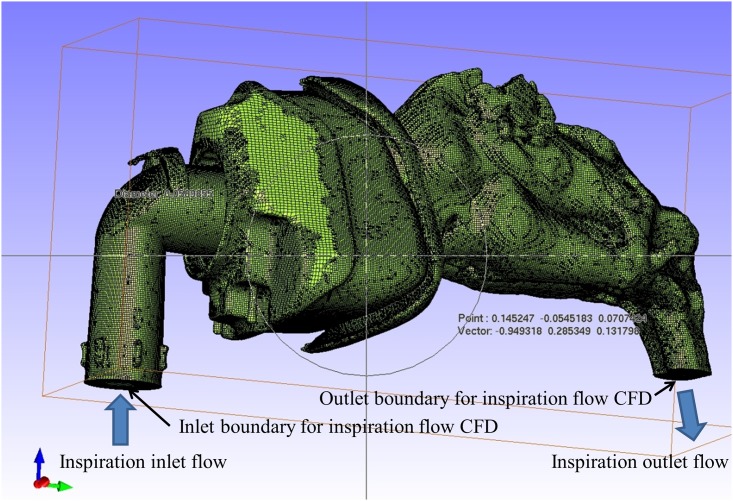
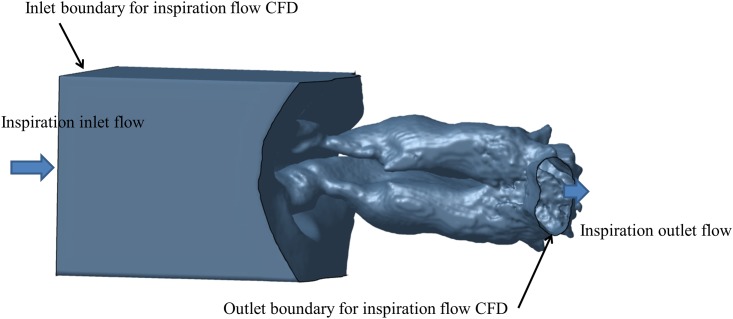
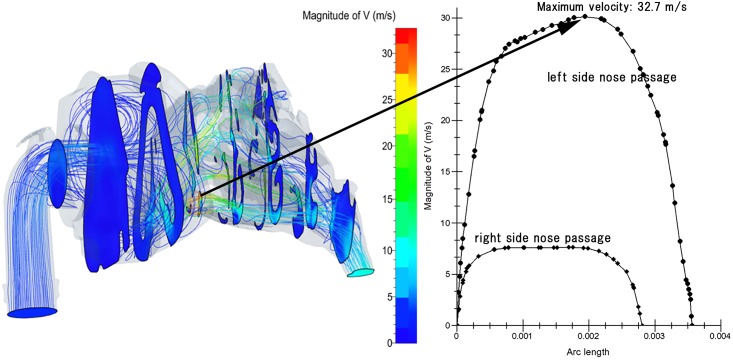
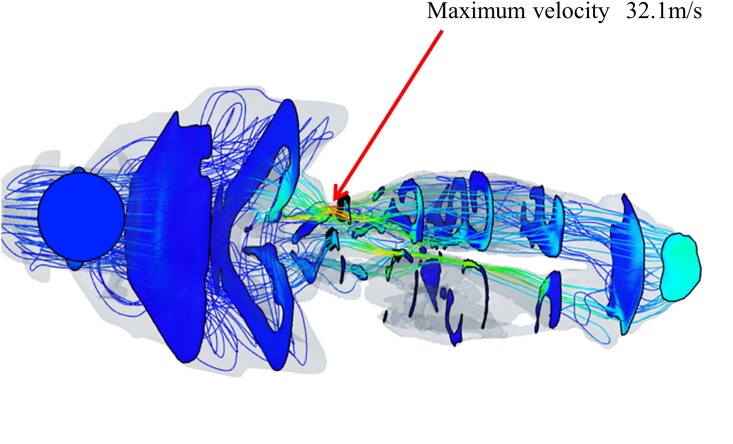
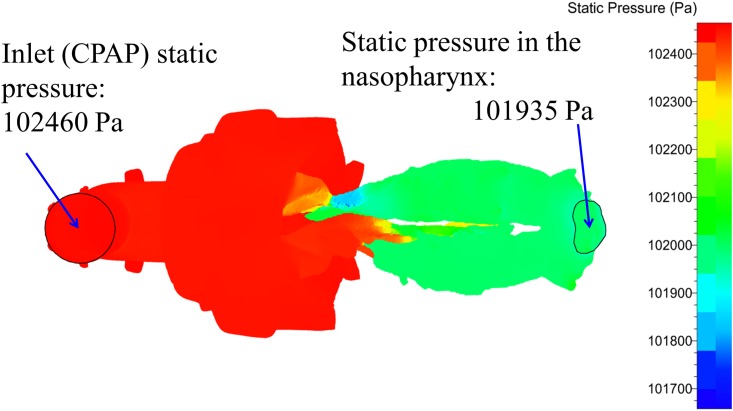
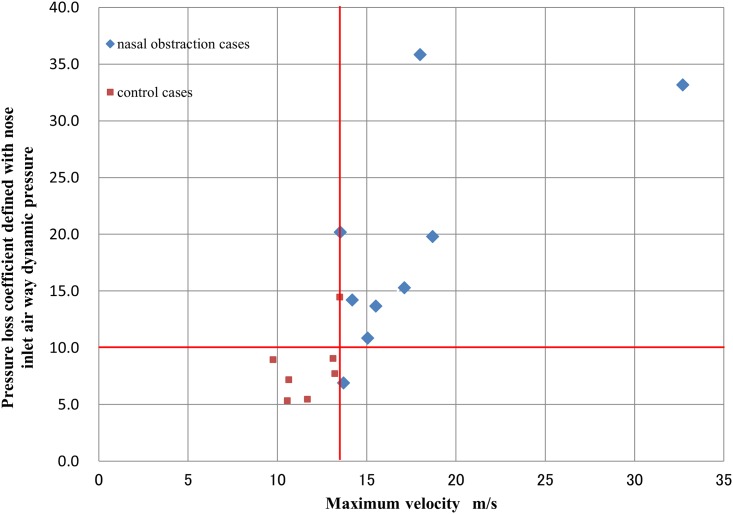
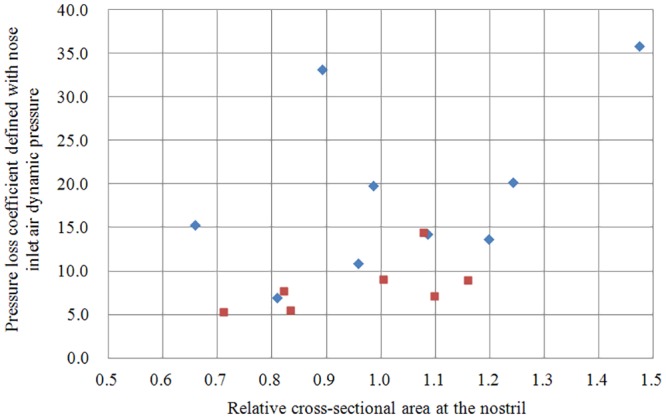
OBJECTIVE: Nasal obstruction is a common problem in continuous positive airway pressure (CPAP) therapy for obstructive sleep apnea and limits treatment compliance. The purpose of this study is to model the effects of nasal obstruction on airflow parameters under CPAP using computational fluid dynamics (CFD), and to clarify quantitatively the relation between airflow velocity and pressure loss coefficient in subjects with and without nasal obstruction. METHODS: We conducted an observational cross-sectional study of 16 Japanese adult subjects, of whom 9 had nasal obstruction and 7 did not (control group). Three-dimensional reconstructed models of the nasal cavity and nasopharynx with a CPAP mask fitted to the nostrils were created from each subject's CT scans. The digital models were meshed with tetrahedral cells and stereolithography formats were created. CPAP airflow simulations were conducted using CFD software. Airflow streamlines and velocity contours in the nasal cavities and nasopharynx were compared between groups. Simulation models were confirmed to agree with actual measurements of nasal flow rate and with pressure and flow rate in the CPAP machine. RESULTS: Under 10 cmH2O CPAP, average maximum airflow velocity during inspiration was 17.6 ± 5.6 m/s in the nasal obstruction group but only 11.8 ± 1.4 m/s in the control group. The average pressure drop in the nasopharynx relative to inlet static pressure was 2.44 ± 1.41 cmH2O in the nasal obstruction group but only 1.17 ± 0.29 cmH2O in the control group. The nasal obstruction and control groups were clearly separated by a velocity threshold of 13.5 m/s, and pressure loss coefficient threshold of approximately 10.0. In contrast, there was no significant difference in expiratory pressure in the nasopharynx between the groups. CONCLUSION: This is the first CFD analysis of the effect of nasal obstruction on CPAP treatment. A strong correlation between the inspiratory pressure loss coefficient and maximum airflow velocity was found.
Overview
The claims and statistics of this paper haven’t been checked yet.
Run the check — free, no account needed. It reads the open-access text and checks the sources it cites.
Integrity signals
Registry
Cites
Statistics
Figures
Verification
Claims the paper makes
The claims and statistics of this paper haven’t been checked yet.
Run the check — free, no account needed. It reads the open-access text and checks the sources it cites.
Claims other papers make about this one
Each is checked against this paper’s own text: does it say what the citing paper says it does?
The source backs part of the claim, not all of it — or backs it for a different population, condition or comparison.
In the citing paper
“Other permeability assessment techniques, such as computational analysis of nasal fluid dynamics from simulations on computed tomography, are expensive and still not widely used [79,80].”
From Position Paper on Nasal Obstruction: Evaluation and Treatment (2018) · cites this paper as [80]
Experimental — accuracy not yet measured
Self-check
Percentages, sums and reported differences re-computed from the paper’s own numbers.
The self-check needs the paper’s full text.
Citations
Cites
Principles and Practice of Sleep Medicine
(2011) · Elsevier eBooks · doi:10.1016/c2009-0-59875-3 · Cited by 5,088
Kushida, C. A., Littner, M. R., Hirshkowitz, M., Morgenthaler, T. I., Alessi, C. A., Bailey, D., Boehlecke, B., Brown, T. M., Coleman, J., Friedman, L., et al. (2006) · Sleep · doi:10.1093/sleep/29.3.375 · Cited by 775
Atrophic rhinitis: a CFD study of air conditioning in the nasal cavity
Garcia, G. J. M., Bailie, N., Martins, D. A., & Kimbell, J. S. (2007) · Journal of Applied Physiology · doi:10.1152/japplphysiol.01118.2006 · Cited by 227
Assessment of septal deviation effects on nasal air flow: A computational fluid dynamics model
Chen, X. B., Lee, H. P., Chong, V. F. H., & Wang, D. Y. (2009) · The Laryngoscope · doi:10.1002/lary.20585 · Cited by 138
Zhao, M., Barber, T. J., Cistulli, P. A., Sutherland, K., & Rosengarten, G. (2012) · Journal of Biomechanics · doi:10.1016/j.jbiomech.2012.10.033 · Cited by 117
Aerodynamic Effects of Inferior Turbinate Reduction: Computational Fluid Dynamics Simulation
Wexler, D. B., Segal, R. A., & Kimbell, J. S. (2005) · Archives of Otolaryngology - Head and Neck Surgery · doi:10.1001/archotol.131.12.1102 · Cited by 90
Zhao, K., Pribitkin, E. A., Cowart, B. J., Rosen, D. M., Scherer, P. W., & Dalton, P. (2006) · American Journal of Rhinology · doi:10.2500/ajr.2006.20.2848 · Cited by 83
Toward Personalized Nasal Surgery Using Computational Fluid Dynamics
Rhee, J. S. (2011) · Archives of Facial Plastic Surgery · doi:10.1001/archfacial.2011.18 · Cited by 79
Arousal Responses to Olfactory or Trigeminal Stimulation During Sleep
Stuck, B. A., Stieber, K. F., Frey, S., Freiburg, C., Hörmann, K., Maurer, J. T., & Hummel, T. R. (2007) · SLEEP · doi:10.1093/sleep/30.4.506 · Cited by 56
Changes of Airflow Pattern in Inferior Turbinate Hypertrophy: A Computational Fluid Dynamics Model
Lee, H. P., Poh, H. J., Chong, F. H., & Wang, D. Y. (2009) · American Journal of Rhinology and Allergy · doi:10.2500/ajra.2009.23.3287 · Cited by 52
Cited by
Position Paper on Nasal Obstruction: Evaluation and Treatment
SEAIC Rhinoconjunctivitis Committee & SEORL Rhinology, A., Valero, A., Navarro, A., del Cuvillo, A., Alobid, I., Benito, Jr., Colás, C., de los Santos, G., Fernández Liesa, R., García-Lliberós, A., et al. (2018) · Journal of Investigational Allergology and Clinical Immunology · doi:10.18176/jiaci.0232 · Cited by 76
Metadata
- Authors
- Wakayama, T., Suzuki, M., & Tanuma, T.
- Affiliations
- Teikyo University (JP)
- Teikyo University Chiba Medical Center (JP)
- Corresponding author
- Wakayama, Tadashi
- Suzuki, Masaaki
- Tanuma, Tadashi
- ORCID
- Suzuki, Masaaki
- Venue
- PLOS ONE
- Publisher
- Public Library of Science (PLoS)
- Published
- 2016-03-04
- Volume
- 11
- Issue
- 3
- Pages
- e0150951
- ISSN
- 1932-6203 (ISSN-L)
- PMC
- PMC4778797
- OpenAlex
- W2294451322
- Cited by
- 39
- References
- 16
- Citations by year
- 2026: 5 · 2025: 2 · 2024: 6 · 2023: 3 · 2022: 1 · 2021: 11 · 2020: 5 · 2019: 2 · 2018: 2 · 2017: 1 · 2016: 1
- FWCI
- 1.61
- Type
- journal article
- Language
- en
- Open access
- gold
- doi.org
- Licence
- Locations
- PLoS ONE (publishedVersion, cc-by)
- Europe PMC (PubMed Central) (publishedVersion, cc-by)
- PubMed Central (publishedVersion, cc-by)
- PubMed (publishedVersion)
- Institutional Repositories DataBase (IRDB) (publishedVersion)
- DOAJ (DOAJ: Directory of Open Access Journals) (submittedVersion, cc-by-sa)
- Institutional Repositories DataBase (IRDB) (submittedVersion, cc-by)
- Topics
- Health Sciences › Medicine › Physiology (medical) › Obstructive Sleep Apnea Research
- Health Sciences › Medicine › Surgery › Nasal Surgery and Airway Studies
- Health Sciences › Medicine › Pulmonary and Respiratory Medicine › Respiratory Support and Mechanisms
- Keywords
- nasal obstruction, continuous positive airway pressure, obstructive sleep apnea, pressure loss coefficient, CPAP masks
- MeSH terms
- Adult, Aged, Humans, Middle Aged, Nasal Cavity, Nasopharynx, Radiographic Image Interpretation, Computer-Assisted, Pulmonary Ventilation, Tomography, X-Ray Computed, Nasal Obstruction, Continuous Positive Airway Pressure, Hydrodynamics
About these checks
Registry, retraction, Cites and statistics results are computed, not judged, with one exception: a printed reference that no index lists is read once by a model before it counts as a citation error. Claims are extracted by a model and kept only when their quote appears verbatim in the text; each cited source is then checked, with a model’s help, for whether it says what the claim relies on. Those verdicts can be wrong — read the claim’s quote and the cited source before relying on one.
Statistics and arithmetic are recomputed, not judged.
Confidence bands are shown only for fields calibrated on our annotated test set. None is calibrated yet, so no band is shown.
What counts as a claim ›How we measure confidence ›How we check this ›
Are you an author, or do you see a problem with this page? Request a review
Data sources
Bibliographic data: Semantic Scholar, OpenAlex, Crossref.
Contains information from the Semantic Scholar Academic Graph Datasets, made available under the ODC Attribution License (ODC-BY 1.0).
Semantic Scholar’s data is described in: Kinney, R., et al. (2023). The Semantic Scholar Open Data Platform. arXiv:2301.10140.
