

The DOI matches its Crossref record; 34 of the 34 references it cites were found in a registry or an index.
Microsatellite Length Scoring by Single Molecule Real Time Sequencing – Effects of Sequence Structure and PCR Regime
Abstract
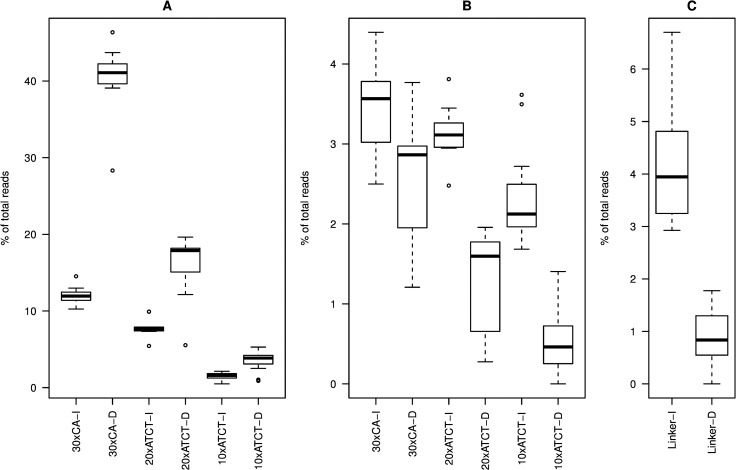
Microsatellites are DNA sequences consisting of repeated, short (1-6 bp) sequence motifs that are highly mutable by enzymatic slippage during replication. Due to their high intrinsic variability, microsatellites have important applications in population genetics, forensics, genome mapping, as well as cancer diagnostics and prognosis. The current analytical standard for microsatellites is based on length scoring by high precision electrophoresis, but due to increasing efficiency next-generation sequencing techniques may provide a viable alternative. Here, we evaluated single molecule real time (SMRT) sequencing, implemented in the PacBio series of sequencing apparatuses, as a means of microsatellite length scoring. To this end we carried out multiplexed SMRT sequencing of plasmid-carried artificial microsatellites of varying structure under different pre-sequencing PCR regimes. For each repeat structure, reads corresponding to the target length dominated. We found that pre-sequencing amplification had large effects on scoring accuracy and error distribution relative to controls, but that the effects of the number of amplification cycles were generally weak. In line with expectations enzymatic slippage decreased proportionally with microsatellite repeat unit length and increased with repetition number. Finally, we determined directional mutation trends, showing that PCR and SMRT sequencing introduced consistent but opposing error patterns in contraction and expansion of the microsatellites on the repeat motif and single nucleotide level.
Overview
The claims and statistics of this paper haven’t been checked yet.
Run the check — free, no account needed. It reads the open-access text and checks the sources it cites.
Integrity signals
Registry
Cites
Statistics
Figures
Verification
Claims the paper makes
The claims and statistics of this paper haven’t been checked yet.
Run the check — free, no account needed. It reads the open-access text and checks the sources it cites.
Claims other papers make about this one
Each is checked against this paper’s own text: does it say what the citing paper says it does?
In the citing paper
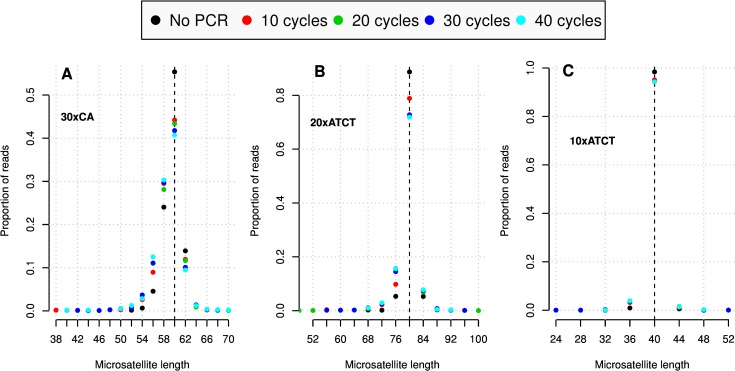
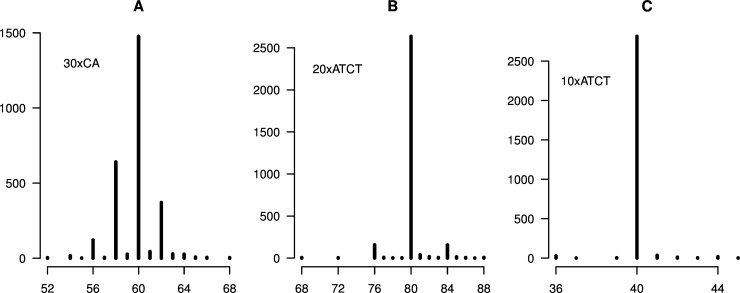
“In one study (61), the authors investigated how PacBio reads handled different STRs, and showed that <50% of reads called the correct length of a STR consisting of 30xAC, most likely due to polymerase slippage errors.”
From Tandem repeats lead to sequence assembly errors and impose multi-level challenges for genome and protein databases (2019) · cites this paper as [61]
Self-check
Percentages, sums and reported differences re-computed from the paper’s own numbers.
The self-check needs the paper’s full text.
Citations
Cites
Yanisch-Perron, C., Vieira, J., & Messing, J. (1985) · Gene · doi:10.1016/0378-1119(85)90120-9 · Cited by 15,041
Real-Time DNA Sequencing from Single Polymerase Molecules
Eid, J., Fehr, A., Gray, J., Luong, K., Lyle, J., Otto, G., Peluso, P., Rank, D., Baybayan, P., Bettman, B., et al. (2009) · Science · doi:10.1126/science.1162986 · Cited by 3,732
A comprehensive genetic map of the human genome based on 5,264 microsatellites
Dib, C., Fauré, S., Fizames, C., Samson, D. S., Drouot, N., Alain Vignal, A., Millasseau, P., Marc, S., Kazan, J., Seboun, E., et al. (1996) · Nature · doi:10.1038/380152a0 · Cited by 2,933
Microsatellites: simple sequences with complex evolution
Ellegren, H. (2004) · Nature Reviews Genetics · doi:10.1038/nrg1348 · Cited by 2,429
High efficiency transformation of Escherichia coli with plasmids
Inoue, H., Nojima, H., & Okayama, H. (1990) · Gene · doi:10.1016/0378-1119(90)90336-p · Cited by 2,304
Ohta, T., & Kimura, M. (1973) · Genetical Research · doi:10.1017/s0016672300012994 · Cited by 1,176
Slippage synthesis of simple sequence DNA
Schlötterer, C., & Tautz, D. (1992) · Nucleic Acids Research · doi:10.1093/nar/20.2.211 · Cited by 1,076
Efficient genetic markers for population biology.
Sunnucks, P. (2000) · Trends in Ecology & Evolution · doi:10.1016/s0169-5347(00)01825-5 · Cited by 1,075
Current trends in microsatellite genotyping
GUICHOUX, E., LAGACHE, L., WAGNER, S., CHAUMEIL, P., LÉGER, P., LEPAIS, O., LEPOITTEVIN, C., MALAUSA, T., REVARDEL, E., SALIN, F., et al. (2011) · Molecular Ecology Resources · doi:10.1111/j.1755-0998.2011.03014.x · Cited by 937
Modelling and Smoothing Parameter Estimation With Multiple Quadratic Penalties
Wood, S. N. (2000) · Journal of the Royal Statistical Society Series B: Statistical Methodology · doi:10.1111/1467-9868.00240 · Cited by 728
Cited by
Tørresen, O. K., Star, B., Mier, P., Andrade-Navarro, M. A., Bateman, A., Jarnot, P., Gruca, A., Grynberg, M., Kajava, A. V., Promponas, V. J., et al. (2019) · Nucleic Acids Research · doi:10.1093/nar/gkz841 · Cited by 347
Metadata
- Authors
- Liljegren, M. M., de Muinck, E. J., & Trosvik, P.
- Venue
- PLOS ONE
- Publisher
- Public Library of Science (PLoS)
- Published
- 2016-07-14
- Volume
- 11
- Issue
- 7
- Pages
- e0159232
- ISSN
- 1932-6203
- PMC
- PMC4945053
- Cited by
- 16
- References
- 34
- Language
- en
- Funders
- Norges Forskningsråd (214285/F20)
About these checks
Registry, retraction, Cites and statistics results are computed, not judged, with one exception: a printed reference that no index lists is read once by a model before it counts as a citation error. Claims are extracted by a model and kept only when their quote appears verbatim in the text; each cited source is then checked, with a model’s help, for whether it says what the claim relies on. Those verdicts can be wrong — read the claim’s quote and the cited source before relying on one.
Statistics and arithmetic are recomputed, not judged.
Confidence bands are shown only for fields calibrated on our annotated test set. None is calibrated yet, so no band is shown.
What counts as a claim ›How we measure confidence ›How we check this ›
Are you an author, or do you see a problem with this page? Request a review
How to cite
Cite CoChat for the checks on this page, and the paper for its own findings.
- This page
- CoChat. (2026). Citation check: Microsatellite Length Scoring by Single Molecule Real Time Sequencing – Effects of Sequence Structure and PCR Regime. https://app.cochat.ai/papers/10.1371/journal.pone.0159232
- The paper
- Liljegren, M. M., de Muinck, E. J., & Trosvik, P. (2016). Microsatellite Length Scoring by Single Molecule Real Time Sequencing – Effects of Sequence Structure and PCR Regime. PLOS ONE. https://doi.org/10.1371/journal.pone.0159232
Data sources
Bibliographic data: Semantic Scholar, OpenAlex, Crossref.
Contains information from the Semantic Scholar Academic Graph Datasets, made available under the ODC Attribution License (ODC-BY 1.0).
Semantic Scholar’s data is described in: Kinney, R., et al. (2023). The Semantic Scholar Open Data Platform. arXiv:2301.10140.
