Cited by 33

The DOI matches its Crossref record.

Diamond Nanoparticles Modify Curcumin Activity: In Vitro Studies on Cancer and Normal Cells and In Ovo Studies on Chicken Embryo Model

Strojny, Barbara, Grodzik, Marta, Sawosz, Ewa, Winnicka, Anna, Kurantowicz, Natalia, Jaworski, Sławomir, Kutwin, Marta, Urbańska, Kaja, Hotowy, Anna, Wierzbicki, Mateusz, Chwalibog, André·2016·PLOS ONE

Overview

The claims and statistics of this paper haven’t been checked yet.

Run the check — free, no account needed. It reads the open-access text and checks the sources it cites.

A few free checks a day · papers already verified open instantly · results are public

Integrity signals

Registry

Crossref · 10.1371/journal.pone.0164637

Cites

Statistics

Figures

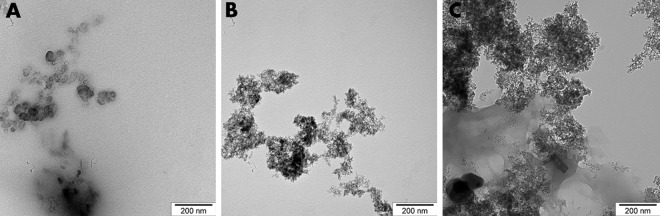
Fig 1 TEM examination of Cur (A), DN (B) and a bio-complex of Cur:DN in a ratio of 1:3 (C).
Fig 1 TEM examination of Cur (A), DN (B) and a bio-complex of Cur:DN in a ratio of 1:3 (C).CC BY · PubMed Central
Fig 2 HepG2 cell viability measured by mitochondrial activity depletion after DN, Cur and DN:Cur bio-complexes treatment, separately for each of the used bio-complexes the DN and Cur concentrations in each of the bio-complexes were 15, 25, 45 and 75, defining the concentrations in mg/L: A–Cur15:DN45 (P < 0.0001 for Cur effect, P = < 0.0001 for DN effect, P = 0.4813 for Cur x DN effect); B–Cur25:DN75 (P < 0.0001 for Cur effect, P = 0.0001 for DN effect, P = 0.3422 for Cur x DN effect); C–Cur45:DN15 (P < 0.0001 for Cur effect, P = 0.0043 for DN effect, P = 0.1610 for Cur x DN effect); D–Cur75:DN25 (P < 0.0001 for Cur effect, P = 0.1207 for DN effect, P = 0.0722 for Cur x DN effect). Graphs show mean ± SD, *** P <0.001, for Cur effect by Bonferroni post-tests following two-way ANOVA with Cur and DN factors.
Fig 2 HepG2 cell viability measured by mitochondrial activity depletion after DN, Cur and DN:Cur bio-complexes treatment, separately for each of the used bio-complexes the DN and Cur concentrations in each of the bio-complexes were 15, 25, 45 and 75, defining the concentrations in mg/L: A–Cur15:DN45 (P < 0.0001 for Cur effect, P = < 0.0001 for DN effect, P = 0.4813 for Cur x DN effect); B–Cur25:DN75 (P < 0.0001 for Cur effect, P = 0.0001 for DN effect, P = 0.3422 for Cur x DN effect); C–Cur45:DN15 (P < 0.0001 for Cur effect, P = 0.0043 for DN effect, P = 0.1610 for Cur x DN effect); D–Cur75:DN25 (P < 0.0001 for Cur effect, P = 0.1207 for DN effect, P = 0.0722 for Cur x DN effect). Graphs show mean ± SD, *** P <0.001, for Cur effect by Bonferroni post-tests following two-way ANOVA with Cur and DN factors.CC BY · PubMed Central
Fig 3 Fibroblast cell viability measured by mitochondrial activity depletion after DN, Cur and DN:Cur bio-complexes treatment, separately for each of the used bio-complexes the DN and Cur concentrations in each of the bio-complex were 15, 25, 45 and 75, defining the concentrations in mg/L: A–Cur15:DN45 (P < 0.0001 for Cur effect, P = < 0.0001 for DN effect, P = 0.1568 for Cur x DN effect); B–Cur25:DN75 (P < 0.0001 for Cur effect, P < 0.0001 for DN effect, P < 0.0001 for Cur x DN effect); C–Cur45:DN15 (P < 0.0001 for Cur effect, P = < 0.0001 for DN effect, P = 0.0615 for Cur x DN effect); D–Cur75:DN25 (P < 0.0001 for Cur effect, P = < 0.0001 for DN effect, P = 0.0495 for Cur x DN effect). Graphs show mean ± SD, ** P <0.01, *** P <0.001, for Cur effect by Bonferroni post-tests following two-way ANOVA with Cur and DN factors and #P <0.05, ###P <0.001 for the Cur x DN interaction.
Fig 3 Fibroblast cell viability measured by mitochondrial activity depletion after DN, Cur and DN:Cur bio-complexes treatment, separately for each of the used bio-complexes the DN and Cur concentrations in each of the bio-complex were 15, 25, 45 and 75, defining the concentrations in mg/L: A–Cur15:DN45 (P < 0.0001 for Cur effect, P = < 0.0001 for DN effect, P = 0.1568 for Cur x DN effect); B–Cur25:DN75 (P < 0.0001 for Cur effect, P < 0.0001 for DN effect, P < 0.0001 for Cur x DN effect); C–Cur45:DN15 (P < 0.0001 for Cur effect, P = < 0.0001 for DN effect, P = 0.0615 for Cur x DN effect); D–Cur75:DN25 (P < 0.0001 for Cur effect, P = < 0.0001 for DN effect, P = 0.0495 for Cur x DN effect). Graphs show mean ± SD, ** P <0.01, *** P <0.001, for Cur effect by Bonferroni post-tests following two-way ANOVA with Cur and DN factors and #P <0.05, ###P <0.001 for the Cur x DN interaction.CC BY · PubMed Central
Fig 4 HepG2 membrane integrity measured by LDH leakage after DN, Cur and DN:Cur bio-complexes treatment, separately for each of the used bio-complexs the DN and Cur concentrations in each of the bio-complexes were 15, 25, 45 and 75, defining the concentrations in mg/L: A–Cur15:DN45 (P < 0.0001 for Cur effect, P = 0.0667 for DN effect, P = 0.4338 for Cur x DN effect); B–Cur25:DN75 (P < 0.0001 for Cur effect, P = 0.0004 for DN effect, P = 0.0024 for Cur x DN effect); C–Cur45:DN15 (P < 0.0001 for Cur effect, P = 0.1844 for DN effect, P = 0.8649 for Cur x DN effect); D–Cur75:DN25 (P < 0.0001 for Cur effect, P = 0.4403 for DN effect, P = 0.3246 for Cur x DN effect). Graphs show mean ± SD, ** P <0.01, *** P <0.001, for Cur effect by Bonferroni post-tests following two-way ANOVA with Cur and DN factors and ###P <0.001 for the Cur x DN interaction.
Fig 4 HepG2 membrane integrity measured by LDH leakage after DN, Cur and DN:Cur bio-complexes treatment, separately for each of the used bio-complexs the DN and Cur concentrations in each of the bio-complexes were 15, 25, 45 and 75, defining the concentrations in mg/L: A–Cur15:DN45 (P < 0.0001 for Cur effect, P = 0.0667 for DN effect, P = 0.4338 for Cur x DN effect); B–Cur25:DN75 (P < 0.0001 for Cur effect, P = 0.0004 for DN effect, P = 0.0024 for Cur x DN effect); C–Cur45:DN15 (P < 0.0001 for Cur effect, P = 0.1844 for DN effect, P = 0.8649 for Cur x DN effect); D–Cur75:DN25 (P < 0.0001 for Cur effect, P = 0.4403 for DN effect, P = 0.3246 for Cur x DN effect). Graphs show mean ± SD, ** P <0.01, *** P <0.001, for Cur effect by Bonferroni post-tests following two-way ANOVA with Cur and DN factors and ###P <0.001 for the Cur x DN interaction.CC BY · PubMed Central
Fig 5 Fibroblast membrane integrity measured by LDH leakage after DN, Cur and DN:Cur bio-complexes treatment, separately for each of the used bio-complex the DN and Cur concentrations in each of the bio-complexes were 15, 25, 45 and 75, defining the concentrations in mg/L: A–Cur15:DN45 (P = 0.0336 for Cur effect, P = 0.0171 for DN effect, P = 0.0952 for Cur x DN effect); B–Cur25:DN75 (P = 0.0136 for Cur effect, P = 0.0003 for DN effect, P = 0.7073 for Cur x DN effect); C–Cur45:DN15 (P < 0.0001 for Cur effect, P = 0.0001 for DN effect, P = 0.0019 for Cur x DN effect); D–Cur75:DN25 (P < 0.0001 for Cur effect, P < 0.0001 for DN effect, P = 0.0001 for Cur x DN effect). Graphs show mean ± SD, * P <0.05, ** P <0.01, *** P <0.001, for Cur effect by Bonferroni post-tests following two-way ANOVA with Cur and DN factors and ##P <0.01, ###P <0.001 for the Cur x DN interaction.
Fig 5 Fibroblast membrane integrity measured by LDH leakage after DN, Cur and DN:Cur bio-complexes treatment, separately for each of the used bio-complex the DN and Cur concentrations in each of the bio-complexes were 15, 25, 45 and 75, defining the concentrations in mg/L: A–Cur15:DN45 (P = 0.0336 for Cur effect, P = 0.0171 for DN effect, P = 0.0952 for Cur x DN effect); B–Cur25:DN75 (P = 0.0136 for Cur effect, P = 0.0003 for DN effect, P = 0.7073 for Cur x DN effect); C–Cur45:DN15 (P < 0.0001 for Cur effect, P = 0.0001 for DN effect, P = 0.0019 for Cur x DN effect); D–Cur75:DN25 (P < 0.0001 for Cur effect, P < 0.0001 for DN effect, P = 0.0001 for Cur x DN effect). Graphs show mean ± SD, * P <0.05, ** P <0.01, *** P <0.001, for Cur effect by Bonferroni post-tests following two-way ANOVA with Cur and DN factors and ##P <0.01, ###P <0.001 for the Cur x DN interaction.CC BY · PubMed Central
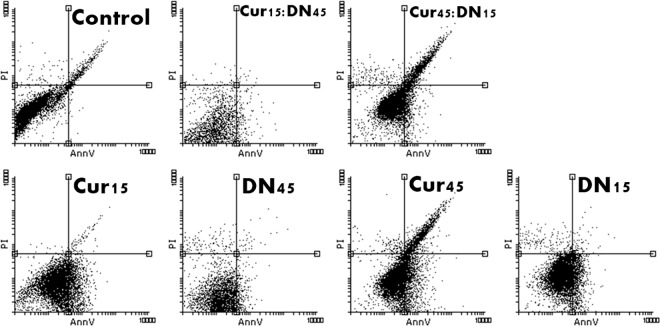
Fig 6 Dot blot/scatter diagrams of PI/AnnV staining of HepG2 cells treated with curcumin (Cur), diamond nanoparticles (DN) and their bio-complexes (Cur:DN) at concentrations of 15 and 45 mg/L. The transition of cells to AnnV quadrants visible for Cur and bio-complex-treated cells.
Fig 6 Dot blot/scatter diagrams of PI/AnnV staining of HepG2 cells treated with curcumin (Cur), diamond nanoparticles (DN) and their bio-complexes (Cur:DN) at concentrations of 15 and 45 mg/L. The transition of cells to AnnV quadrants visible for Cur and bio-complex-treated cells.CC BY · PubMed Central
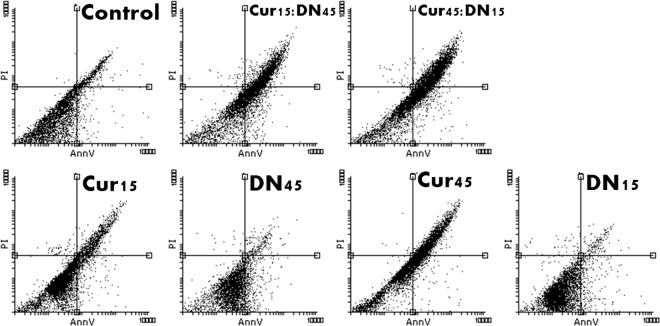
Fig 7 Dot blot/scatter diagrams of PI/AnnV staining of fibroblasts treated with curcumin (Cur), diamond nanoparticles (DN) and their bio-complexes (Cur:DN) at concentrations of 15 and 45 mg/L. The transition of cells to AnnV quadrants visible for bio-complex-treated cells.
Fig 7 Dot blot/scatter diagrams of PI/AnnV staining of fibroblasts treated with curcumin (Cur), diamond nanoparticles (DN) and their bio-complexes (Cur:DN) at concentrations of 15 and 45 mg/L. The transition of cells to AnnV quadrants visible for bio-complex-treated cells.CC BY · PubMed Central
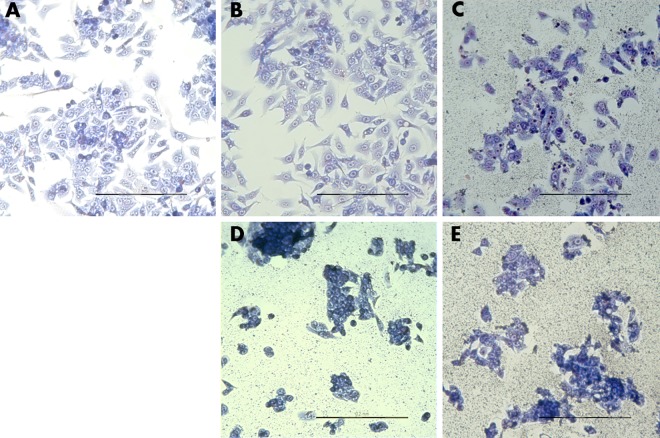
Fig 8 HepG2 cell morphology. Control (A), Cur45 (B), DN45 (C), Cur75:DN25 (D), Cur25:DN75 (E). DN visible on the surface of wells (C–E). Scale bar indicates 200 μm.
Fig 8 HepG2 cell morphology. Control (A), Cur45 (B), DN45 (C), Cur75:DN25 (D), Cur25:DN75 (E). DN visible on the surface of wells (C–E). Scale bar indicates 200 μm.CC BY · PubMed Central
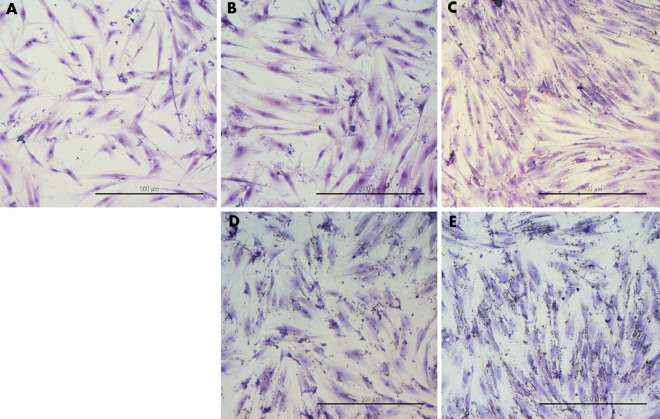
Fig 9 Fibroblast cell morphology. Control (A), Cur45 (B), DN45 (C), Cur75:DN25 (D), Cur25:DN75 (E). Scale bar indicates 500 μm.
Fig 9 Fibroblast cell morphology. Control (A), Cur45 (B), DN45 (C), Cur75:DN25 (D), Cur25:DN75 (E). Scale bar indicates 500 μm.CC BY · PubMed Central
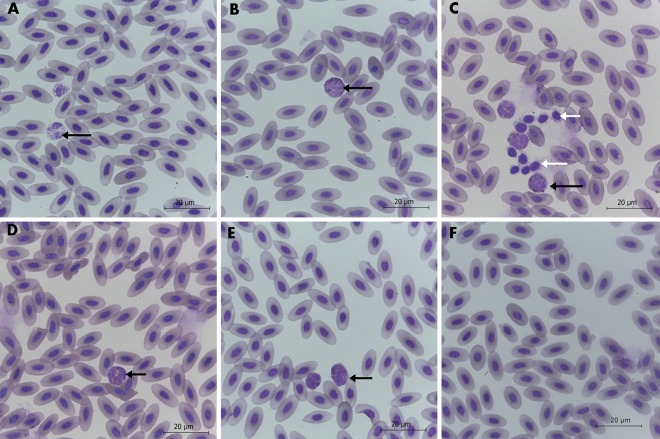
Fig 10 Images of stained chicken blood smears. Groups: Control (A), Placebo (B), Cur (C), DN (D), 3Cur:1DN (E), 1Cur:3DN (F). Heterophils (black arrows) and thrombocytes (white arrows). Scale bar indicates 20 μm.
Fig 10 Images of stained chicken blood smears. Groups: Control (A), Placebo (B), Cur (C), DN (D), 3Cur:1DN (E), 1Cur:3DN (F). Heterophils (black arrows) and thrombocytes (white arrows). Scale bar indicates 20 μm.CC BY · PubMed Central
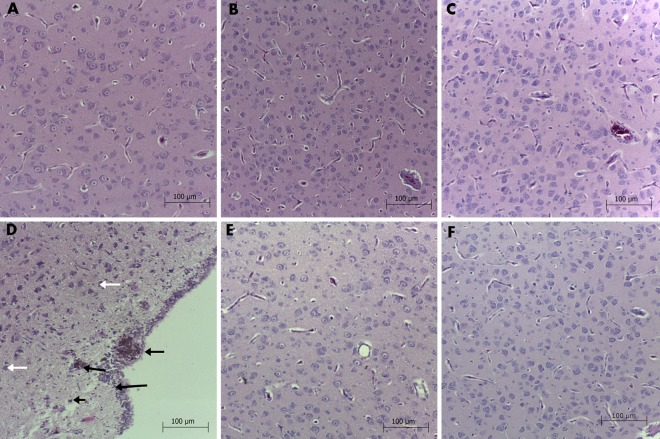
Fig 11 Brain histology of chicken embryo. Groups: Control (A), Placebo (B), Cur (C), DN (D), 3Cur:1DN (E), 1Cur:3DN (F). Silver-grey particles were observed in the DN group (black arrows) and single necrotic-like neurons (white arrows). Scale bar indicates 100 μm.
Fig 11 Brain histology of chicken embryo. Groups: Control (A), Placebo (B), Cur (C), DN (D), 3Cur:1DN (E), 1Cur:3DN (F). Silver-grey particles were observed in the DN group (black arrows) and single necrotic-like neurons (white arrows). Scale bar indicates 100 μm.CC BY · PubMed Central
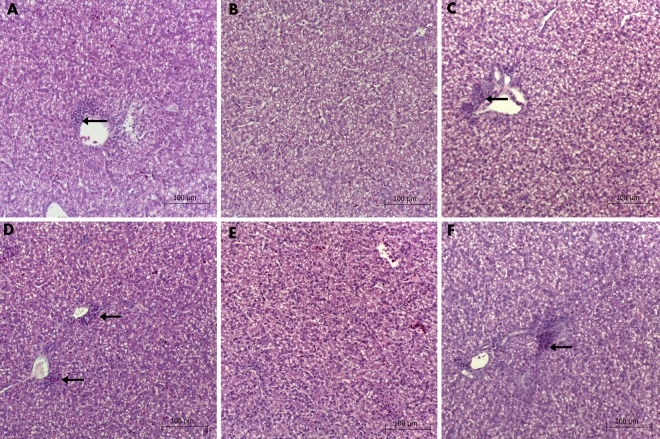
Fig 12 Liver histology of chicken embryos. Groups: Control (A), Placebo (B), Cur (C), DN (D), 3Cur:1DN (E), 1Cur:3DN (F). Heterophils and primary hematopoietic cells were present in the proximity of wider blood vesicles (black arrows). Scale bar indicates 100 μm.
Fig 12 Liver histology of chicken embryos. Groups: Control (A), Placebo (B), Cur (C), DN (D), 3Cur:1DN (E), 1Cur:3DN (F). Heterophils and primary hematopoietic cells were present in the proximity of wider blood vesicles (black arrows). Scale bar indicates 100 μm.CC BY · PubMed Central

Verification

Claims the paper makes

The claims and statistics of this paper haven’t been checked yet.

Run the check — free, no account needed. It reads the open-access text and checks the sources it cites.

A few free checks a day · papers already verified open instantly · results are public

Claims other papers make about this one

Each is checked against this paper’s own text: does it say what the citing paper says it does?

Self-check

Percentages, sums and reported differences re-computed from the paper’s own numbers.

The self-check needs the paper’s full text.

Citations

Cites

No references could be resolved yet.

Research works printed but not linked: 38

  1. JJ Johnson, 2007, Curcumin for chemoprevention of colon cancer, Cancer Lett, 255, 170, 10.1016/j.canlet.2007.03.005 · DOI
  2. A Shehzad, 2010, Curcumin in cancer chemoprevention: molecular targets, pharmacokinetics, bioavailability, and clinical trials, Arch Pharm (Weinheim), 343, 489, 10.1002/ardp.200900319 · DOI
  3. R a Sharma, 2005, Curcumin: the story so far, Eur J Cancer, 41, 1955, 10.1016/j.ejca.2005.05.009 · DOI
  4. S Shishodia, 2005, Curcumin: getting back to the roots, Ann N Y Acad Sci, 1056, 206, 10.1196/annals.1352.010 · DOI
  5. A Goel, 2008, Curcumin as “Curecumin”: from kitchen to clinic, Biochem Pharmacol, 75, 787, 10.1016/j.bcp.2007.08.016 · DOI
  6. J Zhang, 2014, Assessment of free radicals scavenging activity of seven natural pigments and protective effects in AAPH-challenged chicken erythrocytes, Food Chem, 145, 57, 10.1016/j.foodchem.2013.08.025 · DOI
  7. G Sa, 2008, Anti cancer effects of curcumin: cycle of life and death, Cell Div, 3, 14, 10.1186/1747-1028-3-14 · DOI
  8. LM Howells, 2007, Comparison of oxaliplatin- and curcumin-mediated antiproliferative effects in colorectal cell lines, Int J Cancer, 121, 175, 10.1002/ijc.22645 · DOI
  9. P Anand, 2007, Bioavailability of curcumin: problems and promises, Mol Pharm, 4, 807, 10.1021/mp700113r · DOI · Paper page
  10. MM Yallapu, 2012, Curcumin nanoformulations: a future nanomedicine for cancer, Drug Discov Today, 17, 71, 10.1016/j.drudis.2011.09.009 · DOI
  11. MM Yallapu, 2011, Interaction of curcumin nanoformulations with human plasma proteins and erythrocytes, Int J Nanomedicine, 6, 2779
  12. AP Puzyr, 2007, Nanodiamonds with novel properties: A biological study, Diam Relat Mater, 16, 2124, 10.1016/j.diamond.2007.07.025 · DOI
  13. AM Schrand, 2007, Differential biocompatibility of carbon nanotubes and nanodiamonds, Diam Relat Mater, 16, 2118, 10.1016/j.diamond.2007.07.020 · DOI
  14. N Kurantowicz, 2015, Biodistribution of a High Dose of Diamond, Graphite, and Graphene Oxide Nanoparticles After Multiple Intraperitoneal Injections in Rats, Nanoscale Res Lett, 10, 398, 10.1186/s11671-015-1107-9 · DOI
  15. B Strojny, 2015, Long Term Influence of Carbon Nanoparticles on Health and Liver Status in Rats, PLoS One, 10, e0144821, 10.1371/journal.pone.0144821 · DOI
  16. II Kulakova, 2004, Chemistry of Nanodiamonds, Phys Solid State, 46, 621, 10.1134/1.1711440 · DOI
  17. M Grodzik, 2013, Nano-Nutrition of Chicken Embryos. The Effect of in Ovo Administration of Diamond Nanoparticles and l-Glutamine on Molecular Responses in Chicken Embryo Pectoral Muscles, Int J Mol Sci, 14, 23033, 10.3390/ijms141123033 · DOI
  18. M Wierzbicki, 2013, Carbon nanoparticles downregulate expression of basic fibroblast growth factor in the heart during embryogenesis, Int J Nanomedicine, 8, 3427
  19. M Wierzbicki, 2013, Comparison of anti-angiogenic properties of pristine carbon nanoparticles, Nanoscale Res Lett, 8, 195, 10.1186/1556-276X-8-195 · DOI
  20. M Grodzik, 2011, Nanoparticles of carbon allotropes inhibit glioblastoma multiforme angiogenesis in ovo, Int J Nanomedicine, 6, 3041
  21. V Hamburger, 1951, A series of normal stages in the development of the chick embryo, J Morphol, 88, 10.1002/jmor.1050880104 · DOI
  22. H Fan, 2014, Curcumin induces apoptosis of HepG2 cells via inhibiting fatty acid synthase, Target Oncol, 9, 279, 10.1007/s11523-013-0286-5 · DOI
  23. C Syng-Ai, 2004, Effect of curcumin on normal and tumor cells: role of glutathione and bcl-2, Mol Cancer Ther, 3, 1101, 10.1158/1535-7163.1101.3.9 · DOI
  24. M Wang, 2011, Curcumin induced HepG2 cell apoptosis-associated mitochondrial membrane potential and intracellular free Ca2+ concentration, Eur J Pharmacol, 650, 41, 10.1016/j.ejphar.2010.09.049 · DOI
  25. KE Zakrzewska, 2015, Analysis of the Cytotoxicity of Carbon-Based Nanoparticles, Diamond and Graphite, in Human Glioblastoma and Hepatoma Cell Lines, PLoS One, 10, e0122579, 10.1371/journal.pone.0122579 · DOI
  26. DMS Lundvig, 2015, Curcumin induces differential expression of cytoprotective enzymes but similar apoptotic responses in fi broblasts and myo fi broblasts, Exp Cell Res, 330, 429, 10.1016/j.yexcr.2014.10.006 · DOI
  27. F Zhang, 2014, Peroxisome proliferator-activated receptor-γ interrupts angiogenic signal transduction by transrepression of platelet-derived growth factor-β receptor in hepatic stellate cells, J Cell Sci, 127, 305, 10.1242/jcs.128306 · DOI
  28. S Zheng, 2007, Disruption of transforming growth factor-beta signaling by curcumin induces gene expression of peroxisome proliferator-activated receptor-gamma in rat hepatic stellate cells, Am J Physiol Gastrointest Liver Physiol, 292, G113, 10.1152/ajpgi.00200.2006 · DOI
  29. M Zielinska, 2012, Effect of taurine and gold nanoparticles on the morphological and molecular characteristics of muscle development during chicken embryogenesis, Arch Anim Nutr, 66, 1, 10.1080/1745039X.2011.644918 · DOI
  30. M Prasek, 2013, Influence of nanoparticles of platinum on chicken embryo development and brain morphology, Nanoscale Res Lett, 8, 251, 10.1186/1556-276X-8-251 · DOI
  31. E Sawosz, 2014, Toxicity of pristine graphene in experiments in a chicken embryo model, Int J Nanomedicine, 3913
  32. M Ema, 2016, Developmental toxicity of engineered nanomaterials in rodents, Toxicol Appl Pharmacol, 299, 47, 10.1016/j.taap.2015.12.015 · DOI
  33. W Qi, 2014, Damaging effects of multi-walled carbon nanotubes on pregnant mice with different pregnancy times, Sci Rep, 4, 4352, 10.1038/srep04352 · DOI
  34. Y Yuan, 2009, Biodistribution and fate of nanodiamonds in vivo, Diam Relat Mater, 18, 95, 10.1016/j.diamond.2008.10.031 · DOI
  35. X Zhang, 2010, Biodistribution and toxicity of nanodiamonds in mice after intratracheal instillation, Toxicol Lett, 198, 237, 10.1016/j.toxlet.2010.07.001 · DOI
  36. S Ganiger, 2007, A two generation reproductive toxicity study with curcumin, turmeric yellow, in Wistar rats, Food Chem Toxicol, 45, 64, 10.1016/j.fct.2006.07.016 · DOI
  37. J Wu, 2007, Curcumin affects development of zebrafish embryo. …, Pharm Bull, 30, 1336, 10.1248/bpb.30.1336 · DOI
  38. Y Zhu, 2012, The biocompatibility of nanodiamonds and their application in drug delivery systems, Theranostics, 2, 302, 10.7150/thno.3627 · DOI

Cited by

Sorted by citations

Metadata

Authors
Strojny, B., Grodzik, M., Sawosz, E., Winnicka, A., Kurantowicz, N., Jaworski, S., Kutwin, M., Urbańska, K., Hotowy, A., Wierzbicki, M., & Chwalibog, A.
Venue
PLOS ONE
Published
2016-10-13
Volume
11
Issue
10
Pages
e0164637
ISSN
1932-6203
Cited by
33
References
0
Language
en
Funders
Narodowe Centrum Nauki (NN311540840)

About these checks

Registry, retraction, Cites and statistics results are computed, not judged, with one exception: a printed reference that no index lists is read once by a model before it counts as a citation error. Claims are extracted by a model and kept only when their quote appears verbatim in the text; each cited source is then checked, with a model’s help, for whether it says what the claim relies on. Those verdicts can be wrong — read the claim’s quote and the cited source before relying on one.

Statistics and arithmetic are recomputed, not judged.

Confidence bands are shown only for fields calibrated on our annotated test set. None is calibrated yet, so no band is shown.

What counts as a claim ›How we measure confidence ›How we check this ›

Are you an author, or do you see a problem with this page? Request a review