

The DOI matches its Crossref record; 53 of the 56 references it cites were found in a registry or an index; none of the 44 sources its claims cite is checked for support yet.
Causal relationship between obesity and serum testosterone status in men: A bi-directional mendelian randomization analysis
Open accessAbstract
CONTEXT: Obesity in men is associated with low serum testosterone and both are associated with several diseases and increased mortality. OBJECTIVES: Examine the direction and causality of the relationship between body mass index (BMI) and serum testosterone. DESIGN: Bi-directional Mendelian randomization (MR) analysis on prospective cohorts. SETTING: Five cohorts from Denmark, Germany and Sweden (Inter99, SHIP, SHIP Trend, GOOD and MrOS Sweden). PARTICIPANTS: 7446 Caucasian men, genotyped for 97 BMI-associated SNPs and three testosterone-associated SNPs. MAIN OUTCOME MEASURES: BMI and serum testosterone adjusted for age, smoking, time of blood sampling and site. RESULTS: 1 SD genetically instrumented increase in BMI was associated with a 0.25 SD decrease in serum testosterone (IV ratio: -0.25, 95% CI: -0.42--0.09, p = 2.8*10-3). For a body weight reduction altering the BMI from 30 to 25 kg/m2, the effect would equal a 13% increase in serum testosterone. No association was seen for genetically instrumented testosterone with BMI, a finding that was confirmed using large-scale data from the GIANT consortium (n = 104349). CONCLUSIONS: Our results suggest that there is a causal effect of BMI on serum testosterone in men. Population level interventions to reduce BMI are expected to increase serum testosterone in men.
Overview
AI snapshot
Written from the paper’s full text.
TL;DR
In a bi-directional Mendelian randomization analysis of 7,446 Caucasian men, genetically instrumented higher BMI causally lowered serum testosterone, while genetically instrumented testosterone did not affect BMI. The authors conclude that reducing BMI is expected to increase serum testosterone in men.
Key findings
- A 1 SD genetically instrumented increase in BMI was associated with a 0.25 SD decrease in serum testosterone (IV ratio: -0.25, 95% CI: -0.42 to -0.09, p = 2.8×10⁻³); the unweighted score gave -0.29 SD (95% CI: -0.48 to -0.10, p = 2.5×10⁻³).
- For a BMI reduction from 30 to 25 kg/m², the estimated effect was a 13% increase in serum testosterone using the weighted BMI score and 15% using the unweighted score; the corresponding observational estimate was 16%.
- No association was seen for genetically instrumented testosterone with BMI; this was confirmed using large-scale data from the GIANT consortium (n = 104,349).
- The observational association was also significant: 1 SD increase in ln-transformed BMI was associated with a 0.30 SD decrease in serum testosterone (95% CI: -0.35 to -0.24) in random-effects meta-analysis.
Methods
- Bi-directional Mendelian randomization analysis using five cohorts from Denmark, Germany, and Sweden (Inter99, SHIP, SHIP Trend, GOOD, and MrOS Sweden), including 7,446 Caucasian men with genotype and phenotype data.
- Genetic instruments were a weighted genetic risk score based on 97 BMI-associated SNPs and a weighted testosterone-decreasing score based on three testosterone-associated SNPs (rs6258, rs12150660, rs5934505); unweighted scores were also used.
- Main analysis used the IV ratio method with two-stage least squares regression to estimate causal effects of BMI on serum testosterone and vice versa, with adjustment for age, smoking, site, and time of blood sampling where applicable.
Limitations
- The paper states that participants were unrelated men of European ancestry, limiting generalizability to other ethnic groups.
- The paper states that the mechanism for the causal effect of BMI on serum testosterone cannot be determined and may involve the hypothalamus-pituitary-gonadal axis.
- The paper states that genetic markers do not examine effects from extremes of non-linear distributions, so a possible causative effect of severe testosterone deficiency on BMI cannot be discounted.
- The paper notes a small overlap (<2%) between its cohorts and the BMI GWAS used to weight SNPs, which could bias the weighted score, though similar results with unweighted and FTO-only scores made this unlikely.
- The paper states that the close connection between testosterone and SHBG makes it difficult to discriminate between a direct effect on serum testosterone and an effect mediated via SHBG.
- Evident from the text: the MR approach relies on assumptions of no pleiotropy and no confounding, which the authors tested where possible but cannot fully exclude.
Model-written summary. Check it against the paper before relying on it.
Integrity signals
Registry
Cites
Statistics
Figures
Verification
Claims the paper makes
41 Own result · 23 Not checked yet · 16 Own method · 16 Own interpretation
A result the paper reports from its own data — it cites no other source for it, so there is none to check. The quote shows it is in the paper.
In the paper
“we found evidence of heterogeneity (I-squared = 82%, p = 0.0005) among cohorts”
§ Causal relationship between obesity and serum testosterone status in men: A bi-directional mendelian randomization analysis > Results > Phenotypic association between BMI and serum T: Observational estimates
plain- Asserted: passes — The authors put it forward as true.
- Checkable: passes — It can be checked against evidence.
- Load-bearing: unclear — It is unclear whether the paper’s conclusions depend on it.
- Based: passes — The paper gives a reason why it holds.
A result the paper reports from its own data — it cites no other source for it, so there is none to check. The quote shows it is in the paper.
In the paper
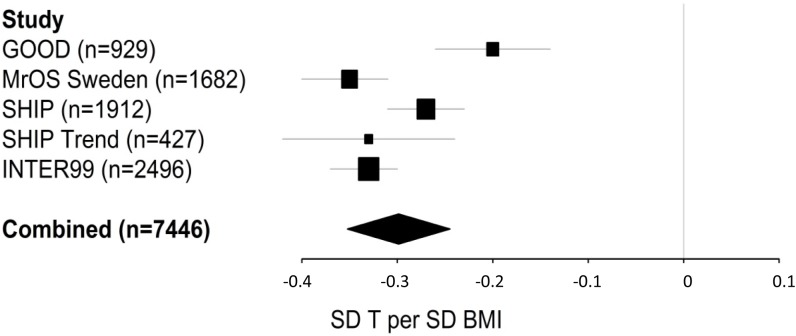
“but slightly more pronounced in the MrOS cohort including the oldest men (mean age 75.4 years; -0.35 SD T per SD ln BMI) compared to the GOOD cohort including the youngest men (mean age 18.9 years; -0.20 SD T per SD ln BMI; Fig 1).”
§ Causal relationship between obesity and serum testosterone status in men: A bi-directional mendelian randomization analysis > Results > Phenotypic association between BMI and serum T: Observational estimates
plaincorrelational- Asserted: passes — The authors put it forward as true.
- Checkable: passes — It can be checked against evidence.
- Load-bearing: unclear — It is unclear whether the paper’s conclusions depend on it.
- Based: passes — The paper gives a reason why it holds.
A result the paper reports from its own data — it cites no other source for it, so there is none to check. The quote shows it is in the paper.
In the paper
“revealing that 1 SD increase in ln-transformed BMI was associated with 0.30 SD decrease in serum T (95% CI: -0.33–-0.28).”
§ Causal relationship between obesity and serum testosterone status in men: A bi-directional mendelian randomization analysis > Results > Phenotypic association between BMI and serum T: Observational estimates
plaincorrelational- Asserted: passes — The authors put it forward as true.
- Checkable: passes — It can be checked against evidence.
- Load-bearing: unclear — It is unclear whether the paper’s conclusions depend on it.
- Based: passes — The paper gives a reason why it holds.
A result the paper reports from its own data — it cites no other source for it, so there is none to check. The quote shows it is in the paper.
In the paper
“demonstrating that a 1 SD increase in ln-transformed BMI was associated with a 0.30 SD decrease in serum T (95% CI -0.35–-0.24; Fig 1).”
§ Causal relationship between obesity and serum testosterone status in men: A bi-directional mendelian randomization analysis > Results > Phenotypic association between BMI and serum T: Observational estimates
boostedcorrelational- Asserted: passes — The authors put it forward as true.
- Checkable: passes — It can be checked against evidence.
- Load-bearing: unclear — It is unclear whether the paper’s conclusions depend on it.
- Based: passes — The paper gives a reason why it holds.
A result the paper reports from its own data — it cites no other source for it, so there is none to check. The quote shows it is in the paper.
In the paper
“the different GRSs evaluated in the present study (wGRSBMI, uwGRSBMI, wGRST and uwGRST) were not associated with these two potential confounders (p>0.05; S1 Fig).”
§ Causal relationship between obesity and serum testosterone status in men: A bi-directional mendelian randomization analysis > Results > Validation of the instruments
plain- Asserted: passes — The authors put it forward as true.
- Checkable: passes — It can be checked against evidence.
- Load-bearing: passes — The paper’s conclusions depend on it.
- Based: passes — The paper gives a reason why it holds.
A result the paper reports from its own data — it cites no other source for it, so there is none to check. The quote shows it is in the paper.
In the paper
“The observational association between BMI and serum T was significant in all cohorts after adjustment for age, smoking, site and blood sampling time”
§ Causal relationship between obesity and serum testosterone status in men: A bi-directional mendelian randomization analysis > Results > Phenotypic association between BMI and serum T: Observational estimates
plaincorrelational- Asserted: passes — The authors put it forward as true.
- Checkable: passes — It can be checked against evidence.
- Load-bearing: unclear — It is unclear whether the paper’s conclusions depend on it.
- Based: passes — The paper gives a reason why it holds.
A result the paper reports from its own data — it cites no other source for it, so there is none to check. The quote shows it is in the paper.
In the paper
“There was no evidence of heterogeneity in these analyses.”
§ Causal relationship between obesity and serum testosterone status in men: A bi-directional mendelian randomization analysis > Results > Validation of the instruments
plain- Asserted: passes — The authors put it forward as true.
- Checkable: passes — It can be checked against evidence.
- Load-bearing: unclear — It is unclear whether the paper’s conclusions depend on it.
- Based: passes — The paper gives a reason why it holds.
A result the paper reports from its own data — it cites no other source for it, so there is none to check. The quote shows it is in the paper.
In the paper
“However, none of the SNPs were still significant after adjustment for BMI.”
§ Causal relationship between obesity and serum testosterone status in men: A bi-directional mendelian randomization analysis > Results > Evaluation of causal association using MR approach
plain- Asserted: passes — The authors put it forward as true.
- Checkable: passes — It can be checked against evidence.
- Load-bearing: passes — The paper’s conclusions depend on it.
- Based: passes — The paper gives a reason why it holds.
A result the paper reports from its own data — it cites no other source for it, so there is none to check. The quote shows it is in the paper.
In the paper
“There was no significant difference between β-coefficients from observational and IV analysis (wGRSBMI: p value 0.44, uwGRSBMI: p value 0.82).”
§ Causal relationship between obesity and serum testosterone status in men: A bi-directional mendelian randomization analysis > Results > Evaluation of causal association using MR approach
plain- Asserted: passes — The authors put it forward as true.
- Checkable: passes — It can be checked against evidence.
- Load-bearing: passes — The paper’s conclusions depend on it.
- Based: passes — The paper gives a reason why it holds.
A result the paper reports from its own data — it cites no other source for it, so there is none to check. The quote shows it is in the paper.
In the paper
“wGRST was robustly associated with serum SHBG (combined cohort: p = 2.7*10−49, S3 Fig).”
§ Causal relationship between obesity and serum testosterone status in men: A bi-directional mendelian randomization analysis > Results > Evaluation of causal association using MR approach
boostedcorrelational- Asserted: passes — The authors put it forward as true.
- Checkable: passes — It can be checked against evidence.
- Load-bearing: passes — The paper’s conclusions depend on it.
- Based: passes — The paper gives a reason why it holds.
A result the paper reports from its own data — it cites no other source for it, so there is none to check. The quote shows it is in the paper.
In the paper
“Furthermore, the IV ratio analyses provided no evidence for a causal effect of serum T on BMI (Table 2, S3 Table).”
§ Causal relationship between obesity and serum testosterone status in men: A bi-directional mendelian randomization analysis > Results > Evaluation of causal association using MR approach
plain- Asserted: passes — The authors put it forward as true.
- Checkable: passes — It can be checked against evidence.
- Load-bearing: passes — The paper’s conclusions depend on it.
- Based: passes — The paper gives a reason why it holds.
A result the paper reports from its own data — it cites no other source for it, so there is none to check. The quote shows it is in the paper.
In the paper
“Interestingly, the association between wGRSBMI and serum T remained significant (p = 0.02) after adjustment for serum SHBG in the pooled combined cohort.”
§ Causal relationship between obesity and serum testosterone status in men: A bi-directional mendelian randomization analysis > Results > Evaluation of causal association using MR approach
plaincorrelational- Asserted: passes — The authors put it forward as true.
- Checkable: passes — It can be checked against evidence.
- Load-bearing: passes — The paper’s conclusions depend on it.
- Based: passes — The paper gives a reason why it holds.
A result the paper reports from its own data — it cites no other source for it, so there is none to check. The quote shows it is in the paper.
In the paper
“After adjustment for BMI, none of these associations were still significant.”
§ Causal relationship between obesity and serum testosterone status in men: A bi-directional mendelian randomization analysis > Results > Evaluation of causal association using MR approach
plain- Asserted: passes — The authors put it forward as true.
- Checkable: passes — It can be checked against evidence.
- Load-bearing: passes — The paper’s conclusions depend on it.
- Based: passes — The paper gives a reason why it holds.
A result the paper reports from its own data — it cites no other source for it, so there is none to check. The quote shows it is in the paper.
In the paper
“No evidence of non-linearity was found for wGRST or uwGRST.”
§ Causal relationship between obesity and serum testosterone status in men: A bi-directional mendelian randomization analysis > Results > Validation of the instruments
plain- Asserted: passes — The authors put it forward as true.
- Checkable: passes — It can be checked against evidence.
- Load-bearing: unclear — It is unclear whether the paper’s conclusions depend on it.
- Based: passes — The paper gives a reason why it holds.
A result the paper reports from its own data — it cites no other source for it, so there is none to check. The quote shows it is in the paper.
In the paper
“All three SNPs included in the wGRST were individually associated with serum T (p<0.05/3; S4 Table).”
§ Causal relationship between obesity and serum testosterone status in men: A bi-directional mendelian randomization analysis > Results > Validation of the instruments
plaincorrelational- Asserted: passes — The authors put it forward as true.
- Checkable: passes — It can be checked against evidence.
- Load-bearing: passes — The paper’s conclusions depend on it.
- Based: passes — The paper gives a reason why it holds.
None of the sources cited for this claim have been checked yet.
In the paper
“For the two autosomal SNPs it was possible to use the GIANT consortium, including up to 104349 men, to evaluate the causal effect of serum T on BMI in a larger setting. However, no significant evidence was found supporting that any of these T SNPs were associated with BMI individually, or when combined as a genetic risk score (S6 Table).”
§ Causal relationship between obesity and serum testosterone status in men: A bi-directional mendelian randomization analysis > Results > Evaluation of causal association using MR approach
What the sources say
- Not checked yetcites [17] AE Locke, 2015, Genetic studies of body mass index yield new insights for obesity biology, Nature source
- Not checked yetcites [28] KS Vimaleswaran, 2013, Causal relationship between obesity and vitamin D status: bi-directional Mendelian randomization analysis of multiple cohorts, PLoS medicine source
plainn = 104,349- Asserted: passes — The authors put it forward as true.
- Checkable: passes — It can be checked against evidence.
- Load-bearing: passes — The paper’s conclusions depend on it.
- Based: passes — The paper gives a reason why it holds.
A result the paper reports from its own data — it cites no other source for it, so there is none to check. The quote shows it is in the paper.
In the paper
“IV analyses used to establish the direction and causality of the BMI-T association, revealed that 1 SD increase in ln-transformed BMI lead to a 0.25 (using wGRSBMI, p = 2.8*10−3) to 0.29 (using uwGRSBMI, p = 2.5*10−3) SD decrease in serum T (Table 2, S1 Table).”
§ Causal relationship between obesity and serum testosterone status in men: A bi-directional mendelian randomization analysis > Results > Evaluation of causal association using MR approach
plaindirect- Asserted: passes — The authors put it forward as true.
- Checkable: passes — It can be checked against evidence.
- Load-bearing: passes — The paper’s conclusions depend on it.
- Based: passes — The paper gives a reason why it holds.
A result the paper reports from its own data — it cites no other source for it, so there is none to check. The quote shows it is in the paper.
In the paper
“Each SD genetically instrumented increase in BMI was associated with a 0.25 SD decrease in serum T.”
§ Causal relationship between obesity and serum testosterone status in men: A bi-directional mendelian randomization analysis > Discussion
plaincorrelational- Asserted: passes — The authors put it forward as true.
- Checkable: passes — It can be checked against evidence.
- Load-bearing: passes — The paper’s conclusions depend on it.
- Based: passes — The paper gives a reason why it holds.
- The authors state this as an assumption: The genotypes are randomized.
- The authors state this as an assumption: The genetic variants considered as instruments affect the outcome only by modifying the biomarker—that is, these variants have no pleiotropic effects on the outcome.
- The authors state this as an assumption: The genotype is independent of confounders.
A result the paper reports from its own data — it cites no other source for it, so there is none to check. The quote shows it is in the paper.
In the paper
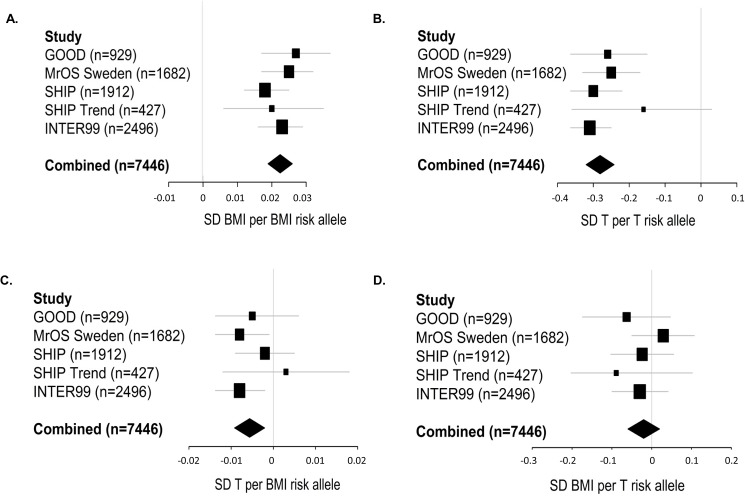
“Both wGRSBMI (p = 2.0*10−3) and uwGRSBMI (p = 1.7*10−3) were significantly and inversely associated with serum T in the meta-analyzed combined cohort (Fig 2C; S1 Table).”
§ Causal relationship between obesity and serum testosterone status in men: A bi-directional mendelian randomization analysis > Results > Evaluation of causal association using MR approach
plaincorrelational- Asserted: passes — The authors put it forward as true.
- Checkable: passes — It can be checked against evidence.
- Load-bearing: passes — The paper’s conclusions depend on it.
- Based: passes — The paper gives a reason why it holds.
A result the paper reports from its own data — it cites no other source for it, so there is none to check. The quote shows it is in the paper.
In the paper
“The wGRSBMI and uwGRSBMI associations with BMI did not vary by age, smoking or serum T (p > 0.05 for all interaction terms in pooled analyses).”
§ Causal relationship between obesity and serum testosterone status in men: A bi-directional mendelian randomization analysis > Results > Validation of the instruments
plain- Asserted: passes — The authors put it forward as true.
- Checkable: passes — It can be checked against evidence.
- Load-bearing: passes — The paper’s conclusions depend on it.
- Based: passes — The paper gives a reason why it holds.
A result the paper reports from its own data — it cites no other source for it, so there is none to check. The quote shows it is in the paper.
In the paper
“No evidence of non-linearity was found for wGRSBMI or uwGRSBMI.”
§ Causal relationship between obesity and serum testosterone status in men: A bi-directional mendelian randomization analysis > Results > Validation of the instruments
plain- Asserted: passes — The authors put it forward as true.
- Checkable: passes — It can be checked against evidence.
- Load-bearing: unclear — It is unclear whether the paper’s conclusions depend on it.
- Based: passes — The paper gives a reason why it holds.
A result the paper reports from its own data — it cites no other source for it, so there is none to check. The quote shows it is in the paper.
In the paper
“wGRSBMI was inversely associated with serum SHBG in the pooled combined cohort (S3 Fig).”
§ Causal relationship between obesity and serum testosterone status in men: A bi-directional mendelian randomization analysis > Results > Evaluation of causal association using MR approach
plaincorrelational- Asserted: passes — The authors put it forward as true.
- Checkable: passes — It can be checked against evidence.
- Load-bearing: unclear — It is unclear whether the paper’s conclusions depend on it.
- Based: passes — The paper gives a reason why it holds.
A result the paper reports from its own data — it cites no other source for it, so there is none to check. The quote shows it is in the paper.
In the paper
“There was no evidence of heterogeneity in these analyses (Fig 2B).”
§ Causal relationship between obesity and serum testosterone status in men: A bi-directional mendelian randomization analysis > Results > Validation of the instruments
plain- Asserted: passes — The authors put it forward as true.
- Checkable: passes — It can be checked against evidence.
- Load-bearing: unclear — It is unclear whether the paper’s conclusions depend on it.
- Based: passes — The paper gives a reason why it holds.
A result the paper reports from its own data — it cites no other source for it, so there is none to check. The quote shows it is in the paper.
In the paper
“However, after adjustment for serum T wGRSBMI was not significantly associated with SHBG (combined cohort: p = 0.59).”
§ Causal relationship between obesity and serum testosterone status in men: A bi-directional mendelian randomization analysis > Results > Evaluation of causal association using MR approach
plain- Asserted: passes — The authors put it forward as true.
- Checkable: passes — It can be checked against evidence.
- Load-bearing: passes — The paper’s conclusions depend on it.
- Based: passes — The paper gives a reason why it holds.
A result the paper reports from its own data — it cites no other source for it, so there is none to check. The quote shows it is in the paper.
In the paper
“Our analyses provided no evidence for a causal role of serum T on BMI.”
§ Causal relationship between obesity and serum testosterone status in men: A bi-directional mendelian randomization analysis > Discussion
plain- Asserted: passes — The authors put it forward as true.
- Checkable: passes — It can be checked against evidence.
- Load-bearing: passes — The paper’s conclusions depend on it.
- Based: passes — The paper gives a reason why it holds.
- The authors state this as an assumption: The genotypes are randomized.
- The authors state this as an assumption: The genetic variants considered as instruments affect the outcome only by modifying the biomarker—that is, these variants have no pleiotropic effects on the outcome.
- The authors state this as an assumption: The genotype is independent of confounders.
A result the paper reports from its own data — it cites no other source for it, so there is none to check. The quote shows it is in the paper.
In the paper
“However, in the opposite analysis where serum T was the outcome and SHBG the covariate, wGRSBMI was significantly associated with serum T, supporting a SHBG-independent effect of BMI on serum T.”
§ Causal relationship between obesity and serum testosterone status in men: A bi-directional mendelian randomization analysis > Discussion
plaincorrelational- Asserted: passes — The authors put it forward as true.
- Checkable: passes — It can be checked against evidence.
- Load-bearing: passes — The paper’s conclusions depend on it.
- Based: passes — The paper gives a reason why it holds.
A result the paper reports from its own data — it cites no other source for it, so there is none to check. The quote shows it is in the paper.
In the paper
“In the present study, we found evidence of a causal effect of BMI on serum T, but the BMI-based genetic risk score was also associated with serum SHBG.”
§ Causal relationship between obesity and serum testosterone status in men: A bi-directional mendelian randomization analysis > Discussion
plaincorrelational- Asserted: passes — The authors put it forward as true.
- Checkable: passes — It can be checked against evidence.
- Load-bearing: passes — The paper’s conclusions depend on it.
- Based: passes — The paper gives a reason why it holds.
A result the paper reports from its own data — it cites no other source for it, so there is none to check. The quote shows it is in the paper.
In the paper
“However, the use of the GIANT consortium to test the association between T-related autosomal SNPs and BMI in a much larger sample including 104349 men also failed to identify a causal role of T on BMI.”
§ Causal relationship between obesity and serum testosterone status in men: A bi-directional mendelian randomization analysis > Discussion
plainn = 104,349- Asserted: passes — The authors put it forward as true.
- Checkable: passes — It can be checked against evidence.
- Load-bearing: passes — The paper’s conclusions depend on it.
- Based: passes — The paper gives a reason why it holds.
- The authors state this as an assumption: The genotypes are randomized.
- The authors state this as an assumption: The genetic variants considered as instruments affect the outcome only by modifying the biomarker—that is, these variants have no pleiotropic effects on the outcome.
- The authors state this as an assumption: The genotype is independent of confounders.
A result the paper reports from its own data — it cites no other source for it, so there is none to check. The quote shows it is in the paper.
In the paper
“When serum T was added as a covariate to the analysis, the association between the BMI-based genetic risk scores and SHBG was no longer significant.”
§ Causal relationship between obesity and serum testosterone status in men: A bi-directional mendelian randomization analysis > Discussion
plain- Asserted: passes — The authors put it forward as true.
- Checkable: passes — It can be checked against evidence.
- Load-bearing: passes — The paper’s conclusions depend on it.
- Based: passes — The paper gives a reason why it holds.
A result the paper reports from its own data — it cites no other source for it, so there is none to check. The quote shows it is in the paper.
In the paper
“In fact, in the cohorts included in this study SHBG explained about 26% of the total variance in serum T.”
§ Causal relationship between obesity and serum testosterone status in men: A bi-directional mendelian randomization analysis > Discussion
plaincorrelational- Asserted: passes — The authors put it forward as true.
- Checkable: passes — It can be checked against evidence.
- Load-bearing: passes — The paper’s conclusions depend on it.
- Based: passes — The paper gives a reason why it holds.
In the paper
“Observational studies demonstrate that obesity is associated with low serum testosterone (T) [1]”
§ Causal relationship between obesity and serum testosterone status in men: A bi-directional mendelian randomization analysis > Introduction
What the sources say
- Not checked yetcites [1] FC Wu, 2008, Hypothalamic-pituitary-testicular axis disruptions in older men are differentially linked to age and modifiable risk factors: the European Male Aging Study, The Journal of clinical endocrinology and metabolism source
boostedcorrelational- Asserted: passes — The authors put it forward as true.
- Checkable: passes — It can be checked against evidence.
- Load-bearing: passes — The paper’s conclusions depend on it.
- Based: passes — The paper gives a reason why it holds.
A conclusion the paper draws from its own results — it cites no other source for it, so there is none to check. The quote shows it is in the paper.
In the paper
“This illustrates that these GRSs can be used as largely un-confounded instruments to assess the causality of the inverse association between BMI and serum T.”
§ Causal relationship between obesity and serum testosterone status in men: A bi-directional mendelian randomization analysis > Results > Validation of the instruments
plaindirect- Asserted: passes — The authors put it forward as true.
- Checkable: passes — It can be checked against evidence.
- Load-bearing: passes — The paper’s conclusions depend on it.
- Based: passes — The paper gives a reason why it holds.
- The authors state this as an assumption: Genetic variants are randomly distributed with respect to confounding factors because they are fixed at conception.
- The authors state this as an assumption: Covariates are randomly distributed with respect to genotype.
What the paper did — it cites no source for this, so there is none to check. The quote shows it is in the paper.
In the paper
“These two independent genetic instruments had similar point estimates of the causal effect of BMI on serum T (S5 Table).”
§ Causal relationship between obesity and serum testosterone status in men: A bi-directional mendelian randomization analysis > Results > Evaluation of causal association using MR approach
plain- Asserted: passes — The authors put it forward as true.
- Checkable: passes — It can be checked against evidence.
- Load-bearing: passes — The paper’s conclusions depend on it.
- Based: passes — The paper gives a reason why it holds.
In the paper
“This evidence of a causative effect of BMI on serum T is supported by a recent meta-analysis of the impact of body weight reduction on serum T, revealing that body weight reductions as a result of both low-calorie diet and bariatric surgery are associated with significantly increased serum T [37].”
§ Causal relationship between obesity and serum testosterone status in men: A bi-directional mendelian randomization analysis > Discussion
What the sources say
- Not checked yetcites [37] G Corona, 2013, Body weight loss reverts obesity-associated hypogonadotropic hypogonadism: a systematic review and meta-analysis, European journal of endocrinology / European Federation of Endocrine Societies source
plaincorrelational- Asserted: passes — The authors put it forward as true.
- Checkable: passes — It can be checked against evidence.
- Load-bearing: passes — The paper’s conclusions depend on it.
- Based: passes — The paper gives a reason why it holds.
A conclusion the paper draws from its own results — it cites no other source for it, so there is none to check. The quote shows it is in the paper.
In the paper
“Our study highlights the importance of considering obesity as a risk factor for low serum T in men with implications on the possible targeting of relevant health promotion strategies.”
§ Causal relationship between obesity and serum testosterone status in men: A bi-directional mendelian randomization analysis > Discussion
plaindirect- Asserted: passes — The authors put it forward as true.
- Checkable: passes — It can be checked against evidence.
- Load-bearing: passes — The paper’s conclusions depend on it.
- Based: passes — The paper gives a reason why it holds.
- The authors state this as an assumption: Genetic variants are randomly distributed with respect to confounding factors because they are fixed at conception.
- The authors state this as an assumption: A phenotypic trait cannot cause genetic variation, so Mendelian randomization analyses are free of reverse causation.
- The authors state this as an assumption: Covariates are randomly distributed with respect to genotype.
A conclusion the paper draws from its own results — it cites no other source for it, so there is none to check. The quote shows it is in the paper.
In the paper
“For a body weight reduction altering the BMI from 30 to 25 kg/m2, the effect would equal a 13–15% increase in serum T.”
§ Causal relationship between obesity and serum testosterone status in men: A bi-directional mendelian randomization analysis > Discussion
hedgeddirect- Asserted: passes — The authors put it forward as true.
- Checkable: passes — It can be checked against evidence.
- Load-bearing: passes — The paper’s conclusions depend on it.
- Based: passes — The paper gives a reason why it holds.
- The authors state this as an assumption: The genotypes are randomized.
- The authors state this as an assumption: The genetic variants considered as instruments affect the outcome only by modifying the biomarker—that is, these variants have no pleiotropic effects on the outcome.
- The authors state this as an assumption: The genotype is independent of confounders.
What the paper did — it cites no source for this, so there is none to check. The quote shows it is in the paper.
In the paper
“In theory, we had approximately similar power to detect an association between BMI and T using the wGRSBMI (95%) compared with an equal sized effect in the other direction using the wGRST (98%, n = 7446 subjects; S2 Fig).”
§ Causal relationship between obesity and serum testosterone status in men: A bi-directional mendelian randomization analysis > Results > Power analysis
hedgedn = 7,446- Asserted: passes — The authors put it forward as true.
- Checkable: passes — It can be checked against evidence.
- Load-bearing: unclear — It is unclear whether the paper’s conclusions depend on it.
- Based: passes — The paper gives a reason why it holds.
A conclusion the paper draws from its own results — it cites no other source for it, so there is none to check. The quote shows it is in the paper.
In the paper
“The magnitude of this effect is similar to the observational association.”
§ Causal relationship between obesity and serum testosterone status in men: A bi-directional mendelian randomization analysis > Discussion
plaindirect- Asserted: passes — The authors put it forward as true.
- Checkable: passes — It can be checked against evidence.
- Load-bearing: unclear — It is unclear whether the paper’s conclusions depend on it.
- Based: passes — The paper gives a reason why it holds.
A conclusion the paper draws from its own results — it cites no other source for it, so there is none to check. The quote shows it is in the paper.
In the paper
“low serum T could contribute to the adverse health effects associated with obesity in men.”
§ Causal relationship between obesity and serum testosterone status in men: A bi-directional mendelian randomization analysis > Discussion
hedgedconditional- Asserted: passes — The authors put it forward as true.
- Checkable: passes — It can be checked against evidence.
- Load-bearing: passes — The paper’s conclusions depend on it.
- Based: passes — The paper gives a reason why it holds.
- The authors state this as an assumption: Genetic variants are randomly distributed with respect to confounding factors because they are fixed at conception.
- The authors state this as an assumption: A phenotypic trait cannot cause genetic variation, so Mendelian randomization analyses are free of reverse causation.
- The authors state this as an assumption: Covariates are randomly distributed with respect to genotype.
A conclusion the paper draws from its own results — it cites no other source for it, so there is none to check. The quote shows it is in the paper.
In the paper
“Population level interventions to reduce BMI are expected to increase serum testosterone in men.”
- Also stated in: § Discussion · hedged
“Population level interventions to reduce BMI are expected to increase serum T in men.”
§ Causal relationship between obesity and serum testosterone status in men: A bi-directional mendelian randomization analysis > Abstract > Conclusions
hedgeddirect- Asserted: passes — The authors put it forward as true.
- Checkable: passes — It can be checked against evidence.
- Load-bearing: passes — The paper’s conclusions depend on it.
- Based: passes — The paper gives a reason why it holds.
- The authors state this as an assumption: Genetic variants are randomly distributed with respect to confounding factors because they are fixed at conception.
- The authors state this as an assumption: A phenotypic trait cannot cause genetic variation, so Mendelian randomization analyses are free of reverse causation.
- The authors state this as an assumption: Covariates are randomly distributed with respect to genotype.
- Also stated in: § Discussion · hedged
A conclusion the paper draws from its own results — it cites no other source for it, so there is none to check. The quote shows it is in the paper.
In the paper
“No association was seen for genetically instrumented testosterone with BMI, a finding that was confirmed using large-scale data from the GIANT consortium (n = 104349).”
- Also stated in: § Discussion · plain
“Conversely, our analyses provided no evidence for a causal role of serum T on BMI.”
§ Causal relationship between obesity and serum testosterone status in men: A bi-directional mendelian randomization analysis > Abstract > Results
plainn = 104,349- Asserted: passes — The authors put it forward as true.
- Checkable: passes — It can be checked against evidence.
- Load-bearing: passes — The paper’s conclusions depend on it.
- Based: passes — The paper gives a reason why it holds.
- The authors state this as an assumption: Genetic variants are randomly distributed with respect to confounding factors because they are fixed at conception.
- The authors state this as an assumption: A phenotypic trait cannot cause genetic variation, so Mendelian randomization analyses are free of reverse causation.
- The authors state this as an assumption: Covariates are randomly distributed with respect to genotype.
- Also stated in: § Discussion · plain
What the paper did — it cites no source for this, so there is none to check. The quote shows it is in the paper.
In the paper
“The present study was adequately powered to detect a causal association between BMI and T if the strength of this association was equal to the observed association between serum BMI and T.”
§ Causal relationship between obesity and serum testosterone status in men: A bi-directional mendelian randomization analysis > Results > Power analysis
plaindirectn = 7,446- Asserted: passes — The authors put it forward as true.
- Checkable: passes — It can be checked against evidence.
- Load-bearing: unclear — It is unclear whether the paper’s conclusions depend on it.
- Based: passes — The paper gives a reason why it holds.
A conclusion the paper draws from its own results — it cites no other source for it, so there is none to check. The quote shows it is in the paper.
In the paper
“The main finding in the present study is our results supporting a causal effect of BMI on serum T.”
- Also stated in: § Discussion · hedged
“In conclusion, our results suggest that there is a causal effect of BMI on serum T in men.”
§ Causal relationship between obesity and serum testosterone status in men: A bi-directional mendelian randomization analysis > Discussion
plaindirect- Asserted: passes — The authors put it forward as true.
- Checkable: passes — It can be checked against evidence.
- Load-bearing: passes — The paper’s conclusions depend on it.
- Based: passes — The paper gives a reason why it holds.
- The authors state this as an assumption: The genotypes are randomized.
- The authors state this as an assumption: The genetic variants considered as instruments affect the outcome only by modifying the biomarker—that is, these variants have no pleiotropic effects on the outcome.
- The authors state this as an assumption: The genotype is independent of confounders.
- Also stated in: § Discussion · hedged
In the paper
“Notably, this meta-analysis demonstrated that the degree of body weight loss is a robust determinant of the increase in serum T.”
§ Causal relationship between obesity and serum testosterone status in men: A bi-directional mendelian randomization analysis > Discussion
What the sources say
- Not checked yetcites [37] G Corona, 2013, Body weight loss reverts obesity-associated hypogonadotropic hypogonadism: a systematic review and meta-analysis, European journal of endocrinology / European Federation of Endocrine Societies source
boosteddirect- Asserted: passes — The authors put it forward as true.
- Checkable: passes — It can be checked against evidence.
- Load-bearing: passes — The paper’s conclusions depend on it.
- Based: passes — The paper gives a reason why it holds.
A conclusion the paper draws from its own results — it cites no other source for it, so there is none to check. The quote shows it is in the paper.
In the paper
“Our results suggest that there is a causal effect of BMI on serum testosterone in men.”
- Also stated in: § Discussion · plain
“Herein, we presented evidence that higher BMI leads to lower serum T.”
§ Causal relationship between obesity and serum testosterone status in men: A bi-directional mendelian randomization analysis > Abstract > Conclusions
plaindirect- Asserted: passes — The authors put it forward as true.
- Checkable: passes — It can be checked against evidence.
- Load-bearing: passes — The paper’s conclusions depend on it.
- Based: passes — The paper gives a reason why it holds.
- The authors state this as an assumption: Genetic variants are randomly distributed with respect to confounding factors because they are fixed at conception.
- The authors state this as an assumption: A phenotypic trait cannot cause genetic variation, so Mendelian randomization analyses are free of reverse causation.
- The authors state this as an assumption: Covariates are randomly distributed with respect to genotype.
- Also stated in: § Discussion · plain
A conclusion the paper draws from its own results — it cites no other source for it, so there is none to check. The quote shows it is in the paper.
In the paper
“These results suggest that although increases in T status are not likely to help with weight regulation in the general male population”
§ Causal relationship between obesity and serum testosterone status in men: A bi-directional mendelian randomization analysis > Discussion
hedged- Asserted: passes — The authors put it forward as true.
- Checkable: passes — It can be checked against evidence.
- Load-bearing: passes — The paper’s conclusions depend on it.
- Based: passes — The paper gives a reason why it holds.
- The authors state this as an assumption: Genetic variants are randomly distributed with respect to confounding factors because they are fixed at conception.
- The authors state this as an assumption: A phenotypic trait cannot cause genetic variation, so Mendelian randomization analyses are free of reverse causation.
- The authors state this as an assumption: Covariates are randomly distributed with respect to genotype.
A conclusion the paper draws from its own results — it cites no other source for it, so there is none to check. The quote shows it is in the paper.
In the paper
“However, in the opposite analysis where serum T was the outcome and SHBG the covariate, wGRSBMI was significantly associated with serum T, supporting a SHBG-independent effect of BMI on serum T.”
§ Causal relationship between obesity and serum testosterone status in men: A bi-directional mendelian randomization analysis > Discussion
hedgeddirect- Asserted: passes — The authors put it forward as true.
- Checkable: passes — It can be checked against evidence.
- Load-bearing: passes — The paper’s conclusions depend on it.
- Based: passes — The paper gives a reason why it holds.
None of the sources cited for this claim have been checked yet.
In the paper
“Thus high BMI seems to repress serum T mainly via central inhibitory effects on gonadotropin secretion [38, 41].”
§ Causal relationship between obesity and serum testosterone status in men: A bi-directional mendelian randomization analysis > Discussion
What the sources say
- Not checked yetcites [38] P Dandona, 2011, Update: Hypogonadotropic hypogonadism in type 2 diabetes and obesity, The Journal of clinical endocrinology and metabolism source
- Not checked yetcites [41] F Saad, 2011, Onset of effects of testosterone treatment and time span until maximum effects are achieved, European journal of endocrinology / European Federation of Endocrine Societies source
hedgedconditional- Asserted: passes — The authors put it forward as true.
- Checkable: passes — It can be checked against evidence.
- Load-bearing: unclear — It is unclear whether the paper’s conclusions depend on it.
- Based: passes — The paper gives a reason why it holds.
A conclusion the paper draws from its own results — it cites no other source for it, so there is none to check. The quote shows it is in the paper.
In the paper
“This close connection between serum T and SHBG makes it difficult to discriminate between an effect directly on serum T and an effect mediated via SHBG.”
§ Causal relationship between obesity and serum testosterone status in men: A bi-directional mendelian randomization analysis > Discussion
plaincorrelational- Asserted: passes — The authors put it forward as true.
- Checkable: passes — It can be checked against evidence.
- Load-bearing: passes — The paper’s conclusions depend on it.
- Based: passes — The paper gives a reason why it holds.
A conclusion the paper draws from its own results — it cites no other source for it, so there is none to check. The quote shows it is in the paper.
In the paper
“Consequently, we cannot discount a possible causative effect of severe T-deficiency on BMI.”
§ Causal relationship between obesity and serum testosterone status in men: A bi-directional mendelian randomization analysis > Discussion
hedgedconditional- Asserted: passes — The authors put it forward as true.
- Checkable: passes — It can be checked against evidence.
- Load-bearing: passes — The paper’s conclusions depend on it.
- Based: passes — The paper gives a reason why it holds.
A conclusion the paper draws from its own results — it cites no other source for it, so there is none to check. The quote shows it is in the paper.
In the paper
“Although the present study provides compelling evidence that obesity reduces serum T levels, it cannot determine the mechanism for this causal effect which may occur at several levels of the hypothalamus-pituitary-gonadal axis.”
§ Causal relationship between obesity and serum testosterone status in men: A bi-directional mendelian randomization analysis > Discussion
plain- Asserted: passes — The authors put it forward as true.
- Checkable: passes — It can be checked against evidence.
- Load-bearing: passes — The paper’s conclusions depend on it.
- Based: passes — The paper gives a reason why it holds.
None of the sources cited for this claim have been checked yet.
In the paper
“It is well known that in morbidly obese men, LH levels and pulse amplitude are attenuated when compared with normal-weight controls [39, 40].”
§ Causal relationship between obesity and serum testosterone status in men: A bi-directional mendelian randomization analysis > Discussion
What the sources say
- Not checked yetcites [39] VA Giagulli, 1994, Pathogenesis of the decreased androgen levels in obese men, The Journal of clinical endocrinology and metabolism
- Not checked yetcites [40] A Vermeulen, 1993, Attenuated luteinizing hormone (LH) pulse amplitude but normal LH pulse frequency, and its relation to plasma androgens in hypogonadism of obese men, The Journal of clinical endocrinology and metabolism
boostedcorrelational- Asserted: passes — The authors put it forward as true.
- Checkable: passes — It can be checked against evidence.
- Load-bearing: unclear — It is unclear whether the paper’s conclusions depend on it.
- Based: passes — The paper gives a reason why it holds.
A conclusion the paper draws from its own results — it cites no other source for it, so there is none to check. The quote shows it is in the paper.
In the paper
“Our finding supports the notions that male hypogonadism can be considered as one of the many adverse consequences of overweight and obesity and that body weight loss and lifestyle interventions should be the first approach offered to obese men with low serum T [48].”
§ Causal relationship between obesity and serum testosterone status in men: A bi-directional mendelian randomization analysis > Discussion
plaindirect- Asserted: passes — The authors put it forward as true.
- Checkable: passes — It can be checked against evidence.
- Load-bearing: passes — The paper’s conclusions depend on it.
- Based: passes — The paper gives a reason why it holds.
What the paper did — it cites no source for this, so there is none to check. The quote shows it is in the paper.
In the paper
“For instance, although both BMI and T were associated with age and smoking, the different GRSs used in the present study were not associated with these two potential confounders.”
§ Causal relationship between obesity and serum testosterone status in men: A bi-directional mendelian randomization analysis > Discussion
plain- Asserted: passes — The authors put it forward as true.
- Checkable: passes — It can be checked against evidence.
- Load-bearing: passes — The paper’s conclusions depend on it.
- Based: passes — The paper gives a reason why it holds.
- The authors state this as an assumption: The genotype is independent of confounders.
In the paper
“In the present study, there was a small overlap (less than 2%), between the cohorts used in the present study and the study by Locke et al that identified the BMI-associated SNPs[17].”
§ Causal relationship between obesity and serum testosterone status in men: A bi-directional mendelian randomization analysis > Discussion
What the sources say
- Not checked yetcites [17] AE Locke, 2015, Genetic studies of body mass index yield new insights for obesity biology, Nature source
plain- Asserted: passes — The authors put it forward as true.
- Checkable: passes — It can be checked against evidence.
- Load-bearing: passes — The paper’s conclusions depend on it.
- Based: passes — The paper gives a reason why it holds.
What the paper did — it cites no source for this, so there is none to check. The quote shows it is in the paper.
In the paper
“We did not detect any violations of the assumptions underlying MR as far as they could be tested.”
§ Causal relationship between obesity and serum testosterone status in men: A bi-directional mendelian randomization analysis > Discussion
hedged- Asserted: passes — The authors put it forward as true.
- Checkable: passes — It can be checked against evidence.
- Load-bearing: passes — The paper’s conclusions depend on it.
- Based: passes — The paper gives a reason why it holds.
- The authors state this as an assumption: The genotypes are randomized.
- The authors state this as an assumption: The genetic variants considered as instruments affect the outcome only by modifying the biomarker—that is, these variants have no pleiotropic effects on the outcome.
- The authors state this as an assumption: The genotype is independent of confounders.
What the paper did — it cites no source for this, so there is none to check. The quote shows it is in the paper.
In the paper
“Firstly, very similar results were obtained using an unweighted genetic risk score that avoids the potential bias from the use of internal weights.”
§ Causal relationship between obesity and serum testosterone status in men: A bi-directional mendelian randomization analysis > Discussion
plain- Asserted: passes — The authors put it forward as true.
- Checkable: passes — It can be checked against evidence.
- Load-bearing: passes — The paper’s conclusions depend on it.
- Based: passes — The paper gives a reason why it holds.
None of the sources cited for this claim have been checked yet.
In the paper
“Moreover, the use of two separate independent genetic instruments with similar point estimates of the causal effect of BMI on serum T further reduced the risk of pleiotropy [32, 33].”
§ Causal relationship between obesity and serum testosterone status in men: A bi-directional mendelian randomization analysis > Discussion
What the sources say
- Not checked yetcites [32] G Davey Smith, 2011, Use of genetic markers and gene-diet interactions for interrogating population-level causal influences of diet on health, Genes Nutr source
- Not checked yetcites [33] PN Taylor, 2016, Paradoxical Relationship Between Body Mass Index and Thyroid Hormone Levels: A Study Using Mendelian Randomization, The Journal of clinical endocrinology and metabolism source
plaindirect- Asserted: passes — The authors put it forward as true.
- Checkable: passes — It can be checked against evidence.
- Load-bearing: passes — The paper’s conclusions depend on it.
- Based: passes — The paper gives a reason why it holds.
- The authors state this as an assumption: The genetic variants considered as instruments affect the outcome only by modifying the biomarker—that is, these variants have no pleiotropic effects on the outcome.
None of the sources cited for this claim have been checked yet.
In the paper
“Secondly, similar results were also obtained using a genetic risk score based solely on the SNP in the FTO gene, which is a gene that has been found to be associated with BMI in numerous studies, where none of the cohorts used in the present study were included [34–36].”
§ Causal relationship between obesity and serum testosterone status in men: A bi-directional mendelian randomization analysis > Discussion
What the sources say
- Not checked yetcites [34] TM Frayling, 2007, A common variant in the FTO gene is associated with body mass index and predisposes to childhood and adult obesity, Science source
- Not checked yetcites [35] A Scuteri, 2007, Genome-wide association scan shows genetic variants in the FTO gene are associated with obesity-related traits, PLoS genetics source
- Not checked yetcites [36] RJ Loos, 2008, Common variants near MC4R are associated with fat mass, weight and risk of obesity, Nat Genet source
plain- Asserted: passes — The authors put it forward as true.
- Checkable: passes — It can be checked against evidence.
- Load-bearing: passes — The paper’s conclusions depend on it.
- Based: passes — The paper gives a reason why it holds.
A conclusion the paper draws from its own results — it cites no other source for it, so there is none to check. The quote shows it is in the paper.
In the paper
“The participant data used in the present study were unrelated men with European ancestry, limiting the generalizability of the observed findings to other ethnic groups.”
§ Causal relationship between obesity and serum testosterone status in men: A bi-directional mendelian randomization analysis > Discussion
plain- Asserted: passes — The authors put it forward as true.
- Checkable: passes — It can be checked against evidence.
- Load-bearing: unclear — It is unclear whether the paper’s conclusions depend on it.
- Based: passes — The paper gives a reason why it holds.
What the paper did — it cites no source for this, so there is none to check. The quote shows it is in the paper.
In the paper
“As a consequence, there is a chance that the causal estimate calculated using the wGRSBMI could be biased.”
§ Causal relationship between obesity and serum testosterone status in men: A bi-directional mendelian randomization analysis > Discussion
hedgedconditional- Asserted: passes — The authors put it forward as true.
- Checkable: passes — It can be checked against evidence.
- Load-bearing: unclear — It is unclear whether the paper’s conclusions depend on it.
- Based: passes — The paper gives a reason why it holds.
What the paper did — it cites no source for this, so there is none to check. The quote shows it is in the paper.
In the paper
“It is, however, highly unlikely that this has had a major impact on the results for two reasons.”
§ Causal relationship between obesity and serum testosterone status in men: A bi-directional mendelian randomization analysis > Discussion
hedged- Asserted: passes — The authors put it forward as true.
- Checkable: passes — It can be checked against evidence.
- Load-bearing: passes — The paper’s conclusions depend on it.
- Based: passes — The paper gives a reason why it holds.
What the paper did — it cites no source for this, so there is none to check. The quote shows it is in the paper.
In the paper
“However, this also means that a major influence from population stratification is unlikely.”
§ Causal relationship between obesity and serum testosterone status in men: A bi-directional mendelian randomization analysis > Discussion
hedged- Asserted: passes — The authors put it forward as true.
- Checkable: passes — It can be checked against evidence.
- Load-bearing: passes — The paper’s conclusions depend on it.
- Based: passes — The paper gives a reason why it holds.
None of the sources cited for this claim have been checked yet.
In the paper
“However, using as many as 97 recently reported independent SNPs to index BMI, we were able to minimize the risk of shared pleiotropy and linkage-disequilibrium-induced confounding pleiotropic effects [32, 33].”
§ Causal relationship between obesity and serum testosterone status in men: A bi-directional mendelian randomization analysis > Discussion
What the sources say
- Not checked yetcites [32] G Davey Smith, 2011, Use of genetic markers and gene-diet interactions for interrogating population-level causal influences of diet on health, Genes Nutr source
- Not checked yetcites [33] PN Taylor, 2016, Paradoxical Relationship Between Body Mass Index and Thyroid Hormone Levels: A Study Using Mendelian Randomization, The Journal of clinical endocrinology and metabolism source
plaindirect- Asserted: passes — The authors put it forward as true.
- Checkable: passes — It can be checked against evidence.
- Load-bearing: passes — The paper’s conclusions depend on it.
- Based: passes — The paper gives a reason why it holds.
- The authors state this as an assumption: The genetic variants considered as instruments affect the outcome only by modifying the biomarker—that is, these variants have no pleiotropic effects on the outcome.
- It may state two separate claims as one. 23
- Probably not a substantial claim. 10
A result the paper reports from its own data — it cites no other source for it, so there is none to check. The quote shows it is in the paper.
In the paper
“Although both BMI and serum T were associated with age and smoking (p<0.05)”
§ Causal relationship between obesity and serum testosterone status in men: A bi-directional mendelian randomization analysis > Results > Validation of the instruments
plaincorrelational- Asserted: passes — The authors put it forward as true.
- Checkable: passes — It can be checked against evidence.
- Load-bearing: unclear — It is unclear whether the paper’s conclusions depend on it.
- Based: passes — The paper gives a reason why it holds.
It may state two separate claims as one.
A result the paper reports from its own data — it cites no other source for it, so there is none to check. The quote shows it is in the paper.
In the paper
“Although both these two separate T GRSs were robustly associated with serum T, no evidence of significant associations between these two separate T GRSs and BMI was observed (S7 Table).”
§ Causal relationship between obesity and serum testosterone status in men: A bi-directional mendelian randomization analysis > Results > Evaluation of causal association using MR approach
plaincorrelational- Asserted: passes — The authors put it forward as true.
- Checkable: passes — It can be checked against evidence.
- Load-bearing: unclear — It is unclear whether the paper’s conclusions depend on it.
- Based: passes — The paper gives a reason why it holds.
It may state two separate claims as one.
A result the paper reports from its own data — it cites no other source for it, so there is none to check. The quote shows it is in the paper.
In the paper
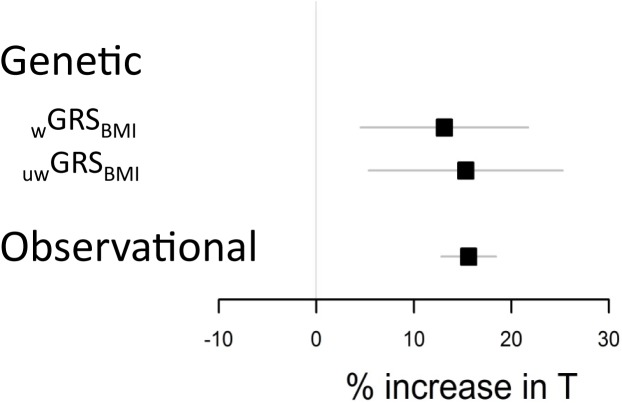
“Notably, for a body weight reduction altering the BMI from 30 (cut off for obesity) to 25 (cut off for overweight) kg/m2, the effect would equal a 13% (using IV ratio from wGRSBMI) to 15% (using IV ratio from uwGRSBMI) increase in serum T while a corresponding observational effect would equal a 16% increase in serum T (Fig 3).”
§ Causal relationship between obesity and serum testosterone status in men: A bi-directional mendelian randomization analysis > Results > Evaluation of causal association using MR approach
hedgeddirectn = 7,446- Asserted: passes — The authors put it forward as true.
- Checkable: passes — It can be checked against evidence.
- Load-bearing: passes — The paper’s conclusions depend on it.
- Based: passes — The paper gives a reason why it holds.
It may state two separate claims as one.
A result the paper reports from its own data — it cites no other source for it, so there is none to check. The quote shows it is in the paper.
In the paper
“The wGRSBMI and uwGRSBMI associations with T did not vary by age or smoking (p > 0.05 for interaction terms in pooled analyses).”
§ Causal relationship between obesity and serum testosterone status in men: A bi-directional mendelian randomization analysis > Results > Evaluation of causal association using MR approach
plain- Asserted: passes — The authors put it forward as true.
- Checkable: passes — It can be checked against evidence.
- Load-bearing: unclear — It is unclear whether the paper’s conclusions depend on it.
- Based: passes — The paper gives a reason why it holds.
It may state two separate claims as one.
A result the paper reports from its own data — it cites no other source for it, so there is none to check. The quote shows it is in the paper.
In the paper
“Both wGRST and uwGRST were highly significantly associated with serum T in the meta-analyzed combined data set (wGRST p = 4.7*10−45, R2 = 2.5%; uwGRST p = 3.9*10−38, R2 = 2.1%; Fig 2B, S3 Table).”
§ Causal relationship between obesity and serum testosterone status in men: A bi-directional mendelian randomization analysis > Results > Validation of the instruments
boostedcorrelational- Asserted: passes — The authors put it forward as true.
- Checkable: passes — It can be checked against evidence.
- Load-bearing: passes — The paper’s conclusions depend on it.
- Based: passes — The paper gives a reason why it holds.
It may state two separate claims as one.
A result the paper reports from its own data — it cites no other source for it, so there is none to check. The quote shows it is in the paper.
In the paper
“The wGRST and uwGRST associations with T did not vary by age, smoking or BMI (p values > 0.05 for all interaction terms in pooled analyses).”
§ Causal relationship between obesity and serum testosterone status in men: A bi-directional mendelian randomization analysis > Results > Validation of the instruments
plain- Asserted: passes — The authors put it forward as true.
- Checkable: passes — It can be checked against evidence.
- Load-bearing: passes — The paper’s conclusions depend on it.
- Based: passes — The paper gives a reason why it holds.
It may state two separate claims as one.
A result the paper reports from its own data — it cites no other source for it, so there is none to check. The quote shows it is in the paper.
In the paper
“Both wGRSBMI and uwGRSBMI were highly significantly associated with ln-transformed BMI in all cohorts individually and when combined in a meta-analytic approach (wGRSBMI p = 4.2*10−35, R2 = 1.9%; uwGRSBMI p = 5.0*10−27, R2 = 1.5%; Fig 2A, S1 Table).”
§ Causal relationship between obesity and serum testosterone status in men: A bi-directional mendelian randomization analysis > Results > Validation of the instruments
plaincorrelational- Asserted: passes — The authors put it forward as true.
- Checkable: passes — It can be checked against evidence.
- Load-bearing: passes — The paper’s conclusions depend on it.
- Based: passes — The paper gives a reason why it holds.
It may state two separate claims as one.
A result the paper reports from its own data — it cites no other source for it, so there is none to check. The quote shows it is in the paper.
In the paper
“Interestingly, the two BMI SNPs that were most robustly associated with BMI were also significantly associated with serum T, but in the opposite direction (rs1558902 in the FTO locus, p = 4.0*10−2 and rs6567160 in the M4CR locus, p = 3.0*10−3; S2 Table).”
§ Causal relationship between obesity and serum testosterone status in men: A bi-directional mendelian randomization analysis > Results > Evaluation of causal association using MR approach
plaincorrelational- Asserted: passes — The authors put it forward as true.
- Checkable: passes — It can be checked against evidence.
- Load-bearing: unclear — It is unclear whether the paper’s conclusions depend on it.
- Based: passes — The paper gives a reason why it holds.
It may state two separate claims as one.
A result the paper reports from its own data — it cites no other source for it, so there is none to check. The quote shows it is in the paper.
In the paper
“Neither the wGRST nor the uwGRST was associated with BMI (Fig 2D, S3 Table).”
§ Causal relationship between obesity and serum testosterone status in men: A bi-directional mendelian randomization analysis > Results > Evaluation of causal association using MR approach
plain- Asserted: passes — The authors put it forward as true.
- Checkable: passes — It can be checked against evidence.
- Load-bearing: passes — The paper’s conclusions depend on it.
- Based: passes — The paper gives a reason why it holds.
It may state two separate claims as one.
A result the paper reports from its own data — it cites no other source for it, so there is none to check. The quote shows it is in the paper.
In the paper
“Notably, the two SNPs most robustly associated with BMI in the present study are also significantly associated with serum T but in the opposite direction.”
§ Causal relationship between obesity and serum testosterone status in men: A bi-directional mendelian randomization analysis > Discussion
plaincorrelational- Asserted: passes — The authors put it forward as true.
- Checkable: passes — It can be checked against evidence.
- Load-bearing: unclear — It is unclear whether the paper’s conclusions depend on it.
- Based: passes — The paper gives a reason why it holds.
It may state two separate claims as one.
A result the paper reports from its own data — it cites no other source for it, so there is none to check. The quote shows it is in the paper.
In the paper
“In line with this, both wGRST and uwGRST were significantly associated with SHBG in the present study.”
§ Causal relationship between obesity and serum testosterone status in men: A bi-directional mendelian randomization analysis > Discussion
plaincorrelational- Asserted: passes — The authors put it forward as true.
- Checkable: passes — It can be checked against evidence.
- Load-bearing: passes — The paper’s conclusions depend on it.
- Based: passes — The paper gives a reason why it holds.
It may state two separate claims as one.
A result the paper reports from its own data — it cites no other source for it, so there is none to check. The quote shows it is in the paper.
In the paper
“Although both these two separate T GRSs were robustly associated with serum T, no evidence of significant associations between these two separate T GRSs and BMI was observed.”
§ Causal relationship between obesity and serum testosterone status in men: A bi-directional mendelian randomization analysis > Discussion
plaincorrelational- Asserted: passes — The authors put it forward as true.
- Checkable: passes — It can be checked against evidence.
- Load-bearing: passes — The paper’s conclusions depend on it.
- Based: passes — The paper gives a reason why it holds.
It may state two separate claims as one.
What the paper did — it cites no source for this, so there is none to check. The quote shows it is in the paper.
In the paper
“Two independent instrumental variables were used for each phenotype to assess pleiotropy.”
§ Causal relationship between obesity and serum testosterone status in men: A bi-directional mendelian randomization analysis > Methods > Statistical analysis
plain- Asserted: passes — The authors put it forward as true.
- Checkable: passes — It can be checked against evidence.
- Load-bearing: fails — The paper’s conclusions may not depend on it.
- Based: passes — The paper gives a reason why it holds.
Probably not a substantial claim. The paper’s conclusions may not depend on it.
None of the sources cited for this claim have been checked yet.
In the paper
“Most randomized, placebo-controlled trials have indicated that T treatment increases lean mass and reduces fat mass in men with low serum T [2–7]”
§ Causal relationship between obesity and serum testosterone status in men: A bi-directional mendelian randomization analysis > Introduction
What the sources say
- Not checked yetcites [2] MR Blackman, 2002, Growth hormone and sex steroid administration in healthy aged women and men: a randomized controlled trial, Jama source
- Not checked yetcites [3] AM Kenny, 2001, Effects of transdermal testosterone on bone and muscle in older men with low bioavailable testosterone levels, J Gerontol A Biol Sci Med Sci source
- Not checked yetcites [4] ST Page, 2005, Exogenous testosterone (T) alone or with finasteride increases physical performance, grip strength, and lean body mass in older men with low serum T, The Journal of clinical endocrinology and metabolism source
- Not checked yetcites [5] PJ Snyder, 1999, Effect of testosterone treatment on body composition and muscle strength in men over 65 years of age, The Journal of clinical endocrinology and metabolism
- Not checked yetcites [6] U Srinivas-Shankar, 2010, Effects of testosterone on muscle strength, physical function, body composition, and quality of life in intermediate-frail and frail elderly men: a randomized, double-blind, placebo-controlled study, The Journal of clinical endocrinology and metabolism source
- Not checked yetcites [7] F Saad, 2012, Testosterone as potential effective therapy in treatment of obesity in men with testosterone deficiency: a review, Curr Diabetes Rev source
hedgeddirect- Asserted: passes — The authors put it forward as true.
- Checkable: passes — It can be checked against evidence.
- Load-bearing: passes — The paper’s conclusions depend on it.
- Based: passes — The paper gives a reason why it holds.
It may state two separate claims as one.
In the paper
“while the largest GWAS on serum T identified three independent genetic variants associated with serum T in men [17, 18].”
§ Causal relationship between obesity and serum testosterone status in men: A bi-directional mendelian randomization analysis > Introduction
What the sources say
- Not checked yetcites [18] C Ohlsson, 2011, Genetic determinants of serum testosterone concentrations in men, PLoS genetics source
plaincorrelational- Asserted: passes — The authors put it forward as true.
- Checkable: passes — It can be checked against evidence.
- Load-bearing: passes — The paper’s conclusions depend on it.
- Based: passes — The paper gives a reason why it holds.
Probably not a substantial claim.
None of the sources cited for this claim have been checked yet.
In the paper
“but the overall effect on body weight and BMI in men with different T-status is inconsistent.”
§ Causal relationship between obesity and serum testosterone status in men: A bi-directional mendelian randomization analysis > Introduction
What the sources say
- Not checked yetcites [2] MR Blackman, 2002, Growth hormone and sex steroid administration in healthy aged women and men: a randomized controlled trial, Jama source
- Not checked yetcites [3] AM Kenny, 2001, Effects of transdermal testosterone on bone and muscle in older men with low bioavailable testosterone levels, J Gerontol A Biol Sci Med Sci source
- Not checked yetcites [4] ST Page, 2005, Exogenous testosterone (T) alone or with finasteride increases physical performance, grip strength, and lean body mass in older men with low serum T, The Journal of clinical endocrinology and metabolism source
- Not checked yetcites [5] PJ Snyder, 1999, Effect of testosterone treatment on body composition and muscle strength in men over 65 years of age, The Journal of clinical endocrinology and metabolism
- Not checked yetcites [6] U Srinivas-Shankar, 2010, Effects of testosterone on muscle strength, physical function, body composition, and quality of life in intermediate-frail and frail elderly men: a randomized, double-blind, placebo-controlled study, The Journal of clinical endocrinology and metabolism source
- Not checked yetcites [7] F Saad, 2012, Testosterone as potential effective therapy in treatment of obesity in men with testosterone deficiency: a review, Curr Diabetes Rev source
plain- Asserted: passes — The authors put it forward as true.
- Checkable: passes — It can be checked against evidence.
- Load-bearing: passes — The paper’s conclusions depend on it.
- Based: passes — The paper gives a reason why it holds.
Probably not a substantial claim.
In the paper
“The most recent and largest genome wide association study (GWAS) on BMI identified 97 independent genetic variants associated with BMI”
§ Causal relationship between obesity and serum testosterone status in men: A bi-directional mendelian randomization analysis > Introduction
What the sources say
- Not checked yetcites [17] AE Locke, 2015, Genetic studies of body mass index yield new insights for obesity biology, Nature source
plaincorrelational- Asserted: passes — The authors put it forward as true.
- Checkable: passes — It can be checked against evidence.
- Load-bearing: fails — The paper’s conclusions may not depend on it.
- Based: passes — The paper gives a reason why it holds.
Probably not a substantial claim. The paper’s conclusions may not depend on it.
In the paper
“GOOD and MrOS Sweden used a validated gas chromatography/mass spectroscopy (intra-assay CV, 2.9%; inter-assay CV, 3.4%) to measure serum T [20].”
§ Causal relationship between obesity and serum testosterone status in men: A bi-directional mendelian randomization analysis > Methods > Serum testosterone
What the sources say
- Not checked yetcites [20] L Vandenput, 2007, Serum levels of specific glucuronidated androgen metabolites predict BMD and prostate volume in elderly men, J Bone Miner Res source
plain- Asserted: passes — The authors put it forward as true.
- Checkable: passes — It can be checked against evidence.
- Load-bearing: fails — The paper’s conclusions may not depend on it.
- Based: passes — The paper gives a reason why it holds.
Probably not a substantial claim. The paper’s conclusions may not depend on it.
What the paper did — it cites no source for this, so there is none to check. The quote shows it is in the paper.
In the paper
“Linearity was assessed by adding a quadratic term to the regression analyses.”
§ Causal relationship between obesity and serum testosterone status in men: A bi-directional mendelian randomization analysis > Methods > Statistical analysis
plain- Asserted: passes — The authors put it forward as true.
- Checkable: passes — It can be checked against evidence.
- Load-bearing: fails — The paper’s conclusions may not depend on it.
- Based: passes — The paper gives a reason why it holds.
Probably not a substantial claim. The paper’s conclusions may not depend on it.
What the paper did — it cites no source for this, so there is none to check. The quote shows it is in the paper.
In the paper
“the associations between genotype and known confounders (age and smoking) were examined as this is a key assumption in MR analyses.”
§ Causal relationship between obesity and serum testosterone status in men: A bi-directional mendelian randomization analysis > Methods > Statistical analysis
plaincorrelational- Asserted: passes — The authors put it forward as true.
- Checkable: passes — It can be checked against evidence.
- Load-bearing: passes — The paper’s conclusions depend on it.
- Based: passes — The paper gives a reason why it holds.
Probably not a substantial claim.
What the paper did — it cites no source for this, so there is none to check. The quote shows it is in the paper.
In the paper
“The F-statistics were 188 and 156 for wGRST and uwGRST, respectively (S3 Table).”
§ Causal relationship between obesity and serum testosterone status in men: A bi-directional mendelian randomization analysis > Results > Validation of the instruments
plain- Asserted: passes — The authors put it forward as true.
- Checkable: passes — It can be checked against evidence.
- Load-bearing: passes — The paper’s conclusions depend on it.
- Based: passes — The paper gives a reason why it holds.
It may state two separate claims as one.
In the paper
“Cross-sectional data from the large European Male Aging Study (EMAS) revealed that BMI was the strongest determinant of serum T and obese men (BMI > 30 kg/m2) had as much as 1.47 ng/ml lower serum T compared with normal weight subjects (BMI < 25 kg/m2; [1]).”
§ Causal relationship between obesity and serum testosterone status in men: A bi-directional mendelian randomization analysis > Discussion
What the sources say
- Not checked yetcites [1] FC Wu, 2008, Hypothalamic-pituitary-testicular axis disruptions in older men are differentially linked to age and modifiable risk factors: the European Male Aging Study, The Journal of clinical endocrinology and metabolism source
plaincorrelational- Asserted: passes — The authors put it forward as true.
- Checkable: passes — It can be checked against evidence.
- Load-bearing: passes — The paper’s conclusions depend on it.
- Based: passes — The paper gives a reason why it holds.
It may state two separate claims as one.
What the paper did — it cites no source for this, so there is none to check. The quote shows it is in the paper.
In the paper
“The F-statistics, reflecting the strength of the instruments, were 147 and 111 for wGRSBMI and uwGRSBMI, respectively (S1 Table).”
§ Causal relationship between obesity and serum testosterone status in men: A bi-directional mendelian randomization analysis > Results > Validation of the instruments
plain- Asserted: passes — The authors put it forward as true.
- Checkable: passes — It can be checked against evidence.
- Load-bearing: passes — The paper’s conclusions depend on it.
- Based: passes — The paper gives a reason why it holds.
It may state two separate claims as one.
In the paper
“Obese subjects often have reduced gonadotropin concentrations indicating that the primary effect is mediated at the hypothalamus-pituitary level rather than at the testicular level [38].”
§ Causal relationship between obesity and serum testosterone status in men: A bi-directional mendelian randomization analysis > Discussion
What the sources say
- Not checked yetcites [38] P Dandona, 2011, Update: Hypogonadotropic hypogonadism in type 2 diabetes and obesity, The Journal of clinical endocrinology and metabolism source
hedgeddirect- Asserted: passes — The authors put it forward as true.
- Checkable: passes — It can be checked against evidence.
- Load-bearing: unclear — It is unclear whether the paper’s conclusions depend on it.
- Based: passes — The paper gives a reason why it holds.
It may state two separate claims as one.
In the paper
“The mean percent body weight loss at endpoint was 10% in low-calorie diet studies and 32% in bariatric surgery studies and the corresponding increases in serum T levels were 0.83 ng/ml and 2.54 ng/ml, respectively.”
§ Causal relationship between obesity and serum testosterone status in men: A bi-directional mendelian randomization analysis > Discussion
What the sources say
- Not checked yetcites [37] G Corona, 2013, Body weight loss reverts obesity-associated hypogonadotropic hypogonadism: a systematic review and meta-analysis, European journal of endocrinology / European Federation of Endocrine Societies source
plaincorrelational- Asserted: passes — The authors put it forward as true.
- Checkable: passes — It can be checked against evidence.
- Load-bearing: passes — The paper’s conclusions depend on it.
- Based: passes — The paper gives a reason why it holds.
It may state two separate claims as one.
In the paper
“Not only serum T but also the gonadotropins FSH and LH were increased by body weight reduction, suggesting that body weight loss reverses obesity-associated hypogonadotropic hypogonadism [37].”
§ Causal relationship between obesity and serum testosterone status in men: A bi-directional mendelian randomization analysis > Discussion
What the sources say
- Not checked yetcites [37] G Corona, 2013, Body weight loss reverts obesity-associated hypogonadotropic hypogonadism: a systematic review and meta-analysis, European journal of endocrinology / European Federation of Endocrine Societies source
hedgeddirect- Asserted: passes — The authors put it forward as true.
- Checkable: passes — It can be checked against evidence.
- Load-bearing: unclear — It is unclear whether the paper’s conclusions depend on it.
- Based: passes — The paper gives a reason why it holds.
It may state two separate claims as one.
None of the sources cited for this claim have been checked yet.
In the paper
“While the MR approach enables the approximation of life-long differences in average concentrations, genetic markers do not examine the influences arising from the extremes of non-linear distributions [28, 50].”
§ Causal relationship between obesity and serum testosterone status in men: A bi-directional mendelian randomization analysis > Discussion
What the sources say
- Not checked yetcites [28] KS Vimaleswaran, 2013, Causal relationship between obesity and vitamin D status: bi-directional Mendelian randomization analysis of multiple cohorts, PLoS medicine source
- Not checked yetcites [50] J Zheng, 2011, A comparison of approaches to account for uncertainty in analysis of imputed genotypes, Genet Epidemiol source
plain- Asserted: passes — The authors put it forward as true.
- Checkable: passes — It can be checked against evidence.
- Load-bearing: passes — The paper’s conclusions depend on it.
- Based: passes — The paper gives a reason why it holds.
It may state two separate claims as one.
None of the sources cited for this claim have been checked yet.
In the paper
“The underlying loci of these two SNPs, FTO and MC4R, are well established obesity-related loci [35, 36, 45].”
§ Causal relationship between obesity and serum testosterone status in men: A bi-directional mendelian randomization analysis > Discussion
What the sources say
- Not checked yetcites [35] A Scuteri, 2007, Genome-wide association scan shows genetic variants in the FTO gene are associated with obesity-related traits, PLoS genetics source
- Not checked yetcites [36] RJ Loos, 2008, Common variants near MC4R are associated with fat mass, weight and risk of obesity, Nat Genet source
- Not checked yetcites [45] S Peng, 2011, FTO gene polymorphisms and obesity risk: a meta-analysis, BMC Med source
boostedcorrelational- Asserted: passes — The authors put it forward as true.
- Checkable: passes — It can be checked against evidence.
- Load-bearing: fails — The paper’s conclusions may not depend on it.
- Based: passes — The paper gives a reason why it holds.
Probably not a substantial claim. The paper’s conclusions may not depend on it.
In the paper
“Two of the three SNPs constituting the genetic risk score for BMI reside in the SHBG locus and have previously been reported to associate with SHBG (18).”
§ Causal relationship between obesity and serum testosterone status in men: A bi-directional mendelian randomization analysis > Discussion
What the sources say
- Not checked yetcites [18] C Ohlsson, 2011, Genetic determinants of serum testosterone concentrations in men, PLoS genetics source
plaincorrelational- Asserted: passes — The authors put it forward as true.
- Checkable: passes — It can be checked against evidence.
- Load-bearing: passes — The paper’s conclusions depend on it.
- Based: passes — The paper gives a reason why it holds.
It may state two separate claims as one.
None of the sources cited for this claim have been checked yet.
In the paper
“The FTO locus has previously been reported to be associated with affected androgen levels, polycystic ovary syndrome susceptibility and age at menarche in females while its impact on serum T and T-related diseases in men is unknown and warrants further investigations [46, 47].”
§ Causal relationship between obesity and serum testosterone status in men: A bi-directional mendelian randomization analysis > Discussion
What the sources say
- Not checked yetcites [46] CE Elks, 2010, Thirty new loci for age at menarche identified by a meta-analysis of genome-wide association studies, Nat Genet source
- Not checked yetcites [47] K Song do, 2014, FTO Gene Variants Are Associated with PCOS Susceptibility and Hyperandrogenemia in Young Korean Women, Diabetes Metab J source
plaincorrelational- Asserted: passes — The authors put it forward as true.
- Checkable: passes — It can be checked against evidence.
- Load-bearing: fails — The paper’s conclusions may not depend on it.
- Based: passes — The paper gives a reason why it holds.
Probably not a substantial claim. The paper’s conclusions may not depend on it.
What the paper did — it cites no source for this, so there is none to check. The quote shows it is in the paper.
In the paper
“Also, as we included participants at random and consecutively from the general population, the potential for selection bias is minimal.”
§ Causal relationship between obesity and serum testosterone status in men: A bi-directional mendelian randomization analysis > Discussion
plain- Asserted: passes — The authors put it forward as true.
- Checkable: passes — It can be checked against evidence.
- Load-bearing: fails — The paper’s conclusions may not depend on it.
- Based: passes — The paper gives a reason why it holds.
Probably not a substantial claim. The paper’s conclusions may not depend on it. It may state two separate claims as one.
What the paper did — it cites no source for this, so there is none to check. The quote shows it is in the paper.
In the paper
“The validity of our findings was strengthened by the fact that very similar results were obtained for both weighted and un-weighted genetic risk scores and when combined estimates were calculated using pooling and a meta-analytic approach.”
§ Causal relationship between obesity and serum testosterone status in men: A bi-directional mendelian randomization analysis > Discussion
boosted- Asserted: passes — The authors put it forward as true.
- Checkable: passes — It can be checked against evidence.
- Load-bearing: passes — The paper’s conclusions depend on it.
- Based: passes — The paper gives a reason why it holds.
It may state two separate claims as one.
The authors state this as an assumption.
Genetic variants are randomly distributed with respect to confounding factors because they are fixed at conception.
“Since genes can be thought of as randomized and fixed at conception, confounding factors will be equally distributed among different genotypes.”
The authors state this as an assumption.
A phenotypic trait cannot cause genetic variation, so Mendelian randomization analyses are free of reverse causation.
“Furthermore, it will be free of reverse causation since a phenotypic trait cannot cause genetic variation.”
The authors state this as an assumption.
Covariates are randomly distributed with respect to genotype.
“although covariates are expected to be randomly distributed with respect to genotype, the associations between genotype and known confounders (age and smoking) were examined as this is a key assumption in MR analyses.”
The authors state this as an assumption.
The genotypes are randomized.
“Three key assumptions underlie the MR randomization approach: the genotypes are randomized; the genetic variants considered as instruments affect the outcome only by modifying the biomarker—that is, these variants have no pleiotropic effects on the outcome; and the genotype is independent of confounders [27, 30, 31].”
The authors state this as an assumption.
The genetic variants considered as instruments affect the outcome only by modifying the biomarker—that is, these variants have no pleiotropic effects on the outcome.
“Three key assumptions underlie the MR randomization approach: the genotypes are randomized; the genetic variants considered as instruments affect the outcome only by modifying the biomarker—that is, these variants have no pleiotropic effects on the outcome; and the genotype is independent of confounders [27, 30, 31].”
The authors state this as an assumption.
The genotype is independent of confounders.
“Three key assumptions underlie the MR randomization approach: the genotypes are randomized; the genetic variants considered as instruments affect the outcome only by modifying the biomarker—that is, these variants have no pleiotropic effects on the outcome; and the genotype is independent of confounders [27, 30, 31].”
Claims other papers make about this one
Each is checked against this paper’s own text: does it say what the citing paper says it does?
In the citing paper
“While a bidirectional Mendelian randomization study suggested that the effect of an elevated BMI on low testosterone is more important than the effect of low testosterone on an increased BMI, such studies require confirmation in independent samples. 63”
From The role of the androgen receptor in the pathogenesis of obesity and its utility as a target for obesity treatments (2022) · cites this paper as [63]
In the citing paper
“Consistent with the foregoing discussion, the authors concluded that BMI has a causal effect on testosterone, whereas testosterone does not impact BMI.”
From Hypogonadism and male obesity: Focus on unresolved questions (2018) · cites this paper as [59]
Self-check
Percentages, sums and reported differences re-computed from the paper’s own numbers.
Each contradiction between two passages listed here was confirmed by an independent check.
Rated minor: it would not touch a result — a value no result rests on, a p-value that stays on the same side of the significance level, or a conflict that is clerical, resolved elsewhere in the paper, or outside its own findings.
In the paper
§ Causal relationship between obesity and serum testosterone status in men: A bi-directional mendelian randomization analysis > Discussion
“Two of the three SNPs constituting the genetic risk score for BMI reside in the SHBG locus and have previously been reported to associate with SHBG (18).”
§ Causal relationship between obesity and serum testosterone status in men: A bi-directional mendelian randomization analysis > Methods > Genotyping and genetic risk scores
“The 97 BMI-associated SNPs identified in a recent large-scale GWAS on BMI were used to construct a weighted genetic risk score, wGRSBMI”
Citations
Cites
Genetics of Food Intake Self-Regulation in Childhood: Literature Review and Research Opportunities
Faith, M. S., Carnell, S., & Kral, T. V. E. (2013) · Human Heredity · doi:10.1159/000353879 · Cited by 7,633
Lippa, N. C., & Sanderson, S. C. (2013) · Human Heredity · doi:10.1159/000353712 · Cited by 6,095
Mendelian randomization: Using genes as instruments for making causal inferences in epidemiology
Lawlor, D. A., Harbord, R. M., Sterne, J. A. C., Timpson, N., & Davey Smith, G. (2008) · Statistics in Medicine · doi:10.1002/sim.3034 · Cited by 4,618
Genetic studies of body mass index yield new insights for obesity biology
Study, T. L. C., Locke, A. E., The ADIPOGen Consortium, The AGEN-BMI Working Group, The CARDIOGRAMplusC4D Consortium, The CKDGen Consortium, The, G. L. G. C., The, I. C. B. P., The MAGIC Investigators, The MuTHER Consortium, et al. (2015) · Nature · doi:10.1038/nature14177 · Cited by 4,534
Self-citationFrayling, T. M., Timpson, N. J., Weedon, M. N., Zeggini, E., Freathy, R. M., Lindgren, C. M., Perry, J. R. B., Elliott, K. S., Lango, H., Rayner, N. W., et al. (2007) · Science · doi:10.1126/science.1141634 · Cited by 4,531
Bhasin, S., Cunningham, G. R., Hayes, F. J., Matsumoto, A. M., Snyder, P. J., Swerdloff, R. S., & Montori, V. M. (2010) · The Journal of Clinical Endocrinology & Metabolism · doi:10.1210/jc.2009-2354 · Cited by 1,954
Scuteri, A., Sanna, S., Chen, W.-M., Uda, M., Albai, G., Strait, J., Najjar, S., Nagaraja, R., Orrú, M., Usala, G., et al. (2007) · PLoS Genetics · doi:10.1371/journal.pgen.0030115 · Cited by 1,724
Adverse Events Associated with Testosterone Administration
Basaria, S., Coviello, A. D., Travison, T. G., Storer, T. W., Farwell, W. R., Jette, A. M., Eder, R., Tennstedt, S., Ulloor, J., Zhang, A., et al. (2010) · New England Journal of Medicine · doi:10.1056/nejmoa1000485 · Cited by 1,494
Common variants near MC4R are associated with fat mass, weight and risk of obesity
The Prostate, L., Loos, R. J. F., KORA, Study, N. H., Initiative, D. G., Study, T. S., The Wellcome Trust Case Control Consortium, FUSION, Lindgren, C. M., Li, S., et al. (2008) · Nature Genetics · doi:10.1038/ng.140 · Cited by 1,325
Mendelian randomization: prospects, potentials, and limitations
Smith, G. D. (2004) · International Journal of Epidemiology · doi:10.1093/ije/dyh132 · Cited by 1,222
Cited by
Sorted by citations
Larsson, S. C., & Burgess, S. (2021) · BMC Medicine · doi:10.1186/s12916-021-02188-x · Cited by 292
European Society of Endocrinology Clinical Practice Guideline: Endocrine work-up in obesity
Pasquali, R., Casanueva, F., Haluzik, M., van Hulsteijn, L., Ledoux, S., Monteiro, M. P., Salvador, J., Santini, F., Toplak, H., & Dekkers, O. M. (2020) · European Journal of Endocrinology · doi:10.1530/eje-19-0893 · Cited by 188
Hypogonadism and male obesity: Focus on unresolved questions
Grossmann, M. (2018) · Clinical Endocrinology · doi:10.1111/cen.13723 · Cited by 164
Aging and the Male Reproductive System
Kaufman, J., Lapauw, B., Mahmoud, A., T'Sjoen, G. G., & Huhtaniemi, I. T. (2019) · Endocrine Reviews · doi:10.1210/er.2018-00178 · Cited by 150
Obesity and male hypogonadism: Tales of a vicious cycle
Carrageta, D. F., Oliveira, P. F., Alves, M. G., & Monteiro, M. P. (2019) · Obesity Reviews · doi:10.1111/obr.12863 · Cited by 130
Metadata
- Authors
- Eriksson, J., Haring, R., Grarup, N., Vandenput, L., Wallaschofski, H., Lorentzen, E., Hansen, T., Mellström, D., Pedersen, O., Nauck, M., Lorentzon, M., Nystrup Husemoen, L. L., Völzke, H., Karlsson, M., Baumeister, S. E., Linneberg, A., & Ohlsson, C.
- Affiliations
- University of Gothenburg (SE)
- Universitätsmedizin Greifswald (DE)
- University of Copenhagen (DK)
- Lund University (SE)
- Corresponding author
- Ohlsson, Claes
- ORCID
- Venue
- PLOS ONE
- Publisher
- Public Library of Science (PLoS)
- Published
- 2017-04-27
- Volume
- 12
- Issue
- 4
- Pages
- e0176277
- ISSN
- 1932-6203 (ISSN-L)
- PMC
- PMC5407807
- OpenAlex
- W2609007932
- Semantic Scholar
- baed90fa3c006d6d7e42dbea4c5f18ef579c7240
- Cited by
- 101
- References
- 56
- Citations by year
- 2026: 6 · 2025: 6 · 2024: 9 · 2023: 10 · 2022: 15 · 2021: 17 · 2020: 15 · 2019: 10 · 2018: 13
- FWCI
- 8.22
- Type
- journal article
- Language
- en
- Open access
- gold
- doi.org
- Licence
- Locations
- PLoS ONE (publishedVersion, cc-by)
- PubMed Central (publishedVersion, cc-by)
- PubMed (publishedVersion)
- Research at the University of Copenhagen (University of Copenhagen) (publishedVersion, cc-by)
- Monash University Research Portal (Monash University) (submittedVersion, other-oa)
- Research Bank (Australian Catholic University) (submittedVersion, cc-by)
- RePEc: Research Papers in Economics (submittedVersion)
- DOAJ (DOAJ: Directory of Open Access Journals) (submittedVersion, cc-by-sa)
- University of Regensburg Publication Server (University of Regensburg) (submittedVersion)
- Figshare (submittedVersion, cc-by)
- Lund University Publications (Lund University) (submittedVersion)
- Funders
- Vetenskapsrådet (2011-2535)
- Topics
- Health Sciences › Medicine › Endocrinology, Diabetes and Metabolism › Hormonal and reproductive studies
- Life Sciences › Biochemistry, Genetics and Molecular Biology › Genetics › Genetic Associations and Epidemiology
- Health Sciences › Medicine › Reproductive Medicine › Sperm and Testicular Function
- Keywords
- obesity, serum testosterone, body mass index, men, causal relationship, weight loss, androgen deficiency, metabolic syndrome
- MeSH terms
- Adolescent, Adult, Aged, Humans, Male, Obesity, Phenotype, Testosterone, Body Mass Index, Genetic Predisposition to Disease, Polymorphism, Single Nucleotide, Young Adult, Mendelian Randomization Analysis
About these checks
Registry, retraction, Cites and statistics results are computed, not judged, with one exception: a printed reference that no index lists is read once by a model before it counts as a citation error. Claims are extracted by a model and kept only when their quote appears verbatim in the text; each cited source is then checked, with a model’s help, for whether it says what the claim relies on. Those verdicts can be wrong — read the claim’s quote and the cited source before relying on one.
A language model drew the claims from the paper on 2026-10-10, under version 3 of the claim definition (model deepseek-v4.1-flash, prompt extract-v3).
A second model labelled each claim on 2026-10-10 (model jev-1.13-20260917, definition revision gold-guideline-v0.2).
Statistics and arithmetic are recomputed, not judged.
Confidence bands are shown only for fields calibrated on our annotated test set. None is calibrated yet, so no band is shown.
What counts as a claim ›How we measure confidence ›How we check this ›
Are you an author, or do you see a problem with this page? Request a review
