

The DOI matches its Crossref record; 29 of the 29 references it cites were found in a registry or an index.
Optimal classifier for imbalanced data using Matthews Correlation Coefficient metric
Open accessAbstract
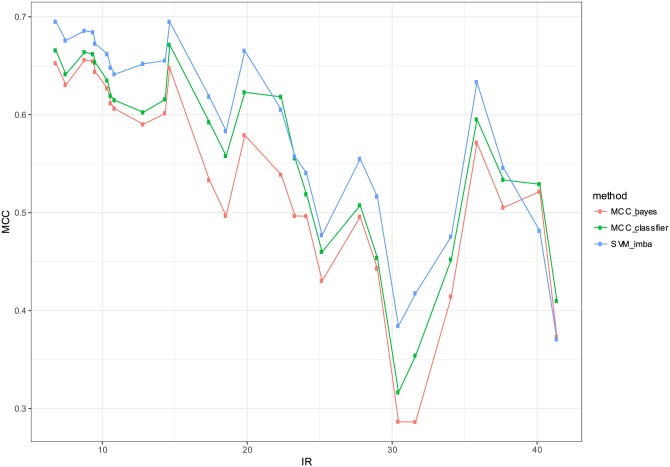
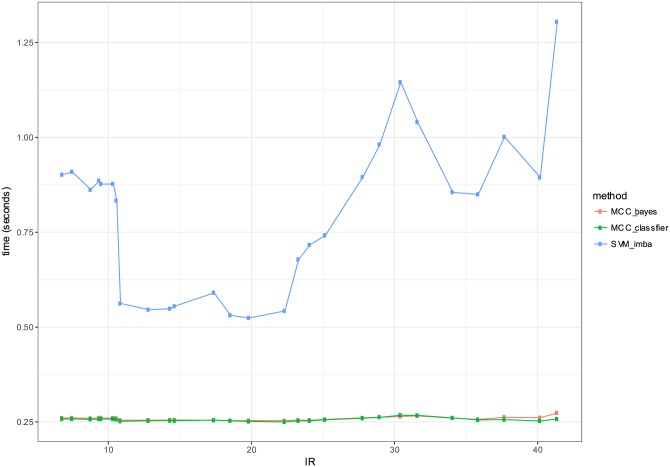
Data imbalance is frequently encountered in biomedical applications. Resampling techniques can be used in binary classification to tackle this issue. However such solutions are not desired when the number of samples in the small class is limited. Moreover the use of inadequate performance metrics, such as accuracy, lead to poor generalization results because the classifiers tend to predict the largest size class. One of the good approaches to deal with this issue is to optimize performance metrics that are designed to handle data imbalance. Matthews Correlation Coefficient (MCC) is widely used in Bioinformatics as a performance metric. We are interested in developing a new classifier based on the MCC metric to handle imbalanced data. We derive an optimal Bayes classifier for the MCC metric using an approach based on Frechet derivative. We show that the proposed algorithm has the nice theoretical property of consistency. Using simulated data, we verify the correctness of our optimality result by searching in the space of all possible binary classifiers. The proposed classifier is evaluated on 64 datasets from a wide range data imbalance. We compare both classification performance and CPU efficiency for three classifiers: 1) the proposed algorithm (MCC-classifier), the Bayes classifier with a default threshold (MCC-base) and imbalanced SVM (SVM-imba). The experimental evaluation shows that MCC-classifier has a close performance to SVM-imba while being simpler and more efficient.
Overview
The claims and statistics of this paper haven’t been checked yet.
Free: it reads the open-access text and checks the first 5 claims that cite a source we can check. Create a free account to check every claim.
Integrity signals
Registry
Cites
Statistics
Figures
Verification
Claims the paper makes
The claims and statistics of this paper haven’t been checked yet.
Free: it reads the open-access text and checks the first 5 claims that cite a source we can check. Create a free account to check every claim.
Claims other papers make about this one
Each is checked against this paper’s own text: does it say what the citing paper says it does?
The cited source says what the claim attributes to it.
In the citing paper
“since it has been shown to present a balanced score when dealing with imbalanced data [11, 6] as is our case with fewer manipulated images.”
From BioFors: A Large Biomedical Image Forensics Dataset (2021) · cites this paper as [6]
Self-check
Percentages, sums and reported differences re-computed from the paper’s own numbers.
The self-check needs the paper’s full text.
Citations
Cites
Advances in neural information processing systems 7
Cios, K., & Shields, M. (1997) · Neurocomputing · doi:10.1016/s0925-2312(97)90018-7 · Cited by 22,059
Comparison of the predicted and observed secondary structure of T4 phage lysozyme
Matthews, B. W. (1975) · Biochimica et Biophysica Acta (BBA) - Protein Structure · doi:10.1016/0005-2795(75)90109-9 · Cited by 5,399
A Probabilistic Theory of Pattern Recognition
Devroye, L., Györfi, L., & Lugosi, G. (1996) · Stochastic Modelling and Applied Probability · doi:10.1007/978-1-4612-0711-5 · Cited by 3,274
Assessing the accuracy of prediction algorithms for classification: an overview
Baldi, P., Brunak, S., Chauvin, Y., Andersen, C. A. F., & Nielsen, H. (2000) · Bioinformatics · doi:10.1093/bioinformatics/16.5.412 · Cited by 2,111
A sequential algorithm for training text classifiers
Lewis, D., & Gale, W. A. (1994) · arXiv (Cornell University) · doi:10.5555/188490.188495 · Cited by 1,731
A Sequential Algorithm for Training Text Classifiers
Lewis, D. D., & Gale, W. A. (1994) · SIGIR ’94 · doi:10.1007/978-1-4471-2099-5_1 · Cited by 1,208
Applying Support Vector Machines to Imbalanced Datasets
Akbani, R., Kwek, S., & Japkowicz, N. (2004) · Lecture Notes in Computer Science · doi:10.1007/978-3-540-30115-8_7 · Cited by 1,134
Yang, J., Roy, A., & Zhang, Y. (2013) · Bioinformatics · doi:10.1093/bioinformatics/btt447 · Cited by 1,035
MAQC Consortium (2010) · Nature Biotechnology · doi:10.1038/nbt.1665 · Cited by 889
Imbalanced Learning: Foundations, Algorithms, and Applications
(2013) · Wiley eBooks · doi:10.1002/9781118646106 · Cited by 831
Research works printed but not linked: 1
- R Akbani, 2004, Machine learning: ECML 2004, 39
Cited by
Chicco, D., & Jurman, G. (2020) · BMC Genomics · doi:10.1186/s12864-019-6413-7 · Cited by 6,143
Classification assessment methods
Tharwat, A. (2021) · Applied Computing and Informatics · doi:10.1016/j.aci.2018.08.003 · Cited by 2,417
“A coefficient of þ 1 indicates a perfect prediction, − 1 represents total disagreement between prediction and true values and zero means that no better than random prediction [16,3].”
BackgroundEvaluation metrics and statistical tests for machine learning
Rainio, O., Teuho, J., & Klén, R. (2024) · Scientific Reports · doi:10.1038/s41598-024-56706-x · Cited by 1,338
“· = = · = = Similarly, MCC can be computed from a general k × k confusion matrix with the formula 27 In the special case k = 2 , we obtain the same formulas for Cohen’s κ and MCC as in (2) and (3) 22 .”
MethodLuque, A., Carrasco, A., Martín, A., & de las Heras, A. (2019) · Pattern Recognition · doi:10.1016/j.patcog.2019.02.023 · Cited by 1,128
On evaluation metrics for medical applications of artificial intelligence
Hicks, S. A., Strümke, I., Thambawita, V., Hammou, M., Riegler, M. A., Halvorsen, P., & Parasa, S. (2022) · Scientific Reports · doi:10.1038/s41598-022-09954-8 · Cited by 934
Metadata
- Authors
- Boughorbel, S., Jarray, F., & El-Anbari, M.
- Affiliations
- Sidra Medical and Research Center (QA)
- Conservatoire National des Arts et Métiers (FR)
- Corresponding author
- Boughorbel, Sabri
- Venue
- PLOS ONE
- Publisher
- Public Library of Science (PLoS)
- Published
- 2017-06-02
- Volume
- 12
- Issue
- 6
- Pages
- e0177678
- ISSN
- 1932-6203 (ISSN-L)
- PMC
- PMC5456046
- OpenAlex
- W2620760558
- Cited by
- 1,222
- References
- 29
- Citations by year
- 2026: 90 · 2025: 104 · 2024: 111 · 2023: 163 · 2022: 179 · 2021: 224 · 2020: 165 · 2019: 120 · 2018: 64 · 2017: 2
- FWCI
- 57.24
- Type
- journal article
- Language
- en
- Open access
- gold
- doi.org
- Licence
- Locations
- PLoS ONE (publishedVersion, cc-by)
- Europe PMC (PubMed Central) (publishedVersion, cc-by)
- PubMed Central (publishedVersion, cc-by)
- PubMed (publishedVersion)
- RePEc: Research Papers in Economics (submittedVersion)
- DOAJ (DOAJ: Directory of Open Access Journals) (submittedVersion, cc-by-sa)
- Figshare (submittedVersion, cc-by)
- Funders
- Qatar Foundation
- Topics
- Physical Sciences › Computer Science › Artificial Intelligence › Imbalanced Data Classification Techniques
- Physical Sciences › Computer Science › Artificial Intelligence › Machine Learning and Data Classification
- Physical Sciences › Computer Science › Artificial Intelligence › Data Stream Mining Techniques
- Keywords
- class imbalance, Matthews correlation coefficient, Fréchet derivative, binary classification, biomedical classification
- MeSH terms
- Algorithms, Bayes Theorem, Models, Theoretical, Computational Biology, Support Vector Machine
About these checks
Registry, retraction, Cites and statistics results are computed, not judged, with one exception: a printed reference that no index lists is read once by a model before it counts as a citation error. Claims are extracted by a model and kept only when their quote appears verbatim in the text; each cited source is then checked, with a model’s help, for whether it says what the claim relies on. Those verdicts can be wrong — read the claim’s quote and the cited source before relying on one.
Statistics and arithmetic are recomputed, not judged.
Confidence bands are shown only for fields calibrated on our annotated test set. None is calibrated yet, so no band is shown.
What counts as a claim ›How we measure confidence ›How we check this ›
Are you an author, or do you see a problem with this page? Request a review
How to cite
Cite CoChat for the checks on this page, and the paper for its own findings.
- This page
- CoChat. (2026). Citation check: Optimal classifier for imbalanced data using Matthews Correlation Coefficient metric. https://app.cochat.ai/papers/10.1371/journal.pone.0177678
- The paper
- Boughorbel, S., Jarray, F., & El-Anbari, M. (2017). Optimal classifier for imbalanced data using Matthews Correlation Coefficient metric. PLOS ONE. https://doi.org/10.1371/journal.pone.0177678
Data sources
Bibliographic data: Semantic Scholar, OpenAlex, Crossref.
Contains information from the Semantic Scholar Academic Graph Datasets, made available under the ODC Attribution License (ODC-BY 1.0).
Semantic Scholar’s data is described in: Kinney, R., et al. (2023). The Semantic Scholar Open Data Platform. arXiv:2301.10140.
