

The DOI matches its Crossref record; 49 of the 49 references it cites were found in a registry or an index.
Increase in salivary oxytocin and decrease in salivary cortisol after listening to relaxing slow-tempo and exciting fast-tempo music
Open accessAbstract
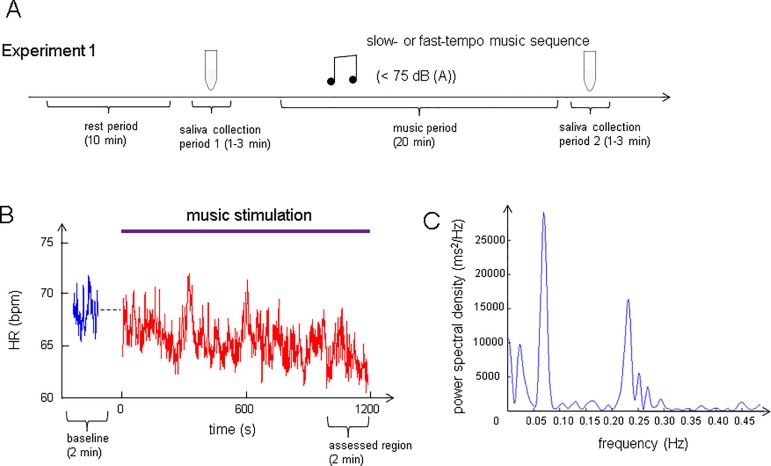
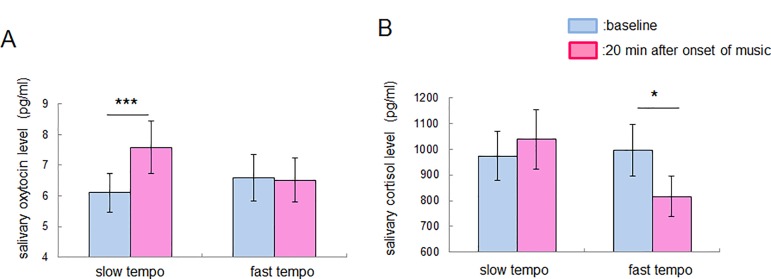
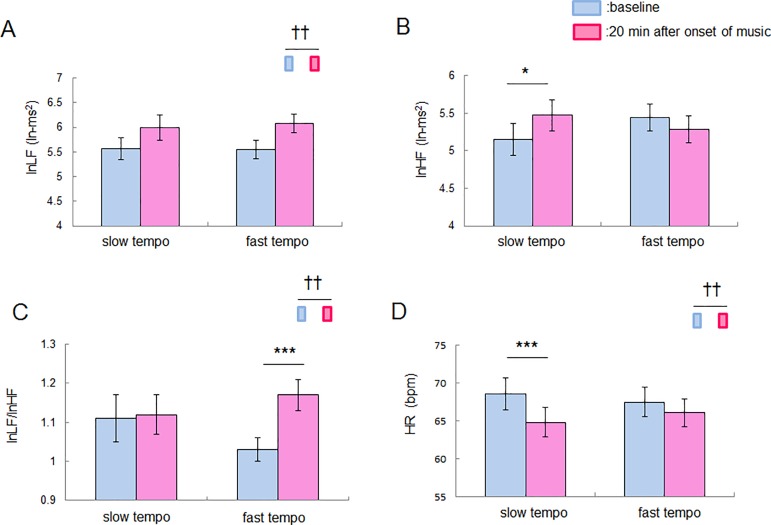
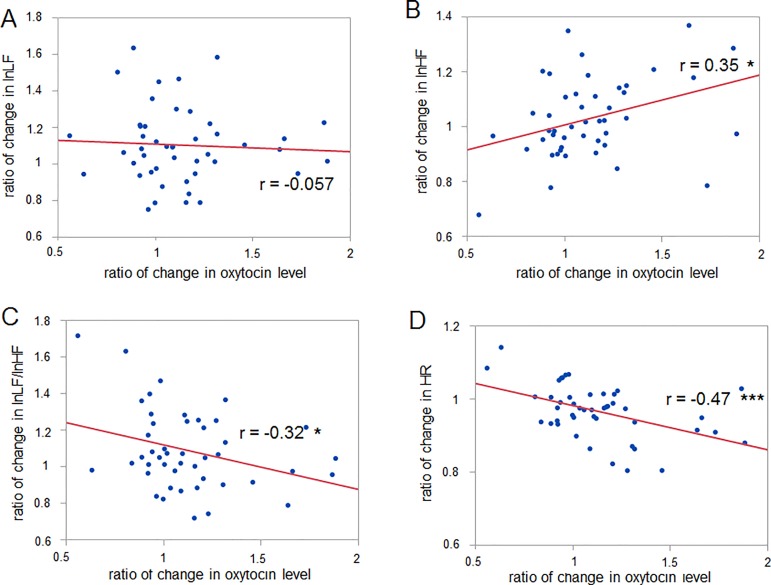
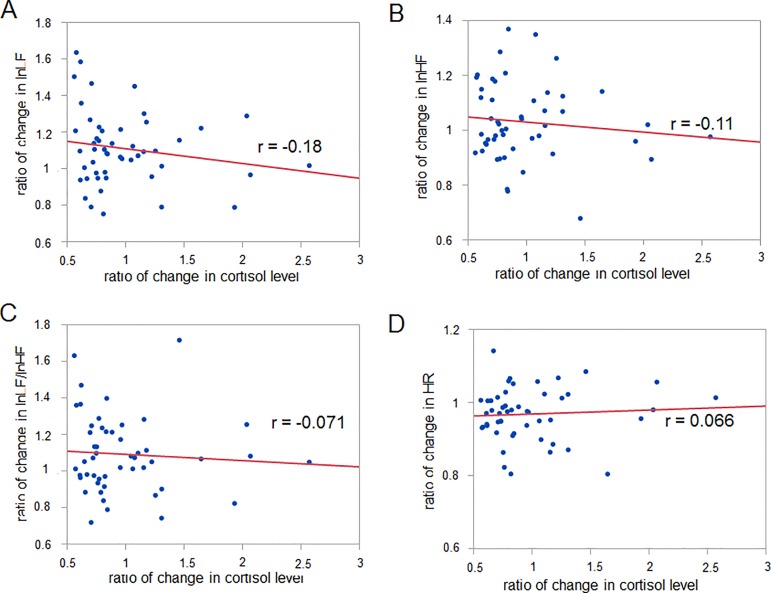
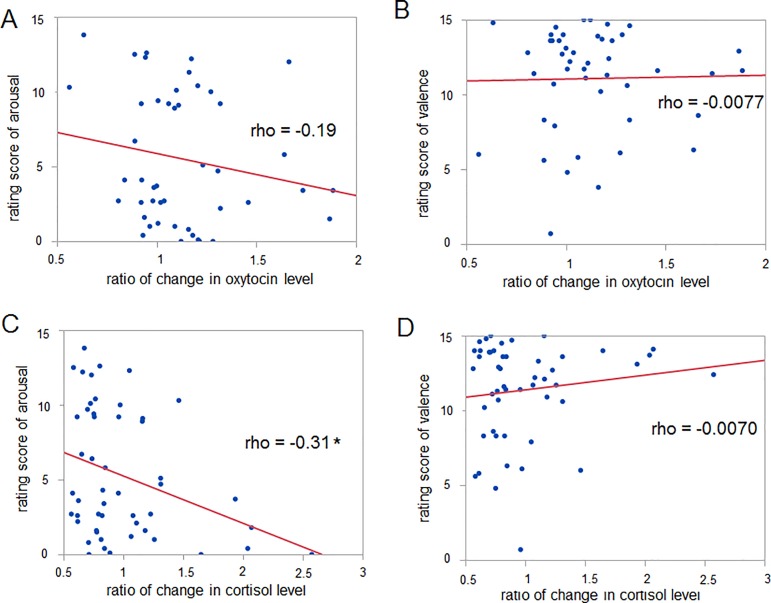
Relaxation and excitation are components of the effects of music listening. The tempo of music is often considered a critical factor when determining these effects: listening to slow-tempo and fast-tempo music elicits relaxation and excitation, respectively. However, the chemical bases that underlie these relaxation and excitation effects remain unclear. Since parasympathetic and sympathetic nerve activities are facilitated by oxytocin and glucocorticoid, respectively, we hypothesized that listening to relaxing slow-tempo and exciting fast-tempo music is accompanied by increases in the oxytocin and cortisol levels, respectively. We evaluated the change in the salivary oxytocin and cortisol levels of participants listening to slow-tempo and fast-tempo music sequences. We measured the heart rate (HR) and calculated the heart rate variability (HRV) to evaluate the strength of autonomic nerve activity. After listening to a music sequence, the participants rated their arousal and valence levels. We found that both the salivary oxytocin concentration and the high frequency component of the HRV (HF) increased and the HR decreased when a slow-tempo music sequence was presented. The salivary cortisol level decreased and the low frequency of the HRV (LF) to HF ratio (LF/HF) increased when a fast-tempo music sequence was presented. The ratio of the change in the oxytocin level was correlated with the change in HF, LF/HF and HR, whereas that in the cortisol level did not show any correlation with indices of autonomic nerve activity. There was no correlation between the change in oxytocin level and self-reported emotions, while the change in cortisol level correlated with the arousal level. These findings suggest that listening to slow-tempo and fast-tempo music is accompanied by an increase in the oxytocin level and a decrease in the cortisol level, respectively, and imply that such music listening-related changes in oxytocin and cortisol are involved in physiological relaxation and emotional excitation, respectively.
Overview
The claims and statistics of this paper haven’t been checked yet.
Free: it reads the open-access text and checks the first 5 claims that cite a source we can check. Create a free account to check every claim.
Integrity signals
Registry
Cites
Statistics
Figures
Verification
Claims the paper makes
The claims and statistics of this paper haven’t been checked yet.
Free: it reads the open-access text and checks the first 5 claims that cite a source we can check. Create a free account to check every claim.
Claims other papers make about this one
Each is checked against this paper’s own text: does it say what the citing paper says it does?
The cited source doesn’t support the claim as written.
In the citing paper
“The significant reduction of salivary cortisol levels is in line with other studies which investigated the impact of relaxation techniques on salivary cortisol levels also revealing a decline from before until after the intervention [64, 82].”
From The effects of a music and singing intervention during pregnancy on maternal well-being and mother-infant bonding: a randomised, controlled study. (2021) · cites this paper as [64]
Checked by a reasoning model — may be wrong.
Experimental — accuracy not yet measuredThe source backs part of the claim, not all of it — or backs it for a different population, condition or comparison.
In the citing paper
“Engaging in low-exertion social activities under low-stress conditions is conducive to OXT release since OXT is primarily involved in physiological relaxation rather than psychological relaxation (Ooishi et al., 2017).”
From Music's context-dependent influence on oxytocin, social bonding, and emotion regulation: a systematic review (2026) · cites this paper as Ooishi et al., 2017
Experimental — accuracy not yet measuredThe source backs part of the claim, not all of it — or backs it for a different population, condition or comparison.
In the citing paper
“Slow-tempo music is more likely to induce OXT release without inhibition by the HPA axis (Ooishi et al., 2017; Wulff et al., 2021), as it is usually perceived as more pleasant and relaxing (Ooishi et al., 2017).”
From Music's context-dependent influence on oxytocin, social bonding, and emotion regulation: a systematic review (2026) · cites this paper as Ooishi et al., 2017
Experimental — accuracy not yet measuredThe source backs part of the claim, not all of it — or backs it for a different population, condition or comparison.
In the citing paper
“Ooishi et al. (2017) confirmed OXT's responsiveness to stress signals, as evidenced by a significant time × tempo interaction effect in a music-listening task that manipulated arousal or stress levels via tempo.”
From Music's context-dependent influence on oxytocin, social bonding, and emotion regulation: a systematic review (2026) · cites this paper as Ooishi et al. (2017)
Experimental — accuracy not yet measuredThe source backs part of the claim, not all of it — or backs it for a different population, condition or comparison.
In the citing paper
“In addition, there were no significant correlations between the pre-post change of OXT and self-reported emotion, mood or stress scores (Fancourt et al., 2016; Ooishi et al., 2017).”
From Music's context-dependent influence on oxytocin, social bonding, and emotion regulation: a systematic review (2026) · cites this paper as Ooishi et al., 2017
Experimental — accuracy not yet measured
5 more claims about this paper
Create a free account to see every claim other papers make about this one.
Self-check
Percentages, sums and reported differences re-computed from the paper’s own numbers.
The self-check needs the paper’s full text.
Citations
Cites
Heart Rate Variability: Standards of Measurement, Physiological Interpretation, and Clinical Use
Electrophysiology, T. F. O. T. E. S. O. C. T. N. A. (1996) · Circulation · doi:10.1161/01.cir.93.5.1043 · Cited by 17,159
Heart rate variability: Standards of measurement, physiological interpretation, and clinical use
Malik, M., Bigger, J. T., Camm, A. J., Kleiger, R. E., Malliani, A., Moss, A. J., & Schwartz, P. J. (1996) · European Heart Journal · doi:10.1093/oxfordjournals.eurheartj.a014868 · Cited by 15,289
Assessment of autonomic function in humans by heart rate spectral analysis
Pomeranz, B., Macaulay, R. J., Caudill, M. A., Kutz, I., Adam, D., Gordon, D., Kilborn, K. M., Barger, A. C., Shannon, D. C., Cohen, R. J., et al. (1985) · American Journal of Physiology-Heart and Circulatory Physiology · doi:10.1152/ajpheart.1985.248.1.h151 · Cited by 2,876
Heinrichs, M., Baumgartner, T., Kirschbaum, C., & Ehlert, U. (2003) · Biological Psychiatry · doi:10.1016/s0006-3223(03)00465-7 · Cited by 2,091
Anatomically distinct dopamine release during anticipation and experience of peak emotion to music
Salimpoor, V. N., Benovoy, M., Larcher, K., Dagher, A., & Zatorre, R. J. (2011) · Nature Neuroscience · doi:10.1038/nn.2726 · Cited by 1,828
PORGES, S. W. (1995) · Psychophysiology · doi:10.1111/j.1469-8986.1995.tb01213.x · Cited by 1,624
Brain correlates of music-evoked emotions
Koelsch, S. (2014) · Nature Reviews Neuroscience · doi:10.1038/nrn3666 · Cited by 1,544
Chanda, M. L., & Levitin, D. J. (2013) · Trends in Cognitive Sciences · doi:10.1016/j.tics.2013.02.007 · Cited by 1,027
The Rewarding Aspects of Music Listening Are Related to Degree of Emotional Arousal
Salimpoor, V. N., Benovoy, M., Longo, G., Cooperstock, J. R., & Zatorre, R. J. (2009) · PLoS ONE · doi:10.1371/journal.pone.0007487 · Cited by 641
Cited by
Handbook of Religion and Health
Koenig, H. G., VanderWeele, T., & Peteet, J. R. (2024) · doi:10.1093/oso/9780190088859.001.0001 · Cited by 1,139
Effects of music in exercise and sport: A meta-analytic review.
Terry, P. C., Karageorghis, C. I., Curran, M. L., Martin, O. V., & Parsons-Smith, R. L. (2020) · Psychological Bulletin · doi:10.1037/bul0000216 · Cited by 443
“The lack of a generalized effect might be attributed, in part, to the effects of music on the functioning of the cardiorespiratory system independently of exercise-related tasks (see, e.g., Ooishi et al., 2017).”
BackgroundKirk, U., & Axelsen, J. L. (2020) · PLOS ONE · doi:10.1371/journal.pone.0243488 · Cited by 108
Wulff, V., Hepp, P., Wolf, O. T., Balan, P., Hagenbeck, C., Fehm, T., & Schaal, N. K. (2021) · Archives of gynecology and obstetrics · doi:10.1007/s00404-020-05727-8 · Cited by 101
Insular function in autism: Update and future directions in neuroimaging and interventions
Nomi, J. S., Molnar-Szakacs, I., & Uddin, L. Q. (2018) · Progress in Neuro-Psychopharmacology and Biological Psychiatry · doi:10.1016/j.pnpbp.2018.10.015 · Cited by 109
Metadata
- Authors
- Ooishi, Y., Mukai, H., Watanabe, K., Kawato, S., & Kashino, M.
- Affiliations
- NTT (Japan) (JP)
- Meiji University (JP)
- Tokyo Institute of Technology (JP)
- The University of Tokyo (JP)
- Corresponding author
- Ooishi, Yuuki
- Venue
- PLOS ONE
- Publisher
- Public Library of Science (PLoS)
- Published
- 2017-12-06
- Volume
- 12
- Issue
- 12
- Pages
- e0189075
- ISSN
- 1932-6203 (ISSN-L)
- PMC
- PMC5718605
- OpenAlex
- W2774091828
- Cited by
- 167
- References
- 49
- Citations by year
- 2026: 15 · 2025: 17 · 2024: 17 · 2023: 64 · 2022: 12 · 2021: 16 · 2020: 17 · 2019: 6 · 2018: 3
- FWCI
- 10.19
- Type
- journal article
- Language
- en
- Open access
- gold
- doi.org
- Licence
- Locations
- PLoS ONE (publishedVersion, cc-by)
- Europe PMC (PubMed Central) (publishedVersion, cc-by)
- PubMed Central (publishedVersion, cc-by)
- PubMed (publishedVersion)
- DOAJ (DOAJ: Directory of Open Access Journals) (submittedVersion, cc-by-sa)
- Figshare (submittedVersion, cc-by)
- Funders
- Core Research for Evolutional Science and Technology
- Topics
- Social Sciences › Psychology › Social Psychology › Music Therapy and Health
- Life Sciences › Neuroscience › Cognitive Neuroscience › Neuroscience and Music Perception
- Health Sciences › Medicine › Cardiology and Cardiovascular Medicine › Heart Rate Variability and Autonomic Control
- Keywords
- music tempo, salivary oxytocin, salivary cortisol, relaxation, emotional arousal, heart rate variability, autonomic nervous system, parasympathetic activity, sympathetic activity, emotional valence, music listening
- MeSH terms
- Adult, Chromatography, Liquid, Humans, Hydrocortisone, Male, Music, Oxytocin, Saliva, Tandem Mass Spectrometry, Young Adult
About these checks
Registry, retraction, Cites and statistics results are computed, not judged, with one exception: a printed reference that no index lists is read once by a model before it counts as a citation error. Claims are extracted by a model and kept only when their quote appears verbatim in the text; each cited source is then checked, with a model’s help, for whether it says what the claim relies on. Those verdicts can be wrong — read the claim’s quote and the cited source before relying on one.
Statistics and arithmetic are recomputed, not judged.
Confidence bands are shown only for fields calibrated on our annotated test set. None is calibrated yet, so no band is shown.
What counts as a claim ›How we measure confidence ›How we check this ›
Are you an author, or do you see a problem with this page? Request a review
How to cite
Cite CoChat for the checks on this page, and the paper for its own findings.
- This page
- CoChat. (2026). Citation check: Increase in salivary oxytocin and decrease in salivary cortisol after listening to relaxing slow-tempo and exciting fast-tempo music. https://app.cochat.ai/papers/10.1371/journal.pone.0189075
- The paper
- Ooishi, Y., Mukai, H., Watanabe, K., Kawato, S., & Kashino, M. (2017). Increase in salivary oxytocin and decrease in salivary cortisol after listening to relaxing slow-tempo and exciting fast-tempo music. PLOS ONE. https://doi.org/10.1371/journal.pone.0189075
Data sources
Bibliographic data: Semantic Scholar, OpenAlex, Crossref.
Contains information from the Semantic Scholar Academic Graph Datasets, made available under the ODC Attribution License (ODC-BY 1.0).
Semantic Scholar’s data is described in: Kinney, R., et al. (2023). The Semantic Scholar Open Data Platform. arXiv:2301.10140.
