

The DOI matches its Crossref record; 29 of the 31 references it cites were found in a registry or an index.
Increase in suicides the months after the death of Robin Williams in the US
Open accessAbstract
Investigating suicides following the death of Robin Williams, a beloved actor and comedian, on August 11th, 2014, we used time-series analysis to estimate the expected number of suicides during the months following Williams' death. Monthly suicide count data in the US (1999-2015) were from the Centers for Disease Control and Prevention Wide-ranging ONline Data for Epidemiologic Research (CDC WONDER). Expected suicides were calculated using a seasonal autoregressive integrated moving averages model to account for both the seasonal patterns and autoregression. Time-series models indicated that we would expect 16,849 suicides from August to December 2014; however, we observed 18,690 suicides in that period, suggesting an excess of 1,841 cases (9.85% increase). Although excess suicides were observed across gender and age groups, males and persons aged 30-44 had the greatest increase in excess suicide events. This study documents associations between Robin Williams' death and suicide deaths in the population thereafter.
Overview
The claims and statistics of this paper haven’t been checked yet.
Run the check — free, no account needed. It reads the open-access text and checks the sources it cites.
Integrity signals
Registry
Cites
Statistics
Figures
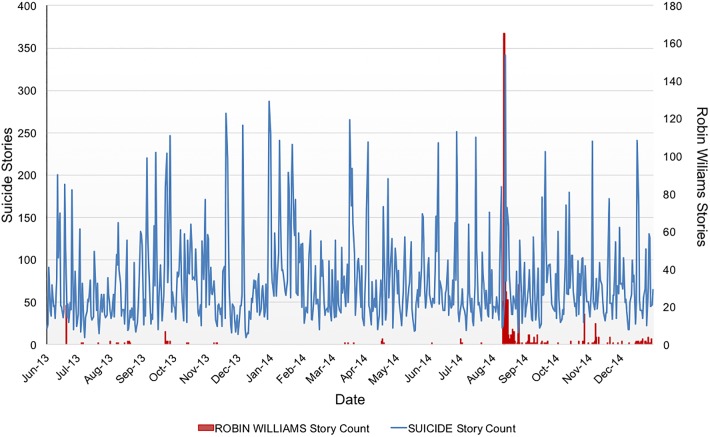
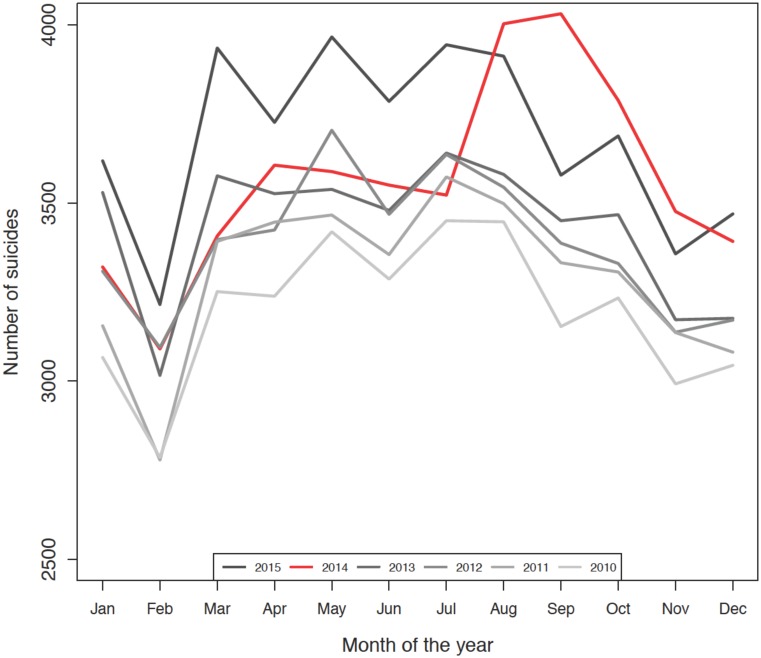
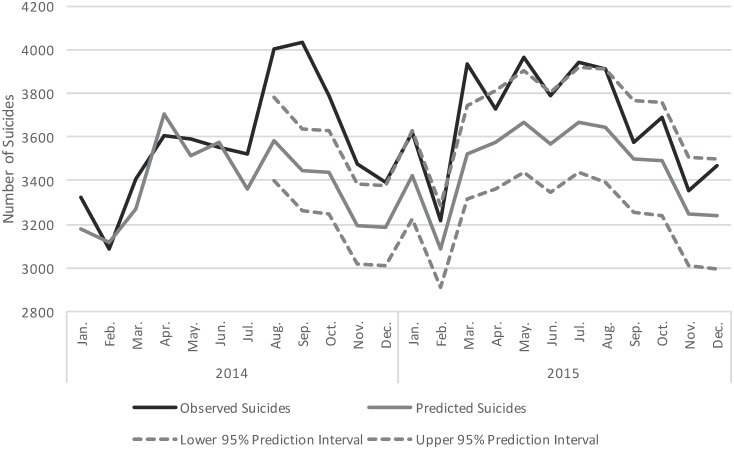
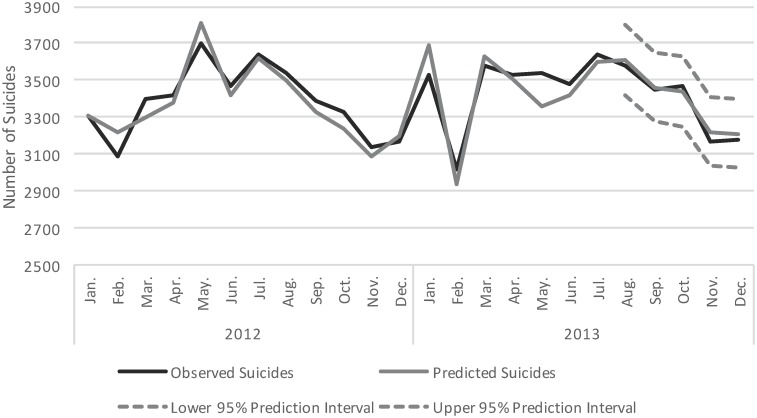
Verification
Claims the paper makes
The claims and statistics of this paper haven’t been checked yet.
Run the check — free, no account needed. It reads the open-access text and checks the sources it cites.
Claims other papers make about this one
Each is checked against this paper’s own text: does it say what the citing paper says it does?
The cited source says what the claim attributes to it.
In the citing paper
“Well-known is how suicide rates went up when Robin Williams completed suicide (Fink et al. 2018).”
From The realities of Medical Assistance in Dying in Canada (2023) · cites this paper as Fink et al. 2018
Self-check
Percentages, sums and reported differences re-computed from the paper’s own numbers.
The self-check needs the paper’s full text.
Citations
Cites
Self-efficacy: Toward a unifying theory of behavioral change
Bandura, A. (1977) · Psychological Review · doi:10.1037/0033-295x.84.2.191 · Cited by 43,925
Self-efficacy: Toward a unifying theory of behavioral change
Bandura, A. (1978) · Advances in Behaviour Research and Therapy · doi:10.1016/0146-6402(78)90002-4 · Cited by 10,586
Suicide Prevention Strategies: A Systematic Review
Mann, J. J., Apter, A., Bertolote, J., Beautrais, A., Currier, D., Haas, A., Hegerl, U., Lonnqvist, J., Malone, K., Marusic, A., et al. (2005) · JAMA · doi:10.1001/jama.294.16.2064 · Cited by 2,852
Time Series Analysis and Its Applications
Shumway, R. H., & Stoffer, D. S. (2010) · Springer texts in statistics · doi:10.1007/978-1-4419-7865-3 · Cited by 2,015
Phillips, D. P. (1974) · American Sociological Review · doi:10.2307/2094294 · Cited by 1,063
Role of media reports in completed and prevented suicide: Werther v. Papageno effects
Niederkrotenthaler, T., Voracek, M., Herberth, A., Till, B., Strauss, M., Etzersdorfer, E., Eisenwort, B., & Sonneck, G. (2010) · British Journal of Psychiatry · doi:10.1192/bjp.bp.109.074633 · Cited by 719
Wide-ranging Online Data for Epidemiologic Research (WONDER)
(2017) · Cited by 415
Media Roles in Suicide Prevention: A Systematic Review
Sisask, M., & Värnik, A. (2012) · International Journal of Environmental Research and Public Health · doi:10.3390/ijerph9010123 · Cited by 359
Suicide in the Media: A Quantitative Review of Studies Based on Nonfictional Stories
Stack, S. J. (2005) · Suicide and Life-Threatening Behavior · doi:10.1521/suli.35.2.121.62877 · Cited by 332
The Werther effect after television films: new evidence for an old hypothesis
Schmidtke, A., & Häfner, H. (1988) · Psychological Medicine · doi:10.1017/s0033291700008345 · Cited by 312
Cited by
Sorted by citations
Contributing factors to suicide: Political, social, cultural and economic
Stack, S. J. (2021) · Preventive Medicine · doi:10.1016/j.ypmed.2021.106498 · Cited by 224
Suicide and Suicide Risk in Adolescents
Hua, L. L., Lee, J., Rahmandar, M. H., Sigel, E. J., COMMITTEE ON ADOLESCENCE, & COUNCIL ON INJURY, V. (2024) · Pediatrics · doi:10.1542/peds.2023-064800 · Cited by 205
Bridge, J. A., Greenhouse, J. B., Ruch, D., Stevens, J., Ackerman, J., Sheftall, A. H., Horowitz, L. M., Kelleher, K. J., & Campo, J. V. (2020) · Journal of the American Academy of Child & Adolescent Psychiatry · doi:10.1016/j.jaac.2019.04.020 · Cited by 194
The Recent Rise of Suicide Mortality in the United States
Martínez‐Alés, G., Jiang, T., Keyes, K. M., & Gradus, J. L. (2021) · Annual Review of Public Health · doi:10.1146/annurev-publhealth-051920-123206 · Cited by 158
Self-citationThe Werther effect, the Papageno effect or no effect? A literature review
Domaradzki, J. (2021) · International Journal of Environmental Research and Public Health · doi:10.3390/ijerph18052396 · Cited by 119
Donovan, J., & boyd, D. (2019) · American Behavioral Scientist · doi:10.1177/0002764219878229 · Cited by 119
Niederkrotenthaler, T., Tran, U. S., Gould, M. S., Sinyor, M., Sumner, S. A., Strauss, M. J., Voracek, M., Till, B., Murphy, S. F., Gonzalez, F. R., et al. (2021) · BMJ · doi:10.1136/bmj-2021-067726 · Cited by 83
Media reporting of suicide and adherence to media guidelines
McTernan, N., Spillane, A., Cully, G., Cusack, E., O'Reilly, T., & Arensman, E. (2018) · International Journal of Social Psychiatry · doi:10.1177/0020764018784624 · Cited by 78
Barros, J. M., Melia, R., Francis, K., Bogue, J., O’Sullivan, M., Young, K. L., Bernert, R. A., Rebholz‐Schuhmann, D., & Duggan, J. (2019) · International Journal of Environmental Research and Public Health · doi:10.3390/ijerph16173201 · Cited by 75
The realities of Medical Assistance in Dying in Canada
Coelho, R., Maher, J., Gaind, K. S., & Lemmens, T. (2023) · Palliative and Supportive Care · doi:10.1017/s1478951523001025 · Cited by 70
“Well-known is how suicide rates went up when Robin Williams completed suicide (Fink et al. 2018).”
Restriction of access to means used for suicide
Hawton, K. E., Knipe, D. W., & Pirkis, J. (2024) · The Lancet Public Health · doi:10.1016/s2468-2667(24)00157-9 · Cited by 61
Martínez‐Alés, G., Hernández‐Calle, D., Khauli, N., & Keyes, K. M. (2020) · Current topics in behavioral neurosciences · doi:10.1007/7854_2020_158 · Cited by 59
Self-citationMedia coverage of Robin Williams’ suicide in the United States: A contributor to contagion?
Carmichael, V., & Whitley, R. (2019) · PLoS ONE · doi:10.1371/journal.pone.0216543 · Cited by 59
Jang, J., Myung, W., Kim, S., Han, M., Yook, V., Kim, E. J., & Jeon, H. J. (2022) · Australian & New Zealand Journal of Psychiatry · doi:10.1177/00048674211025701 · Cited by 46
Carmichael, V., & Whitley, R. (2018) · BMC Public Health · doi:10.1186/s12889-018-5987-3 · Cited by 44
Whitley, R., Fink, D. S., Santaella-Tenorio, J., & Keyes, K. M. (2019) · The Canadian Journal of Psychiatry · doi:10.1177/0706743719854073 · Cited by 44
Self-citationSuicides in Australia following media reports of the death of Robin Williams
Pirkis, J., Currier, D., Too, L. S., Bryant, M., Bartlett, S., Sinyor, M., & Spittal, M. J. (2019) · Australian & New Zealand Journal of Psychiatry · doi:10.1177/0004867419888297 · Cited by 40
Martínez‐Alés, G., & Keyes, K. M. (2019) · Current Psychiatry Reports · doi:10.1007/s11920-019-1080-6 · Cited by 38
Self-citationThe association between Twitter content and suicide
Sinyor, M., Williams, M., Zaheer, R., Loureiro, R., Pirkis, J., Heisel, M. J., Schaffer, A., Redelmeier, D. A., Cheung, A., & Niederkrotenthaler, T. (2020) · Australian & New Zealand Journal of Psychiatry · doi:10.1177/0004867420969805 · Cited by 35
Ochuku, B., Johnson, N. E., Osborn, T. L., Wasanga, C., & Ndetei, D. M. (2022) · Frontiers in Psychiatry · doi:10.3389/fpsyt.2022.1034206 · Cited by 34
Responses to mass shooting events
Croitoru, A., Kien, S., Mahabir, R., Radzikowski, J., Crooks, A. T., Schuchard, R., Begay, T., Lee, A., Bettios, A., & Stefanidis, A. (2020) · Criminology & Public Policy · doi:10.1111/1745-9133.12486 · Cited by 33
Kolliakou, A., Bakolis, I., Chandran, D., Derczynski, L., Werbeloff, N., Osborn, D., Bontcheva, K., & Stewart, R. J. (2020) · Scientific Reports · doi:10.1038/s41598-020-57835-9 · Cited by 31
Suicide by hanging: A scoping review
Sabrinskas, R., Hamilton, B. E., Daniel, C., & Oliffe, J. L. (2021) · International Journal of Mental Health Nursing · doi:10.1111/inm.12956 · Cited by 31
Hawley, L. L., Niederkrotenthaler, T., Zaheer, R., Schaffer, A., Redelmeier, D. A., LEVITT, A. J., Sareen, J., Pirkis, J., & Sinyor, M. (2022) · Australian & New Zealand Journal of Psychiatry · doi:10.1177/00048674221117072 · Cited by 31
Retired National Football League Players are Not at Greater Risk for Suicide
Iverson, G. L. (2019) · Archives of Clinical Neuropsychology · doi:10.1093/arclin/acz023 · Cited by 30
Adherence to suicide reporting guidelines by news shared on a social networking platform
Sumner, S. A., Burke, M., & Kooti, F. (2020) · Proceedings of the National Academy of Sciences · doi:10.1073/pnas.2001230117 · Cited by 29
Suicide and the Media: From Werther to Papageno Effects – A Selective Literature Review
Niederkrotenthaler, T., & Till, B. (2019) · Suicidologi/Nytt i suicidologi · doi:10.5617/suicidologi.7398 · Cited by 28
Quality of media reporting of suicide in Iraq
Arafat, S. M. Y., Ahmad, A. R., Saeed, A. K., Menon, V., Shoib, S., & Kar, S. K. (2021) · International Journal of Social Psychiatry · doi:10.1177/00207640211003928 · Cited by 28
The unknown denominator problem in population studies of disease frequency
Morrison, C. N., Rundle, A., Branas, C. C., Chihuri, S. T., Mehranbod, C. A., & Li, G. (2020) · Spatial and Spatio-temporal Epidemiology · doi:10.1016/j.sste.2020.100361 · Cited by 27
Suicides in Young People in Ontario Following the Release of “13 Reasons Why”
Sinyor, M., Williams, M., Tran, U. S., Schaffer, A., Kurdyak, P. A., Pirkis, J., & Niederkrotenthaler, T. (2019) · The Canadian Journal of Psychiatry · doi:10.1177/0706743719870507 · Cited by 27
Quality of media reporting following a celebrity suicide in India
Menon, V., Kar, S. K., Varadharajan, N., Kaliamoorthy, C., Pattnaik, J. I., Sharma, G., Mukherjee, S., Shirahatti, N. B., Ransing, R. S., Padhy, S. K., et al. (2020) · Journal of Public Health · doi:10.1093/pubmed/fdaa161 · Cited by 27
Menon, V., Mani, A. M., Kurian, N., Sahadevan, S., Sreekumar, S., Venu, S., Kar, S. K., & Arafat, S. M. Y. (2021) · Asian Journal of Psychiatry · doi:10.1016/j.ajp.2021.102647 · Cited by 24
Ng, Y. P., Pheh, K. S., Panirselvam, R. R., Chan, W. L., Lim, J. B. Y., Lim, J. T. Y., Leong, K. K., Bartlett, S., Tay, K. W., & Chan, L. F. (2021) · Frontiers in Psychology · doi:10.3389/fpsyg.2021.673287 · Cited by 23
Sy, K. T. L., Shaman, J. L., Kandula, S., Pei, S., Gould, M. S., & Keyes, K. M. (2019) · Social Psychiatry and Psychiatric Epidemiology · doi:10.1007/s00127-019-01736-4 · Cited by 23
Self-citationArendt, F., Haim, M., & Scherr, S. (2020) · Social Science & Medicine · doi:10.1016/j.socscimed.2019.112692 · Cited by 23
Gimbrone, C., Rutherford, C. G., Kandula, S., Martínez‐Alés, G., Shaman, J. L., Olfson, M., Gould, M. S., Pei, S., Galanti, M., & Keyes, K. M. (2021) · PLoS ONE · doi:10.1371/journal.pone.0260931 · Cited by 22
Self-citationMorral, A. R., Smart, R., Schell, T. L., Vegetabile, B., & Thomas, E. (2024) · JAMA Network Open · doi:10.1001/jamanetworkopen.2024.0562 · Cited by 21
Quantitative Methods to Detect Suicide and Self-Harm Clusters: A Systematic Review
Benson, R., Rigby, J., Brunsdon, C., Cully, G., Too, L. S., & Arensman, E. (2022) · International Journal of Environmental Research and Public Health · doi:10.3390/ijerph19095313 · Cited by 21
Sugg, M. M., Michael, K. D., Stevens, S. E., Filbin, R., Weiser, J., & Runkle, J. D. (2019) · Preventive Medicine Reports · doi:10.1016/j.pmedr.2019.100999 · Cited by 20
Suicide prevention is everyone's business: Challenges and opportunities for Google
Kirtley, O. J., & O’Connor, R. C. (2020) · Social Science & Medicine · doi:10.1016/j.socscimed.2019.112691 · Cited by 20
Walling, M. A. (2021) · Current Trauma Reports · doi:10.1007/s40719-021-00219-9 · Cited by 19
Gunn, J. F., Goldstein, S. E., & Lester, D. (2018) · Archives of Suicide Research · doi:10.1080/13811118.2018.1522284 · Cited by 19
Antebi, L., Carmichael, V., & Whitley, R. (2020) · The Canadian Journal of Psychiatry · doi:10.1177/0706743720936462 · Cited by 19
Suicide mortality in the United States following the suicides of Kate Spade and Anthony Bourdain
Sinyor, M., Tran, U. S., García, D., Till, B., Voracek, M., & Niederkrotenthaler, T. (2020) · Australian & New Zealand Journal of Psychiatry · doi:10.1177/0004867420976844 · Cited by 18
Quantifying suicide contagion at population scale
Shaman, J. L., Kandula, S., Pei, S., Galanti, M., Olfson, M., Gould, M. S., & Keyes, K. M. (2024) · Science Advances · doi:10.1126/sciadv.adq4074 · Cited by 17
Self-citationTill, B., & Niederkrotenthaler, T. (2019) · Psychotherapie Forum · doi:10.1007/s00729-019-00125-1 · Cited by 17
Menon, V., Arafat, S. M. Y., Akter, H., Mukherjee, S., Kar, S. K., & Padhy, S. K. (2020) · Asian Journal of Psychiatry · doi:10.1016/j.ajp.2020.102302 · Cited by 17
Guinovart, M., Cobo, J., González-Rodríguez, A., Parra, I., & Palao, D. J. (2023) · International Journal of Environmental Research and Public Health · doi:10.3390/ijerph20075270 · Cited by 16
Parrott, S. (2023) · Communication & Sport · doi:10.1177/21674795231187155 · Cited by 15
The Relationship Between Suicide-Related Twitter Events and Suicides in Ontario From 2015 to 2016
Sinyor, M., Williams, M., Zaheer, R., Loureiro, R., Pirkis, J., Heisel, M. J., Schaffer, A., Cheung, A., Redelmeier, D. A., & Niederkrotenthaler, T. (2020) · Crisis · doi:10.1027/0227-5910/a000684 · Cited by 15
Campo, J. V. (2020) · Journal of the American Academy of Child & Adolescent Psychiatry · doi:10.1016/j.jaac.2020.08.024 · Cited by 15
Sinyor, M., Ekstein, D., Prabaharan, N., Fıksenbaum, L., Vandermeer, C., Schaffer, A., Pirkis, J., Heisel, M. J., Goldstein, B. I., Redelmeier, D. A., et al. (2024) · The Canadian Journal of Psychiatry · doi:10.1177/07067437231223334 · Cited by 14
Psychological Aposematism: An Evolutionary Analysis of Suicide
Wiley, J. C. (2020) · Biological Theory · doi:10.1007/s13752-020-00353-8 · Cited by 14
Singh, R. K., Mahato, S., Khadka, S., Basnet, P., Bista, K., Karki, R., & Arafat, S. M. Y. (2022) · Health Science Reports · doi:10.1002/hsr2.547 · Cited by 14
Changes in Internet Suicide Search Volumes Following Celebrity Suicides
Ortiz, S. N., Forrest, L. N., Fisher, T. J., Hughes, M., & Smith, A. R. (2019) · Cyberpsychology Behavior and Social Networking · doi:10.1089/cyber.2018.0488 · Cited by 14
Ribeiro, E., & Granado, A. (2022) · Journalism Studies · doi:10.1080/1461670x.2022.2091642 · Cited by 13
Increases in Demand for Crisis and Other Suicide Prevention Services After a Celebrity Suicide
Ramchand, R., Cohen, E. A., Draper, J., Schoenbaum, M., Reidenberg, D. J., Colpe, L. J., Reed, J., & Pearson, J. L. (2019) · Psychiatric Services · doi:10.1176/appi.ps.201900007 · Cited by 13
Responsible reporting to prevent suicide contagion
Colman, I. (2018) · Canadian Medical Association Journal · doi:10.1503/cmaj.180900 · Cited by 13
Vuorio, A. F., Laukkala, T., Junttila, I., Bor, R. J., Budowle, B., Pukkala, ., Navathe, P. D., & Sajantila, A. (2018) · International Journal of Environmental Research and Public Health · doi:10.3390/ijerph15112525 · Cited by 13
Suicide and the agent–host–environment triad: leveraging surveillance sources to inform prevention
Keyes, K. M., Kandula, S., Olfson, M., Gould, M. S., Martínez‐Alés, G., Rutherford, C. G., & Shaman, J. L. (2021) · Psychological Medicine · doi:10.1017/s003329172000536x · Cited by 12
Self-citationScavacini, K. (2018) · Digital Library of Theses and Dissertations (Universidade de São Paulo) · doi:10.11606/t.47.2018.tde-26102018-155834 · Cited by 12
Sinyor, M., Niederkrotenthaler, T., & Pirkis, J. (2020) · New England Journal of Medicine · doi:10.1056/nejmc2002190 · Cited by 12
Izadi, N., Mitchell, R. H. B., Giacobbe, P., Nestor, S. M., Steinberg, R. J., Amini, J., Sinyor, M., & Schaffer, A. (2023) · FOCUS The Journal of Lifelong Learning in Psychiatry · doi:10.1176/appi.focus.20230011 · Cited by 11
Kar, S. K., Padhy, S. K., Bhoi, R., Pattnaik, J. I., & Menon, V. (2022) · Indian Journal of Psychiatry · doi:10.4103/indianjpsychiatry.indianjpsychiatry_398_21 · Cited by 11
Do Australian media apply recommendations when covering a suicide prevention campaign?
Thienel, R., Bryant, M., Hazel, G., Skehan, J., & Tynan, R. J. (2019) · Journal of Public Mental Health · doi:10.1108/jpmh-10-2018-0071 · Cited by 11
Marzano, L., Hawley, M., Fraser, L., Harris-Skillman, E., Lainez, Y., & Hawton, K. E. (2022) · Crisis · doi:10.1027/0227-5910/a000856 · Cited by 10
de la Salud, O. P. (2023) · doi:10.37774/9789275327791 · Cited by 10
Trinh, E. P., Ivey-Stephenson, A. Z., Ballesteros, M. F., Idaikkadar, N., Wang, J., & Stone, D. M. (2024) · MMWR Supplements · doi:10.15585/mmwr.su7302a2 · Cited by 10
Kar, S. K., Menon, V., Mukherjee, S., Bascarane, S., Sharma, G., Pattnaik, J. I., Ransing, R. S., Padhy, S. K., & Agarwal, V. (2021) · Journal of Public Health · doi:10.1093/pubmed/fdab378 · Cited by 10
The global impact of celebrity suicides: implications for prevention
Keyes, K. M., Whitley, R., Fink, D. S., Santaella-Tenorio, J., & Pirkis, J. (2021) · World Psychiatry · doi:10.1002/wps.20761 · Cited by 9
Self-citationKim, L.-H., Lee, G.-M., Lee, W.-R., & Yoo, K.-B. (2023) · BMC Public Health · doi:10.1186/s12889-023-16080-1 · Cited by 9
Copycats in Pilot Aircraft-Assisted Suicides after the Germanwings Incident
Laukkala, T., Vuorio, A. F., Bor, R. J., Budowle, B., Navathe, P. D., Pukkala, ., & Sajantila, A. (2018) · International Journal of Environmental Research and Public Health · doi:10.3390/ijerph15030491 · Cited by 9
Sinyor, M., Williams, M., & Niederkrotenthaler, T. (2019) · Australian & New Zealand Journal of Psychiatry · doi:10.1177/0004867419846390 · Cited by 9
Menon, V., Kar, S. K., Ransing, R. S., Sharma, G., Pattnaik, J. I., Kaliamoorthy, C., Varadharajan, N., Mukherjee, S., Agrawal, A., Padhy, S. K., et al. (2021) · Australian & New Zealand Journal of Psychiatry · doi:10.1177/00048674211009618 · Cited by 9
Lankford, A., & Silva, J. R. (2024) · Journal of Criminal Justice · doi:10.1016/j.jcrimjus.2024.102316 · Cited by 8
Lynn-Green, E. E., Jaźwińska, K., Beckman, A. L., & Latham, S. R. (2021) · Crisis · doi:10.1027/0227-5910/a000778 · Cited by 8
Arafat, S. M. Y., Ahmad, A. R., Saeed, A. K., Feizi, O., Saeed, F., Menon, V., Kar, S. K., & Shoib, S. (2022) · GLOBAL PSYCHIATRY ARCHIVES · doi:10.52095/gpa.2022.4883.1047 · Cited by 8
Campaign against living miserably: A look from social learning theory (SLT)
O’Leary, O., & Matusitz, J. (2024) · Journal of Human Behavior in the Social Environment · doi:10.1080/10911359.2024.2412099 · Cited by 7
Gould, M. S., Lake, A. M., Chowdhury, S. J., Noble, E., Keyes, K. M., Gimbrone, C., & Niederkrotenthaler, T. (2024) · Suicide and Life-Threatening Behavior · doi:10.1111/sltb.13047 · Cited by 7
Self-citationParks, P. (2019) · Journalism · doi:10.1177/1464884919841920 · Cited by 7
Veterans in the media: Assessing Canadian newspaper coverage of the Lionel Desmond murder-suicide
Whitley, R., & Carmichael, V. (2021) · Journal of Military Veteran and Family Health · doi:10.3138/jmvfh-2021-0060 · Cited by 7
Effectiveness of a Malaysian Media Intervention Workshop: Safe Reporting on Suicide
Lim, J. T. Y., Cheng, Q., Ng, Y. P., Pheh, K. S., Panirselvam, R. R., Tay, K. W., Lim, J. B. Y., Chan, W. L., Nordin, A. S. A., ZAKARIA, R. H., et al. (2021) · Frontiers in Psychology · doi:10.3389/fpsyg.2021.666027 · Cited by 7
Pitman, A., Fink, D. S., & Whitley, R. (2020) · Social Psychiatry and Psychiatric Epidemiology · doi:10.1007/s00127-021-02059-z · Cited by 7
Self-citationHatcher, S., Heisel, M. J., Ayonrinde, O., Campbell, J. K., Colman, I., Corsi, D. J., Edgar, N. E., Gillett, L., Kennedy, S. H., Hunt, S. L., et al. (2020) · Trials · doi:10.1186/s13063-020-04424-w · Cited by 6
de Julián, F. J. O., Díaz-Campo, J., & Segado‐Boj, F. (2021) · Doxa Comunicación Revista interdisciplinar de estudios de comunicación y ciencias sociales · doi:10.31921/doxacom.n32a3 · Cited by 6
Suicide and the media: reporting could cost lives
Gunnell, D., & Biddle, L. (2020) · BMJ · doi:10.1136/bmj.m870 · Cited by 6
Ribeiro, E., & Granado, A. (2024) · International Review of Psychiatry · doi:10.1080/09540261.2024.2327391 · Cited by 5
Calls to helplines in Australia following media reports of Robin Williams’ suicide
Pirkis, J., Currier, D., Too, L. S., Bryant, M., Bartlett, S., Sinyor, M., & Spittal, M. J. (2020) · Suicide and Life-Threatening Behavior · doi:10.1111/sltb.12661 · Cited by 5
The Impact of a Widely Publicized Celebrity Suicide on Suicide-Related Internet Search Activity
Myhre, M. Ø., & Walby, F. A. (2021) · Archives of Suicide Research · doi:10.1080/13811118.2021.1875942 · Cited by 5
Media coverage of Canadian Veterans, with a focus on post traumatic stress disorder and suicide
Whitley, R., & Saucier, A.-M. (2022) · BMC Psychiatry · doi:10.1186/s12888-022-03954-8 · Cited by 5
Ribeiro, E. (2021) · Observatorio (OBS*) · doi:10.15847/obsobs15120211683 · Cited by 4
Effects of Mass Shootings on Mental Illness Stigma in the United States
Beltzer, M., Moulder, R. G., Jr., Baker, C., Comer, K., & Teachman, B. A. (2022) · Personality and Social Psychology Bulletin · doi:10.1177/01461672221097180 · Cited by 4
Martín, P., Blasco, C. C., & Santos, G. C. (2024) · Palabra Clave · doi:10.5294/pacla.2024.27.3.1 · Cited by 3
Williams, C. L., Gauthier, J. M., & Witte, T. K. (2020) · Archives of Suicide Research · doi:10.1080/13811118.2020.1715905 · Cited by 3
Cobertura gráfica e informativa de accidentes y suicidios en la prensa digital española
de Julián, F. J. O., & Segado‐Boj, F. (2020) · INDEX COMUNICACIÓN · doi:10.33732/ixc/10/01cobert · Cited by 3
Content Notice: Guidelines to Discuss Suicide on Social Media.
Engelson, B. J., Bernstein, S. A., Moutier, C. Y., & Gold, J. A. (2023) · PubMed Central · Cited by 3
Reporting on Suicide: An Examination of Suicide Coverage by U.S. Student Newspapers
Kocan, S., & Parrott, S. (2023) · Journalism & Mass Communication Educator · doi:10.1177/10776958231165109 · Cited by 3
Broncano-Rivera, K., Contreras-Pizarro, C. H., & Valle, R. (2023) · Revista Peruana de Medicina Experimental y Salud Pública · doi:10.17843/rpmesp.2023.403.12776 · Cited by 3
Hedman-Robertson, A. S., & Sage, S. K. (2020) · Crisis · doi:10.1027/0227-5910/a000734 · Cited by 3
Mestas, M., & Arendt, F. (2021) · Health Communication · doi:10.1080/10410236.2021.1961972 · Cited by 3
Metadata
- Authors
- Fink, D. S., Santaella-Tenorio, J., & Keyes, K. M.
- Affiliations
- Columbia University (US)
- Corresponding author
- Fink, David S.
- Venue
- PLOS ONE
- Publisher
- Public Library of Science (PLoS)
- Published
- 2018-02-07
- Volume
- 13
- Issue
- 2
- Pages
- e0191405
- ISSN
- 1932-6203 (ISSN-L)
- PMC
- PMC5802858
- OpenAlex
- W2785475303
- Cited by
- 156
- References
- 31
- Citations by year
- 2026: 4 · 2025: 22 · 2024: 15 · 2023: 14 · 2022: 14 · 2021: 31 · 2020: 28 · 2019: 21 · 2018: 7
- FWCI
- 25.56
- Type
- journal article
- Language
- en
- Open access
- gold
- doi.org
- Licence
- Locations
- PLoS ONE (publishedVersion, cc-by)
- PubMed Central (publishedVersion, cc-by)
- PubMed (publishedVersion)
- RePEc: Research Papers in Economics (submittedVersion)
- DOAJ (DOAJ: Directory of Open Access Journals) (submittedVersion, cc-by-sa)
- Columbia Academic Commons (Columbia University)
- Funders
- National Institute on Drug Abuse (T32DA031099)
- Topics
- Social Sciences › Psychology › Clinical Psychology › Suicide and Self-Harm Studies
- Social Sciences › Sociology and Political Science › Homicide, Infanticide, and Child Abuse
- Social Sciences › Health › Gun Ownership and Violence Research
- Keywords
- Robin Williams, celebrity death, suicide, excess mortality, celebrity influence, public figures, suicide rates, seasonal patterns, gender differences, age groups
- MeSH terms
- Adolescent, Adult, Child, Drama, Famous Persons, Female, Humans, Male, Middle Aged, Suicide, United States, Incidence, Young Adult
About these checks
Registry, retraction, Cites and statistics results are computed, not judged, with one exception: a printed reference that no index lists is read once by a model before it counts as a citation error. Claims are extracted by a model and kept only when their quote appears verbatim in the text; each cited source is then checked, with a model’s help, for whether it says what the claim relies on. Those verdicts can be wrong — read the claim’s quote and the cited source before relying on one.
Statistics and arithmetic are recomputed, not judged.
Confidence bands are shown only for fields calibrated on our annotated test set. None is calibrated yet, so no band is shown.
What counts as a claim ›How we measure confidence ›How we check this ›
Are you an author, or do you see a problem with this page? Request a review
