

The DOI matches its Crossref record; 56 of the 57 references it cites were found in a registry or an index, and 1 are not checked yet.
Combined impact of pesticides and other environmental stressors on animal diversity in irrigation ponds
Open accessPublished version of a preprint
Abstract
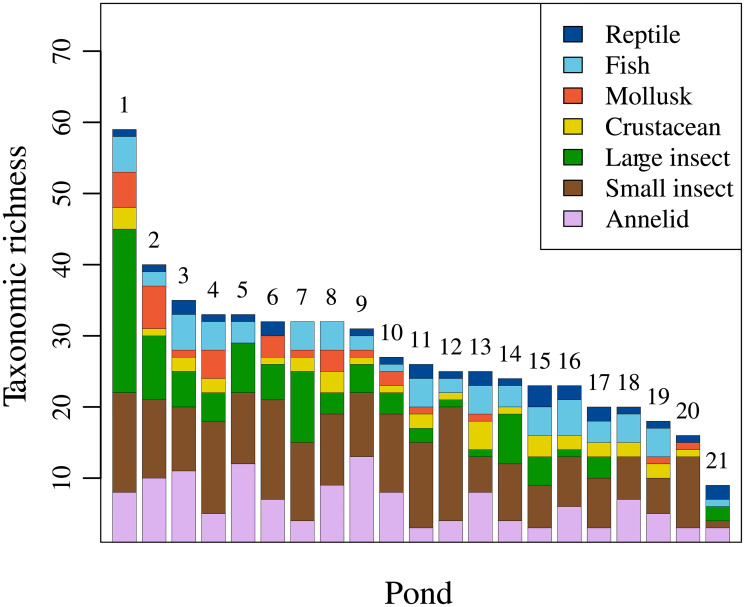
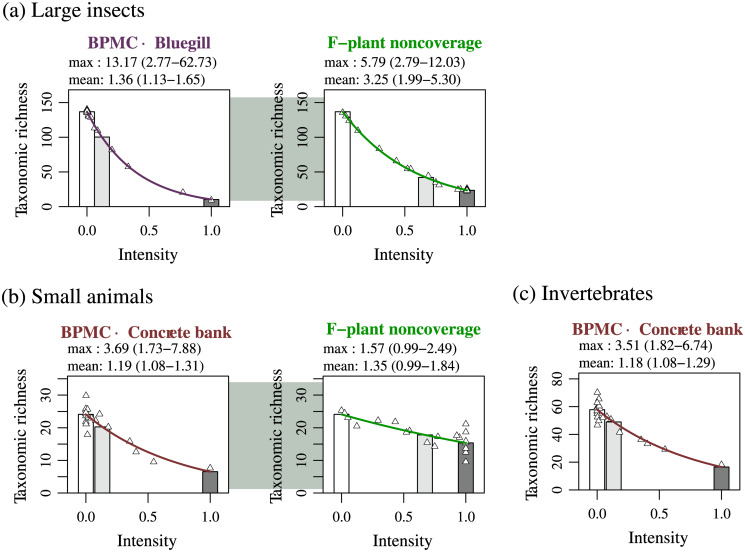
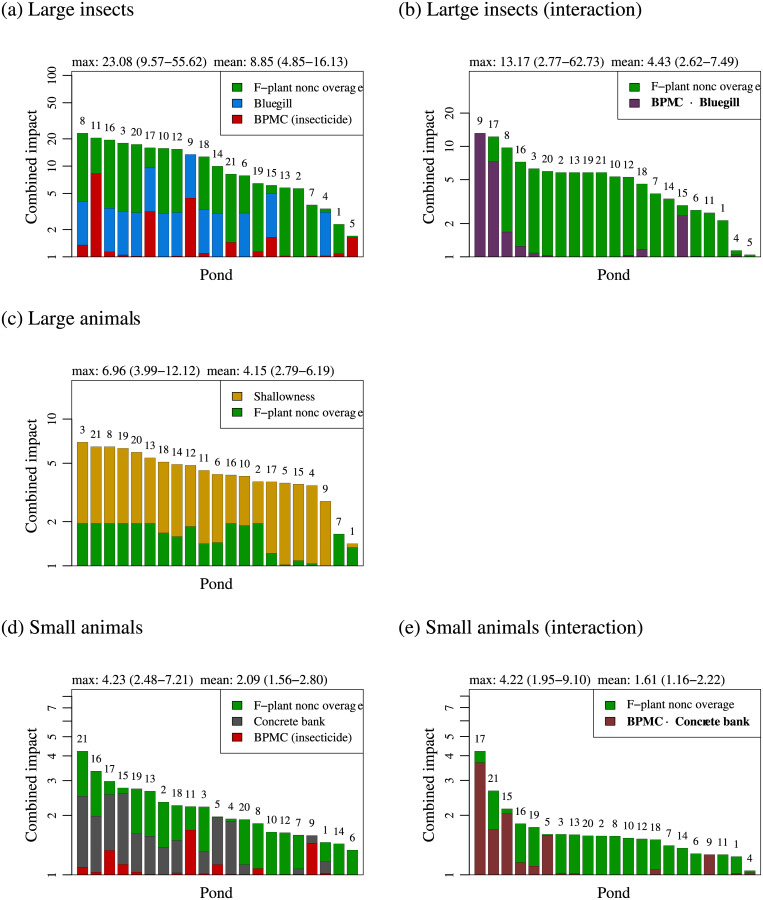
Rice paddy irrigation ponds can sustain surprisingly high taxonomic richness and make significant contributions to regional biodiversity. We evaluated the impacts of pesticides and other environmental stressors (including eutrophication, decreased macrophyte coverage, physical habitat destruction, and invasive alien species) on the taxonomic richness of freshwater animals in 21 irrigation ponds in Japan. We sampled a wide range of freshwater animals (reptiles, amphibians, fishes, mollusks, crustaceans, insects, annelids, bryozoans, and sponges) and surveyed environmental variables related to pesticide contamination and other stressors listed above. Statistical analyses comprised contraction of highly correlated environmental variables, best-subset model selection, stepwise model selection, and permutation tests. Results showed that: (i) probenazole (fungicide) was a significant stressor on fish (i.e., contamination with this compound had a significantly negative correlation with fish taxonomic richness), (ii) the interaction of BPMC (insecticide; also known as fenobucarb) and bluegill (invasive alien fish) was a significant stressor on a "large insect" category (Coleoptera, Ephemeroptera, Hemiptera, Lepidoptera, Odonata, and Trichoptera), (iii) the interaction of BPMC and concrete bank protection was a significant stressor on an "invertebrate" category, (iv) the combined impacts of BPMC and the other stressors on the invertebrate and large insect categories resulted in an estimated mean loss of taxonomic richness by 15% and 77%, respectively, in comparison with a hypothetical pond with preferable conditions.
Overview
The claims and statistics of this paper haven’t been checked yet.
Run the check — free, no account needed. It reads the open-access text and checks the sources it cites.
Integrity signals
Registry
Cites
Statistics
Figures

Verification
Claims the paper makes
The claims and statistics of this paper haven’t been checked yet.
Run the check — free, no account needed. It reads the open-access text and checks the sources it cites.
Claims other papers make about this one
Each is checked against this paper’s own text: does it say what the citing paper says it does?
The source backs part of the claim, not all of it — or backs it for a different population, condition or comparison.
In the citing paper
“Pesticide pollution in freshwaters also represents a long-term persistent issue (Ito et al. 2020), yet quantifying concentrations remains challenging due to high spatiotemporal variability, limitations of instrument availability, and difficultly in identifying new/emerging chemicals (Lorenz et al. 2017).”
From Pond ecology and conservation: research priorities and knowledge gaps (2021) · cites this paper as Ito et al. 2020
Experimental — accuracy not yet measured
Self-check
Percentages, sums and reported differences re-computed from the paper’s own numbers.
The self-check needs the paper’s full text.
Citations
Cites
The value of the world's ecosystem services and natural capital
Costanza, R., d'Arge, R., de Groot, R., Farber, S., Grasso, M., Hannon, B., Limburg, K., Naeem, S., O'Neill, R. V., Paruelo, J., et al. (1997) · Nature · doi:10.1038/387253a0 · Cited by 22,585
Information Theory and an Extension of the Maximum Likelihood Principle
Akaike, H. (1998) · Springer series in statistics · doi:10.1007/978-1-4612-1694-0_15 · Cited by 18,591
Freshwater biodiversity: importance, threats, status and conservation challenges
Dudgeon, D., Arthington, A. H., Gessner, M. O., Kawabata, Z., Knowler, D. J., Lévêque, C., Naiman, R. J., Prieur‐Richard, A., Soto, D., Stiassny, M. L. J., et al. (2006) · Biological Reviews · doi:10.1017/s1464793105006950 · Cited by 8,489
Biodiversity loss and its impact on humanity
Cardinale, B. J., Duffy, J. E., Gonzalez, A., Hooper, D. U., Perrings, C., Venail, P., Narwani, A., Mace, G. M., Tilman, D., Wardle, D. A., et al. (2012) · Nature · doi:10.1038/nature11148 · Cited by 7,457 · cited 1×
“Because the loss of biodiversity tends to exponentially reduce the efficiencies and temporal stabilities of ecosystem functions [8], the current rapid biodiversity loss in freshwater ecosystems implies that they are degrading at a critical rate.”
Emerging threats and persistent conservation challenges for freshwater biodiversity
Reid, A. J., Carlson, A. K., Creed, I. F., Eliason, E. J., Gell, P. A., Johnson, P. T. J., Kidd, K. A., MacCormack, T. J., Olden, J. D., Ormerod, S. J., et al. (2019) · Biological Reviews · doi:10.1111/brv.12480 · Cited by 3,645
The value of the world's ecosystem services and natural capital
Costanza, R., d’Arge, R. C., de Groot, R. S., Farber, S., Grasso, M., Hannon, B. M., Limburg, K. E., Naeem, S., O’Neill, R. V., Paruelo, J. M., et al. (1998) · Ecological Economics · doi:10.1016/s0921-8009(98)00020-2 · Cited by 2,989
Extinction Rates of North American Freshwater Fauna
Ricciardi, A. P., & Rasmussen, J. B. (1999) · Conservation Biology · doi:10.1046/j.1523-1739.1999.98380.x · Cited by 1,328
Freshwater Biomonitoring and Benthic Macroinvertebrates
Harper, D. M., Rosenberg, D. A., & Resh, V. H. (1994) · Journal of Applied Ecology · doi:10.2307/2404174 · Cited by 1,324
Net effects of multiple stressors in freshwater ecosystems: a meta‐analysis
Jackson, M. C., Loewen, C. J. G., Vinebrooke, R. D., & Chimimba, C. T. (2015) · Global Change Biology · doi:10.1111/gcb.13028 · Cited by 946
Pesticides reduce regional biodiversity of stream invertebrates
Beketov, M. A., Kefford, B. J., Schäfer, R. B., & Liess, M. (2013) · Proceedings of the National Academy of Sciences · doi:10.1073/pnas.1305618110 · Cited by 924
Research works printed but not linked: 10
- AP Covich, 2004, Sustaining Biodiversity and Ecosystem Services in Soil and Sediments, 45
- K Kawano, 2006, Aquatic insects in the ponds of Hirata Area (Izumo City) in Shimane Prefecture (in Japanese), Japanese Bulletin of Hoshizaki Green Foundation, 9, 13
- A Iitomi, 2002, Dominant pests and their damage to water shield in Akita (in Japanese), Annual Report of the Society of Plant Protection of North Japan, 53, 256
- N Takamura, 2007, Biodiversity monitoring: collaboration to build capacity for ecosystem management (in Japanese), 49
- H. Tsunoda, 2017, Ecological impacts of pond losses and abandonments on regional aquatic biodiversity: What will happen in the depopulating Japan? (in Japanese), Wildlife and Human Society, 5, 5
- P Kennedy, 2003, A Guide to Econometrics
- M Kitagawa, 1983, Entropy statistics (in Japanese)
- N Choudhury, 2018, Ecotoxicology of aquatic system: a review on fungicide-induced toxicity in fishes, Progress in Aqua Farming and Marine Biology, 1, 180001
- T Nakashima, 1996, Fate of pesticides aerially sprayed on paddy fields in river water (in Japanese), Journal of Environmental Laboratories Association, 21, 81
- M Sakai, 2013, Investigation of pesticides in the Tsurumi River (April 2011–March 2012) (in Japanese), Annual Reports of the Institute of Yokohama-city Environmental Science, 37, 13
Cited by
Sorted by citations
Pond ecology and conservation: research priorities and knowledge gaps
Hill, M. J., Greaves, H. M., Sayer, C. D., Hassall, C., Milin, M., Milner, V. S., Marazzi, L., Hall, R., Harper, L. R., Thornhill, I., et al. (2021) · Ecosphere · doi:10.1002/ecs2.3853 · Cited by 156
“Pesticide pollution in freshwaters also represents a long-term persistent issue (Ito et al. 2020), yet quantifying concentrations remains challenging due to high spatiotemporal variability, limitations of instrument availability, and difficultly in identifying new/emerging chemicals (Lorenz et al.…”
BackgroundThe complexity of global change and its effects on insects
Yang, L. H., Postema, E. G., Hayes, T., Lippey, M. K., & MacArthur‐Waltz, D. J. (2021) · Current Opinion in Insect Science · doi:10.1016/j.cois.2021.05.001 · Cited by 62
Duffus, N., Echeverri, A., Dempewolf, L., Noriega, J. A., Furumo, P. R., & Morimoto, J. (2023) · Neotropical Entomology · doi:10.1007/s13744-023-01031-7 · Cited by 62
Gupta, R., Malik, P., Rani, R., Solanki, R., Ameta, R. K., Malik, V., & Mukherjee, T. K. (2024) · Plant Nano Biology · doi:10.1016/j.plana.2024.100073 · Cited by 57
Fehlinger, L., Misteli, B., Morant, D., Juvigny‐Khenafou, N. P. D., Cunillera‐Montcusí, D., Chaguaceda, F., Stamenković, O., Fahy, J. C., Kolář, V., Halabowski, D., et al. (2022) · Inland Waters · doi:10.1080/20442041.2022.2111180 · Cited by 48
Metadata
- Authors
- Ito, H. C., Shiraishi, H., Nakagawa, M., & Takamura, N.
- Affiliations
- National Institute for Environmental Studies (JP)
- Corresponding author
- Ito, Hiroshi C.
- Venue
- PLOS ONE
- Publisher
- Public Library of Science (PLoS)
- Published
- 2020-07-02
- Volume
- 15
- Issue
- 7
- Pages
- e0229052
- ISSN
- 1932-6203 (ISSN-L)
- PMC
- PMC7332035
- OpenAlex
- W3040065177
- Cited by
- 42
- References
- 56
- Citations by year
- 2026: 6 · 2025: 11 · 2024: 5 · 2023: 8 · 2022: 5 · 2021: 7
- FWCI
- 2.00
- Type
- journal article
- Language
- en
- Open access
- gold
- doi.org
- Licence
- Locations
- PLoS ONE (publishedVersion, cc-by)
- bioRxiv (Cold Spring Harbor Laboratory) (acceptedVersion, cc-by)
- PubMed Central (publishedVersion, cc-by)
- PubMed (publishedVersion)
- DOAJ (DOAJ: Directory of Open Access Journals) (submittedVersion, cc-by-sa)
- Topics
- Physical Sciences › Environmental Science › Health, Toxicology and Mutagenesis › Environmental Toxicology and Ecotoxicology
- Physical Sciences › Environmental Science › Pollution › Pesticide and Herbicide Environmental Studies
- Physical Sciences › Environmental Science › Ecology › Freshwater macroinvertebrate diversity and ecology
- Keywords
- pesticide contamination, irrigation ponds, paddy fields, freshwater biodiversity, taxonomic richness, probenazole, fenobucarb, bluegill, invasive alien fish, eutrophication, habitat loss, combined stress, insecticides, fungicides, invertebrates, freshwater fauna
- MeSH terms
- Animals, Carbamates, Environmental Monitoring, Invertebrates, Pesticides, Thiazoles, Vertebrates, Ecosystem, Biodiversity, Introduced Species, Ponds
About these checks
Registry, retraction, Cites and statistics results are computed, not judged, with one exception: a printed reference that no index lists is read once by a model before it counts as a citation error. Claims are extracted by a model and kept only when their quote appears verbatim in the text; each cited source is then checked, with a model’s help, for whether it says what the claim relies on. Those verdicts can be wrong — read the claim’s quote and the cited source before relying on one.
Statistics and arithmetic are recomputed, not judged.
Confidence bands are shown only for fields calibrated on our annotated test set. None is calibrated yet, so no band is shown.
What counts as a claim ›How we measure confidence ›How we check this ›
Are you an author, or do you see a problem with this page? Request a review
