

The DOI matches its Crossref record; 1 of the 1 references it cites were found in a registry or an index.
Predicting corporate credit risk: Network contagion via trade credit
Open accessAbstract
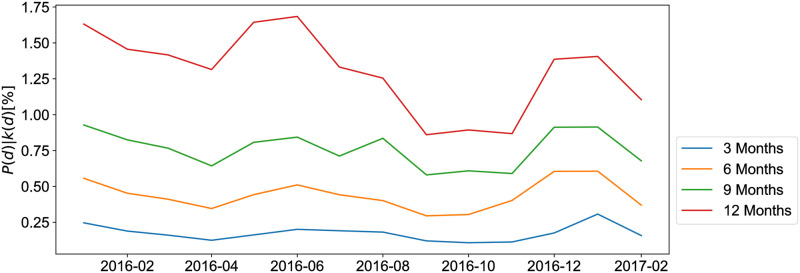
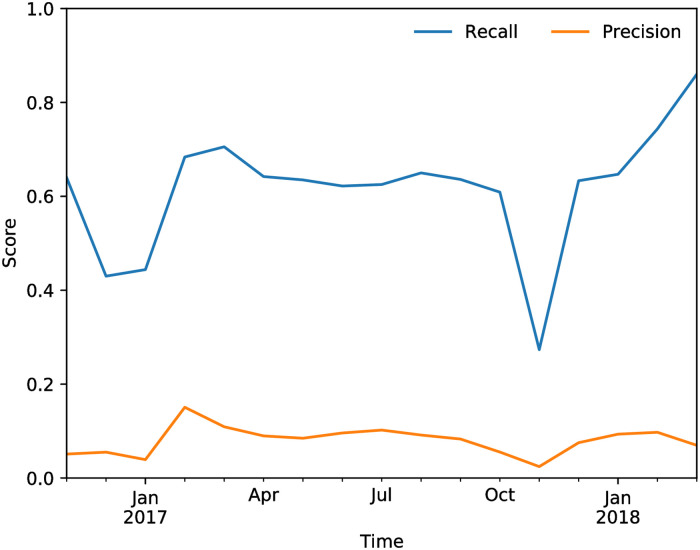
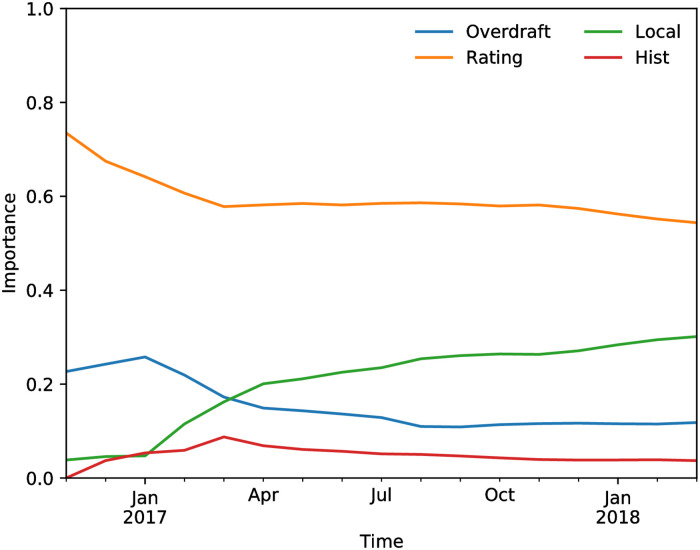
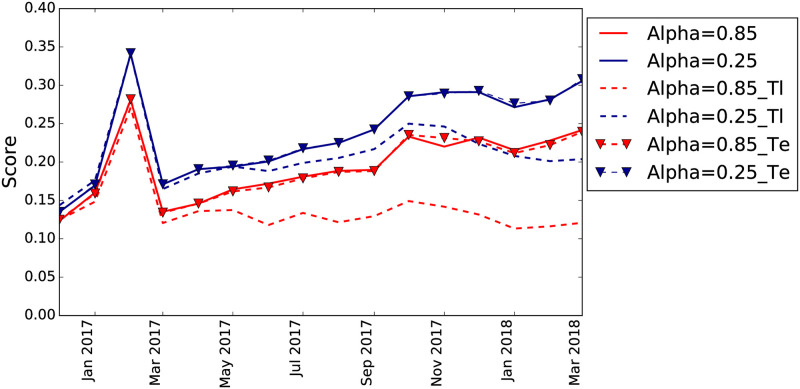
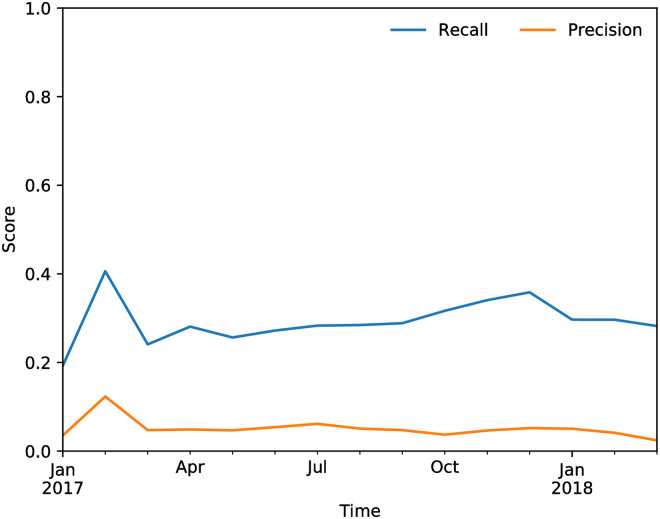
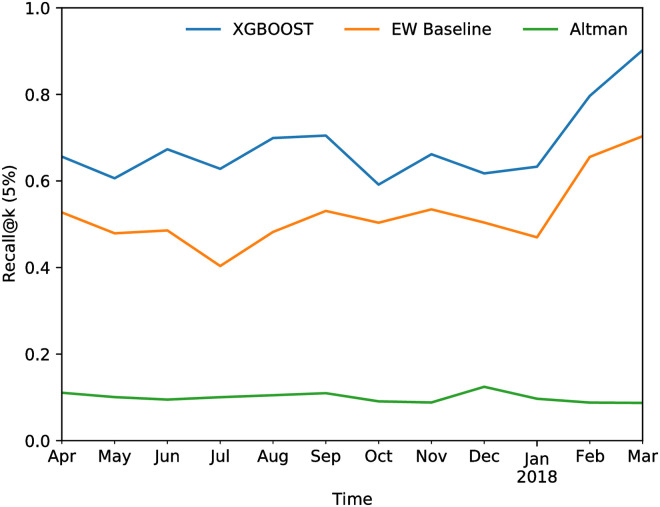
Trade credit is a payment extension granted by a selling firm to its customer. Companies typically respond to late payments from their customers by delaying payments to suppliers, thus generating a ripple through the transaction network. Therefore, trade credit is as a potential vehicle of propagation of losses in case of default events. The goal of this work is to leverage information on the trade credit among connected firms to predict imminent defaults of firms. We use a unique dataset of client firms of a major Italian bank to investigate firm bankruptcy between October 2016 to March 2018. We develop a model to capture network spillover effects originating from the supply chain on the probability of default of each firm via a sequential approach: the output of a first model component on single firm features is used in a subsequent model which captures network spillovers. While the first component is the standard econometrics way to predict such dynamics, the network module represents an innovative way to look into the effect of trade credit on default probability. This module looks at the transaction network of the firm, as inferred from the payments transiting via the bank, in order to identify the trade partners of the firm. By using several features extracted from the network of transactions, this model is able to predict a large fraction of the defaults, thus showing the value hidden in the network information. Finally, we merge firm and network features with a machine learning model to create a ‘hybrid’ model, which improves the recall for the task by almost 20 percentage points over the baseline.
Overview
The claims and statistics of this paper haven’t been checked yet.
Run the check — free, no account needed. It reads the open-access text and checks the sources it cites.
Integrity signals
Registry
Cites
Statistics
Figures
Verification
Claims the paper makes
The claims and statistics of this paper haven’t been checked yet.
Run the check — free, no account needed. It reads the open-access text and checks the sources it cites.
Self-check
Percentages, sums and reported differences re-computed from the paper’s own numbers.
The self-check needs the paper’s full text.
Citations
Cites
McCullagh, P., & Nelder, J. A. (2019) · doi:10.1201/9780203753736 · Cited by 1,013
Research works printed but not linked: 63
- BS Wilner, 2000, The exploitation of relationships in financial distress: The case of trade credit, The Journal of Finance, 55, 153, 10.1111/0022-1082.00203 · DOI
- R Fisman, 2003, Trade Credit, Financial Intermediary Development, and Industry Growth, The Journal of Finance, 58, 353, 10.1111/1540-6261.00527 · DOI · Paper page
- I Love, 2007, Trade credit and bank credit: Evidence from recent financial crises, Journal of Financial Economics, 83, 453, 10.1016/j.jfineco.2005.11.002 · DOI
- V Cuñat, 2007, Trade Credit: Suppliers as Debt Collectors and Insurance Providers, Review of Financial Studies, 20, 491, 10.1093/rfs/hhl015 · DOI
- G McGuinness, 2018, European trade credit use and SME survival, Journal of Corporate Finance, 49, 81, 10.1016/j.jcorpfin.2017.12.005 · DOI
- I Love, 2010, Trade Credit, Bank Credit and Financial Crisis, International Review of Finance, 10, 125, 10.1111/j.1468-2443.2009.01100.x · DOI
- A Ferrando, 2013, Do firms use the trade credit channel to manage growth?, Journal of Banking & Finance, 37, 3035, 10.1016/j.jbankfin.2013.02.013 · DOI
- E Casey, 2014, Bank lending constraints, trade credit and alternative financing during the financial crisis: Evidence from European SMEs, Journal of Corporate Finance, 27, 173, 10.1016/j.jcorpfin.2014.05.001 · DOI
- E Garcia-Appendini, 2013, Firms as liquidity providers: Evidence from the 2007–2008 financial crisis, Journal of Financial Economics, 109, 272, 10.1016/j.jfineco.2013.02.010 · DOI
- E Garcia-Appendini, 2014, Trade credit use as firms approach default: A supplier’s hold-up story, 1411
- S Carbó-Valverde, 2009, Bank Market Power and SME Financing Constraints, Review of Finance, 13, 309, 10.1093/rof/rfp003 · DOI
- S Carbó-Valverde, 2016, Trade Credit, the Financial Crisis, and SME Access to Finance, Journal of Money, Credit and Banking, 48, 113, 10.1111/jmcb.12292 · DOI
- MJ Palacín-Sánchez, 2018, Trade credit versus bank credit: a simultaneous analysis in European SMEs, Small Business Economics
- M Petersen, 1997, Trade Credit: Theories and Evidence, Review of Financial Studies, 10, 661, 10.1093/rfs/10.3.661 · DOI · Paper page
- J Nilsen, 2002, Trade Credit and the Bank Lending Channel, Journal of Money, Credit and Banking, 34, 226, 10.1353/mcb.2002.0032 · DOI
- N Kiyotaki, 1997, Edinburgh School of Economics
- M Cardoso-Lecourtois, 2004, Chain Reactions, Trade Credit and the Business Cycle, 331
- C Raddatz, 2010, Credit Chains and Sectoral Comovement: Does the Use of Trade Credit Amplify Sectoral Shocks?, The Review of Economics and Statistics, 92, 985, 10.1162/REST_a_00042 · DOI
- X Gabaix, 2011, The Granular Origins of Aggregate Fluctuations, Econometrica, 79, 733, 10.3982/ECTA8769 · DOI
- F Allen, 2000, Financial Contagion, Journal of Political Economy, 108, 1, 10.1086/262109 · DOI
- S Battiston, 2007, Credit chains and bankruptcy propagation in production networks, Journal of Economic Dynamics and Control, 31, 2061, 10.1016/j.jedc.2007.01.004 · DOI
- N Golo, 2015, Too dynamic to fail: empirical support for an autocatalytic model of Minsky’s financial instability hypothesis, Journal of Economic Interaction and Coordination, 1
- T Jacobson, 2015, Trade Credit and the Propagation of Corporate Failure: An Empirical Analysis, Econometrica, 83, 1315, 10.3982/ECTA12148 · DOI
- TR Hurd, 2016, Contagion! Systemic Risk in Financial Networks, 10.1007/978-3-319-33930-6 · DOI
- D Petrone, 2018, A dynamic approach merging network theory and credit risk techniques to assess systemic risk in financial networks, Scientific Reports, 8, 10.1038/s41598-018-23689-5 · DOI
- Y Ohsawa, 2006, Chance discoveries in real world decision making: data-based interaction of human intelligence and artificial intelligence, 10.1007/978-3-540-34353-0 · DOI
- JH Thun, 2011, An empirical analysis of supply chain risk management in the German automotive industry, International journal of production economics, 131, 242, 10.1016/j.ijpe.2009.10.010 · DOI
- F Boissay, 2006, Credit chains and the propagation of financial distress, 573
- J Evans, 2007, Surviving chapter 11: Why small firms prefer supplier financing, Journal of Economics and Finance, 31, 186, 10.1007/BF02751642 · DOI
- M Hertzel, 2008, Inter-firm linkages and the wealth effects of financial distress along the supply chain, Journal of Financial Economics, 87, 374, 10.1016/j.jfineco.2007.01.005 · DOI
- Boissay F, Gropp R. Trade credit defaults and liquidity provision by firms. ECB working paper; 2007. · DOI
- P Jurion, 2009, Credit Contagion from Counterparty Risk, The Journal of Finance, 64, 2053, 10.1111/j.1540-6261.2009.01494.x · DOI
- F Boissay, 2013, Payment Defaults and Interfirm Liquidity Provision, Review of Finance, 17, 1853, 10.1093/rof/rfs045 · DOI
- T Jacobson, 2013, Firm Default and Aggregate Fluctuations, Journal of the European Economic Association, 11, 945, 10.1111/jeea.12020 · DOI
- N Amberg, 2016, Curbing Shocks to Corporate Liquidity: The Role of Trade Credit, 320, 10.3386/w22286 · DOI
- M Lamieri, 2019, The propagation of liquidity imbalances in manufacturing supply chains: evidence from a spatial auto-regressive approach, The European Journal of Finance, 25, 1377, 10.1080/1351847X.2019.1596962 · DOI
- Kaluðer I, Klepac G. Credit Risk Early Warning System using Fuzzy Expert Systems. In: Central European Conference on Information and Intelligent Systems; 2014. p. 250.
- Gd Blasio, 2005, Does trade credit substitute bank credit? Evidence from firm-level data, Economic notes, 34, 85, 10.1111/j.0391-5026.2005.00145.x · DOI
- P Finaldi Russo, 2004, The use of trade credit in Italy: how important are the financial motives?, Bank of Italy Working Papers Collection, 496
- Tamura K, Miura W, Takayasu M, Takayasu H, Kitajima S, Goto H. Estimation of flux between interacting nodes on huge inter-firm networks. In: International Journal of Modern Physics: Conference Series. vol. 16. World Scientific; 2012. p. 93–104. · DOI
- S Ongena, 2000, What determines the number of bank relationships? Cross-country evidence, Journal of Financial intermediation, 9, 26, 10.1006/jfin.1999.0273 · DOI
- HB Newcombe, 1959, Automatic linkage of vital records, Science, 130, 954, 10.1126/science.130.3381.954 · DOI
- EI Altman, 1968, Financial ratios, discriminant analysis and the prediction of corporate bankruptcy, Journal of Finance, 23, 589, 10.1111/j.1540-6261.1968.tb00843.x · DOI · Paper page
- M Crouhy, 2000, A comparative analysis of current credit risk models, Journal of Banking & Finance, 24, 59, 10.1016/S0378-4266(99)00053-9 · DOI
- Y Wang, 2009, Structural Credit Risk Modeling: Merton and Beyond, Risk Management, 16
- RC Merton, 1974, On the pricing of corporate debt: the risk structure of interest rates, The Journal of Finance, 29, 449
- N Tarashev, 2008, An Empirical Evaluation of Structural Credit-Risk Models, International Journal of Central Banking, 4, 1
- R F, 2000, Risk Management, 141
- EI Altman, 1997, Credit risk measurement: Developments over the last 20 years, Journal of Banking & Finance, 21, 1721, 10.1016/S0378-4266(97)00036-8 · DOI
- S Devi, 2018, A Survey on Machine Learning and Statistical Techniques in Bankruptcy Prediction, International Journal of Machine Learning and Computing, 8, 133, 10.18178/ijmlc.2018.8.2.676 · DOI
- B Erdogan, 2012, Prediction of bankruptcy using support vector machines: An application to bank bankruptcy, Journal of Statistical Computation and Simulation—J STAT COMPUT SIM, 83, 1
- S Cho, 2010, A hybrid approach based on the combination of variable selection using decision trees and case-based reasoning using the Mahalanobis distance: For bankruptcy prediction, Expert Systems with Applications, 37, 3482, 10.1016/j.eswa.2009.10.040 · DOI
- KS Shin, 2002, A genetic algorithm application in bankruptcy prediction modeling, Expert Systems with Applications, 23, 321, 10.1016/S0957-4174(02)00051-9 · DOI
- SH Min, 2006, Hybrid genetic algorithms and support vector machines for bankruptcy prediction, Expert Systems with Applications, 31, 652, 10.1016/j.eswa.2005.09.070 · DOI
- AS Koyuncugil, 2012, Financial early warning system model and data mining application for risk detection, Expert Systems with Applications, 39, 6238, 10.1016/j.eswa.2011.12.021 · DOI
- G Du, 2021, Application of innovative risk early warning mode under big data technology in Internet credit financial risk assessment, Journal of Computational and Applied Mathematics, 386, 113260, 10.1016/j.cam.2020.113260 · DOI
- RJ Hyndman, 2019, Forecasting: principles and practice
- L Breiman, 2001, Random forests, Machine learning, 45, 5, 10.1023/A:1010933404324 · DOI · Paper page
- Bifet A, De Francisci Morales G, Read J, Holmes G, Pfahringer B. Efficient Online Evaluation of Big Data Stream Classifiers. In: KDD’15: 21th ACM International Conference on Knowledge Discovery and Data Mining; 2015. p. 59–68. · DOI
- L Page, 1998, The PageRank citation ranking: Bringing order to the Web
- Bogdanov P, Singh A. Accurate and scalable nearest neighbors in large networks based on effective importance. In: Proceedings of the 22nd ACM international conference on Conference on information & knowledge management. ACM; 2013. p. 1009–1018. · DOI
- B Schölkopf, 2002, Learning with kernels: support vector machines, regularization, optimization, and beyond
- Chen T, Guestrin C. Xgboost: A scalable tree boosting system. In: Proceedings of the 22nd acm sigkdd international conference on knowledge discovery and data mining. ACM; 2016. p. 785–794. · DOI · Paper page
Metadata
- Authors
- Berloco, C., De Francisci Morales, G., Frassineti, D., Greco, G., Kumarasinghe, H., Lamieri, M., Massaro, E., Miola, A., & Yang, S.
- Affiliations
- Intesa Sanpaolo (Italy) (IT)
- Novartis (Spain) (ES)
- Institute for Scientific Interchange (IT)
- Corresponding author
- Berloco, Claudia
- Lamieri, Marco
- ORCID
- Venue
- PLOS ONE
- Publisher
- Public Library of Science (PLoS)
- Published
- 2021-04-29
- Volume
- 16
- Issue
- 4
- Pages
- e0250115
- ISSN
- 1932-6203 (ISSN-L)
- PMC
- PMC8084139
- OpenAlex
- W3159623064
- Cited by
- 22
- References
- 1
- Citations by year
- 2026: 2 · 2025: 4 · 2024: 5 · 2023: 4 · 2022: 6 · 2021: 1
- FWCI
- 6.71
- Type
- journal article
- Language
- en
- Open access
- gold
- doi.org
- Licence
- Locations
- PLoS ONE (publishedVersion, cc-by)
- PubMed Central (publishedVersion, cc-by)
- PubMed (publishedVersion)
- BOA (University of Milano-Bicocca) (submittedVersion, cc-by)
- RePEc: Research Papers in Economics (submittedVersion)
- DOAJ (DOAJ: Directory of Open Access Journals) (submittedVersion, cc-by-sa)
- Institutional Research Information System University of Turin (University of Turin) (submittedVersion)
- Funders
- Intesa Sanpaolo Innovation Center
- Topics
- Social Sciences › Business, Management and Accounting › Accounting › Financial Distress and Bankruptcy Prediction
- Social Sciences › Business, Management and Accounting › Accounting › Working Capital and Financial Performance
- Social Sciences › Economics, Econometrics and Finance › Finance › Banking stability, regulation, efficiency
- Keywords
- trade credit, corporate credit risk, default prediction, network contagion, supply chain, transaction networks, bankruptcy prediction, hybrid machine learning, Italian firms
- MeSH terms
- Machine Learning, Commerce, Financial Management, Forecasting, Humans, Probability, Professional Corporations, Bankruptcy, Models, Economic
About these checks
Registry, retraction, Cites and statistics results are computed, not judged, with one exception: a printed reference that no index lists is read once by a model before it counts as a citation error. Claims are extracted by a model and kept only when their quote appears verbatim in the text; each cited source is then checked, with a model’s help, for whether it says what the claim relies on. Those verdicts can be wrong — read the claim’s quote and the cited source before relying on one.
Statistics and arithmetic are recomputed, not judged.
Confidence bands are shown only for fields calibrated on our annotated test set. None is calibrated yet, so no band is shown.
What counts as a claim ›How we measure confidence ›How we check this ›
Are you an author, or do you see a problem with this page? Request a review
