

The DOI matches its Crossref record; 40 of the 40 references it cites were found in a registry or an index; none of the 15 sources its claims cite is checked for support yet.
How sharing is the “sharing economy”? Evidence from 97 Airbnb markets
Open accessAbstract
Digital platforms such as Airbnb have become a major economic and political force in recent years, presenting themselves as a “sharing economy”–a new, more just way of organizing social and economic activity–while functioning as owners and managers of proprietary markets. These platforms have in recent years been subject to variegated but growing regulations, begging questions of how these affect their platform markets. This paper examines these claims by a large-scale international comparative analysis of the revenue distribution of Airbnb markets in 97 cities and regions, focusing on the level and evolution of revenue inequality, and estimating the racial and gender revenue gaps by using machine learning classification of host profile pictures. Examining 834,722 listings, 513,785 hosts, and 13,466,854 reviews, the paper finds an average Gini coefficient of 0.68, implying that a majority of the market revenue tends to go to about 10% of the hosts. The level of centralization varies significantly across cities, but is consistently growing over time, with government regulation appearing as a counteracting factor, which however only temporarily slows down the growing dominance of a small minority of large-scale hosts. The paper furthermore finds large gender and race revenue gaps, as Black hosts receive on average 22% less revenue for their listings, and women an average of 12% less. These findings contribute important data to ongoing academic and policy debates, as well as a starting point for further research on inequality in the sharing economy, and how it can be regulated.
Overview
CoChat Summary
TL;DR
Analyzing 97 Airbnb markets, this paper finds the platform is highly unequal and increasingly centralized, contradicting “sharing economy” claims. It reports an average Gini coefficient of 0.68, with Black hosts receiving 22% less revenue and women 12% less on average.
Key findings
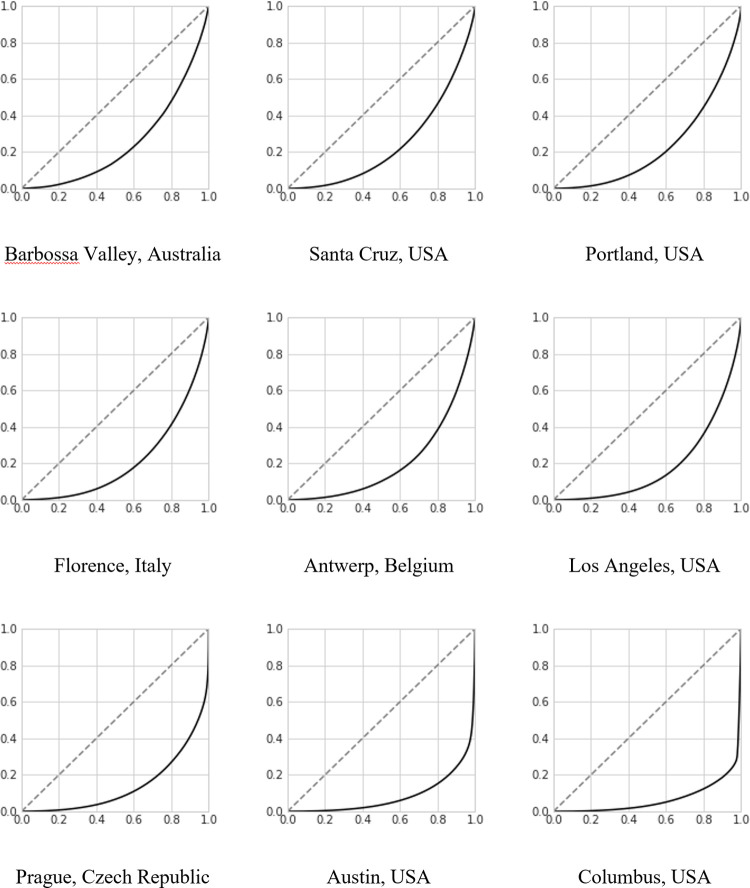
- Across 97 cities and regions, the average Gini coefficient is 0.68 (median 0.68, SD 0.069); about 10% of hosts receive roughly 50% of market revenue, and in the most unequal cities (Columbus, Austin, Prague) a large share goes to just 1% of hosts.
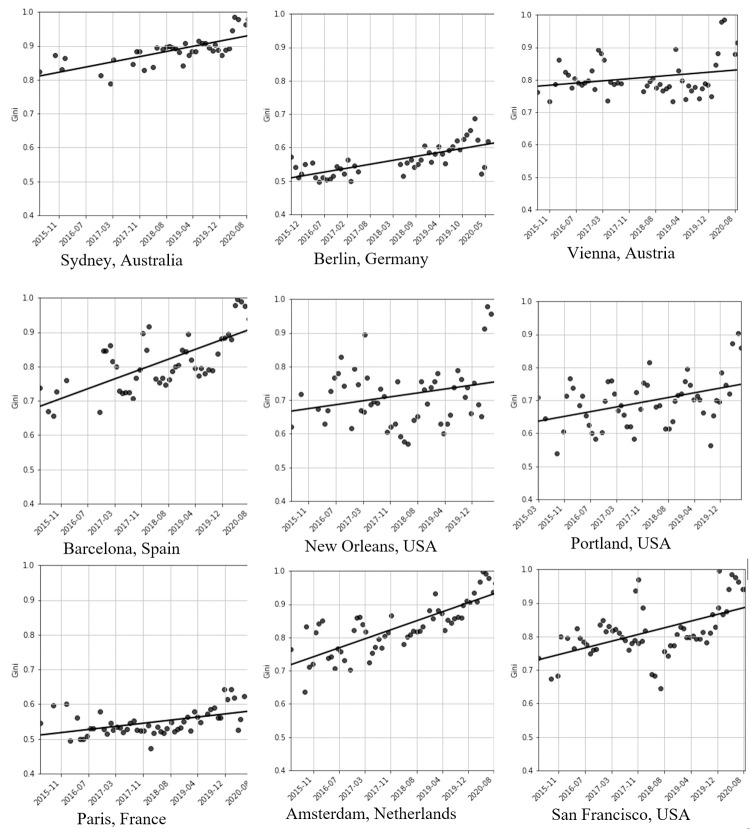
- Inequality rose over time in all nine cities with data since 2015; regulation did not significantly alter the long-term trend, though San Francisco’s 2018 registration deal caused a temporary spike and drop before returning to growing inequality.
- Black hosts receive on average 22% less revenue, and women 12% less; gaps are larger in some cities, e.g., Black hosts in Cape Town receive 57.9% less and in Rio de Janeiro 47.1% less, while women in Rio receive 32.4% less.
- Black hosts are underrepresented relative to city demographics—e.g., in Cape Town 4.8% of Airbnb hosts are classified as Black versus 38.6% of the population, while 74.4% of hosts are classified as White versus 1.4% of the population, an over 5,300% overrepresentation of White hosts.
Methods
- Uses InsideAirbnb scraped data for 97 cities/regions; the abstract reports 834,722 listings, 513,785 hosts, and 13,466,854 reviews, with 2019 data for current inequality and historic data since 2015 for nine cities.
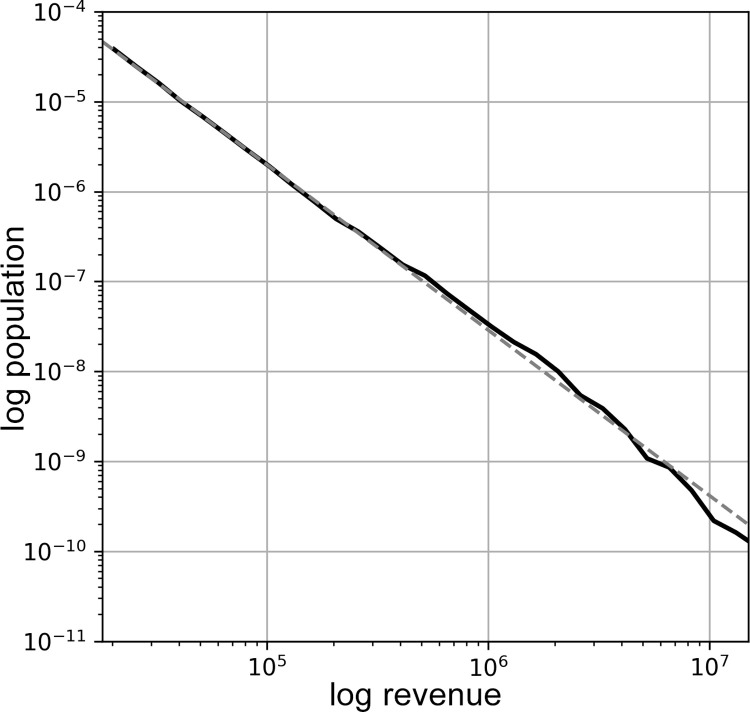
- Relative revenue is proxied as number of reviews × listing price, summed per host; hosts with no reviews are excluded; inequality is measured via Lorenz curves, Gini coefficients, and power-law fitting.
- Race and gender are classified from host profile pictures using Clarifai (discarding 26% with no face and 22% with multiple faces); OLS regressions use revenue normalized to city average, baseline White male, validated with Genderize (91.5% classified by first name; 92% agreement for women).
Limitations
- The paper states the relative-revenue proxy may bias estimates—e.g., if small/personal hosts receive more reviews, inequality may be underestimated—and assumes profile photos show the actual host; hosts using logos or other photos may be missed.
- The paper states race and gender operationalization is limited: race is socially constructed and not merely skin color, gender is treated as binary, and the analysis is descriptive rather than explanatory, not disentangling direct and indirect discrimination.
- Evident from the text: historic analysis covers only nine cities, and race/gender gap analysis focuses on the 14 cities with the most hosts due to limited classification resources.
Model-written summary. Check it against the paper before relying on it.
Integrity signals
Registry
Cites
Statistics
Figures
Verification
Claims the paper makes
0 Valid · 0 Not valid · 10 Not checked · 76 Own results and interpretations
A result the paper reports from its own data — it cites no other source for it, so there is none to check. The quote shows it is in the paper.
In the paper
“In every city except Beijing, female hosts receive less revenue than male hosts.”
- Also stated in: § Conclusion · hedged
“While women are overrepresented as hosts, they receive less revenue than men in almost all cities.”
§ How sharing is the “sharing economy”? Evidence from 97 Airbnb markets > Results > Race and gender gaps
plainstates an association- Asserted: passes — The authors put it forward as true.
- Checkable: passes — It can be checked against evidence.
- Load-bearing: passes — The paper’s conclusions depend on it.
- Based: passes — The paper gives a reason why it holds.
- Also stated in: § Conclusion · hedged
A result the paper reports from its own data — it cites no other source for it, so there is none to check. The quote shows it is in the paper.
In the paper
“the host revenue approximates a power-law distribution, expressed as a straight line on a log-log plot.”
§ How sharing is the “sharing economy”? Evidence from 97 Airbnb markets > Results
plain- Asserted: passes — The authors put it forward as true.
- Checkable: passes — It can be checked against evidence.
- Load-bearing: passes — The paper’s conclusions depend on it.
- Based: passes — The paper gives a reason why it holds.
A result the paper reports from its own data — it cites no other source for it, so there is none to check. The quote shows it is in the paper.
In the paper
“Surprisingly, while cities with more regulation tend to have lower levels of inequality, regulation against Airbnb does not significantly seem to impact the long-term evolution of the Gini coefficient.”
§ How sharing is the “sharing economy”? Evidence from 97 Airbnb markets > Results > Evolution of inequality
hedged- Asserted: passes — The authors put it forward as true.
- Checkable: passes — It can be checked against evidence.
- Load-bearing: passes — The paper’s conclusions depend on it.
- Based: passes — The paper gives a reason why it holds.
A result the paper reports from its own data — it cites no other source for it, so there is none to check. The quote shows it is in the paper.
In the paper
“Turning to the question of revenue gaps, the paper found large gaps between genders and racial groups.”
§ How sharing is the “sharing economy”? Evidence from 97 Airbnb markets > Conclusion
plainstates an association- Asserted: passes — The authors put it forward as true.
- Checkable: passes — It can be checked against evidence.
- Load-bearing: passes — The paper’s conclusions depend on it.
- Based: passes — The paper gives a reason why it holds.
A result the paper reports from its own data — it cites no other source for it, so there is none to check. The quote shows it is in the paper.
In the paper
“Amsterdam overall provides an interesting counterexample to the trends, where both Black, Hispanic-Latino, Southeastern Asian and East Asian hosts receive significantly more revenue than White hosts.”
§ How sharing is the “sharing economy”? Evidence from 97 Airbnb markets > Results > Race and gender gaps
plainstates an association- Asserted: passes — The authors put it forward as true.
- Checkable: passes — It can be checked against evidence.
- Load-bearing: unclear — It is unclear whether the paper’s conclusions depend on it.
- Based: passes — The paper gives a reason why it holds.
35 more claims
Create a free account to see all 86 claims and to verify the 15 references still open.
- It may state two separate claims as one. 37
- Probably not a substantial claim. 13
- The quote only partly states this claim. 2
Self-check
Percentages, sums and reported differences re-computed from the paper’s own numbers.
Each contradiction between two passages listed here was confirmed by an independent check.
Rated minor: it would not touch a result — a value no result rests on, a p-value that stays on the same side of the significance level, or a conflict that is clerical, resolved elsewhere in the paper, or outside its own findings.
In the paper
§ How sharing is the “sharing economy”? Evidence from 97 Airbnb markets > Results
“The Lorenz curves for the three cities with lowest, median and highest Gini coefficients, respectively. The Lorenz curve shows the cumulative fraction of the population on the x-axis, and the cumulative fraction of the revenue taken by this population on the y-axis. For instance, looking at Prague, that the line is at y = 0.3 at x = 0.8 tells us that 80% of the hosts receive around 30% of the revenue.”
§ How sharing is the “sharing economy”? Evidence from 97 Airbnb markets > Results
“| Czech Republic | Prague | 10,727 | 4,833 | 256,109 | 2.22 | 23.88 | 0.82 |”
Rated minor: it would not touch a result — a value no result rests on, a p-value that stays on the same side of the significance level, or a conflict that is clerical, resolved elsewhere in the paper, or outside its own findings.
In the paper
§ How sharing is the “sharing economy”? Evidence from 97 Airbnb markets > Results > Race and gender gaps
“On Airbnb, in contrast, only 4.8% are classified as Black, and 74.4% are classified as White”
§ How sharing is the “sharing economy”? Evidence from 97 Airbnb markets > Results > Race and gender gaps
“| Cape Town | 4.8% | 1.9% | 1.0% | 5.6% | 11.2% | 0.8% | 74.7% | 58.5% | 41.5% |”
Citations
Cites
Power-Law Distributions in Empirical Data
Clauset, A., Shalizi, C. R., & Newman, M. E. J. (2009) · SIAM Review · doi:10.1137/070710111 · Cited by 8,019
Statsmodels: Econometric and Statistical Modeling with Python
Seabold, S., & Perktold, J. (2010) · Proceedings of the Python in Science Conference · doi:10.25080/majora-92bf1922-011 · Cited by 6,465
Critical race theory: an introduction
(2013) · Choice Reviews Online · doi:10.5860/choice.50-2938 · Cited by 6,038
The Rise of the Sharing Economy: Estimating the Impact of Airbnb on the Hotel Industry
Zervas, G., Proserpio, D., & Byers, J. W. (2017) · Journal of Marketing Research · doi:10.1509/jmr.15.0204 · Cited by 2,376 · cited 1×
“In this narrative, the platforms stand on the side of the regular homeowner against large-scale real-estate interests, by supplanting large-scale hotel industry with small-scale home rental [15–19].”
Airbnb: disruptive innovation and the rise of an informal tourism accommodation sector
Guttentag, D. (2015) · Current Issues in Tourism · doi:10.1080/13683500.2013.827159 · Cited by 1,848
The wealth of networks: How social production transforms markets and freedom
Given, J. (2007) · Information Economics and Policy · doi:10.1016/j.infoecopol.2007.03.001 · Cited by 1,387
The sharing economy: A pathway to sustainability or a nightmarish form of neoliberal capitalism?
Martin, C. J. (2016) · Ecological Economics · doi:10.1016/j.ecolecon.2015.11.027 · Cited by 1,327
van Deursen, A. J., & van Dijk, J. A. (2019) · New Media & Society · doi:10.1177/1461444818797082 · Cited by 1,234
powerlaw: A Python Package for Analysis of Heavy-Tailed Distributions
Alstott, J., Bullmore, E., & Plenz, D. (2014) · PLoS ONE · doi:10.1371/journal.pone.0085777 · Cited by 1,002
Impacts of Peer-to-Peer Accommodation Use on Travel Patterns
Tussyadiah, I. P., & Pesonen, J. (2016) · Journal of Travel Research · doi:10.1177/0047287515608505 · Cited by 804
Research works printed but not linked: 9
- M. Cox, 2017, The face of Airbnb, New York City: Airbnb as a racial gentrification tool, Insid Airbnb
- N. Srnicek, 2017, Platform capitalism.
- Airbnb, 2016, Airbnb and Economic Opportunity in New York City’s Predominantly Black Neighborhoods Home Sharing in New York City
- M. Cox, 2015, Inside Airbnb: Adding data to the debate, Insid Airbnb
- P Törnberg, 2020, Selling black places on Airbnb: Colonial discourse and the marketing of black communities in New York City, Environ Plan A, 52
- I. Yrigoy, 2016, The case-study of Palma old quarter (Mallorca, Spain)., 281
- T Simcock, 2016, The bedroom boom: Airbnb and London
- M Cansoy, 2016, Who gets to share in the “Sharing Economy”: Understanding the patterns of participation and exchange in Airbnb, Unpubl Pap Bost Coll, 1
- 2015, Budget and Legislative Analyst’s Office, Analysis of the impact of short-term rentals on housing
Cited by
Airbnb and urban population change: an empirical analysis of the case of Stockholm, Sweden
Adamiak, C., & Marjavaara, R. (2023) · Urban Research & Practice · doi:10.1080/17535069.2023.2286521 · Cited by 22
Törnberg, P. (2025) · Social Media + Society · doi:10.1177/20563051251323389 · Cited by 14
“Digital media and cities are understood intersecting spaces that both enable the management of impression and the expression of lifestyles and identities (Törnberg, 2022b).”
Self-citationThe juggernaut endures: protest, Potemkinism, and Olympic reform
Wolfe, S. D. (2023) · Leisure Studies · doi:10.1080/02614367.2023.2195201 · Cited by 14
Fighting bias with bias: How same-race endorsements reduce racial discrimination on Airbnb
Park, M., Yu, C., & Macy, M. W. (2023) · Science Advances · doi:10.1126/sciadv.add2315 · Cited by 13
Sigler, T., Zou, Z., Corcoran, J., & Charles‐Edwards, E. (2023) · Tijdschrift voor Economische en Sociale Geografie · doi:10.1111/tesg.12588 · Cited by 10
Comparative platform urbanism: Cities in a world of platforms
Törnberg, P., & Söderström, O. (2025) · Digital Geography and Society · doi:10.1016/j.diggeo.2025.100119 · Cited by 9
Self-citationSu, B.-C., Lin, H., & Wang, Y. (2022) · Sustainability · doi:10.3390/su142316256 · Cited by 8
Selling out the city? Airbnb’s amateur and professional listings across cities, time, and hotspots
Kirchner, S., & Pohl, S. C. (2024) · Berliner Journal für Soziologie · doi:10.1007/s11609-024-00542-3 · Cited by 6
Achar, C., Agrawal, N., & Lock, K. (2025) · Journal of Consumer Research · doi:10.1093/jcr/ucaf022 · Cited by 5
Exploring guest engagement with Airbnb: consumer benefits and psychological ownership perspective
Buran, İ., Sabah, Ş., Ekinci, Y., & Koçak, A. (2025) · Journal of Hospitality Marketing & Management · doi:10.1080/19368623.2025.2549975 · Cited by 4
Zwischen Räumen: Wie sich Nähe und Distanz in Städten durch die Sharing Economy verändern
Oberthür, J., Henning, C., Janzing, M., Katzer, H., & Bönnighausen, H. (2024) · Berliner Journal für Soziologie · doi:10.1007/s11609-025-00545-8 · Cited by 4
Digital platforms as contact zones: urban reshaping and colonial aesthetics in Palermo
Aegerter, J., & Söderström, O. (2025) · Digital Geography and Society · doi:10.1016/j.diggeo.2025.100127 · Cited by 3
An enhanced decision-making framework for predicting future trends of sharing economy
Wu, Q. F., Tang, X., Li, R., Liu, L., & Chen, H. (2023) · PLoS ONE · doi:10.1371/journal.pone.0291626 · Cited by 2
Algorithmic Transparency and Consumer Disclosure
Dholakia, U. M. (2023) · Springer eBooks · doi:10.1007/978-3-031-12145-6_6 · Cited by 1
Unraveling participant motivation dynamics in local-centric secondhand digital sharing platforms
Kim, H., Kim, G., Lee, T., & Lee, J.-H. (2025) · PLoS ONE · doi:10.1371/journal.pone.0337603 · Cited by 1
Diving or thriving? How COVID-19 reshaped Australian short-term rental submarkets
Zou, Z., Sigler, T., Charles‐Edwards, E., & Corcoran, J. (2025) · Environment and Planning B Urban Analytics and City Science · doi:10.1177/23998083251324268 · Cited by 1
Evaluation of factors having an impact on the development of the sharing economy
Grybaitė, V. (2023) · doi:10.20334/2023-004-m · Cited by 1
Wafik, D., & Tharwat, A. (2023) · Journal of Namibian Studies History Politics Culture · doi:10.59670/jns.v33i.816
Limited Ownership and the Power of Sharing Tangible and Intangible Assets
Askari, M. Y. (2024) · Studies in systems, decision and control · doi:10.1007/978-3-031-51997-0_53
Pilvinen, L. (2023) · Osuva (University of Vaasa)
Tomaz, A. M. C. (2024) · Portuguese National Funding Agency for Science, Research and Technology (RCAAP Project by FCT)
Diniz, M. L. C., & Duarte, R. B. (2025) · Gestão & Tecnologia de Projetos · doi:10.11606/gtp.v20i2.239013
Coy-Mesa, D., Urdaneta, M. J., Morales‐Alonso, G., & Guerrero, Y. M. N. (2026) · Lecture notes in computer science · doi:10.1007/978-3-032-30536-7_19
Metadata
- Authors
- Törnberg, P.
- Affiliations
- University of Amsterdam (NL)
- Corresponding author
- Törnberg, Petter
- ORCID
- Törnberg, Petter
- Venue
- PLOS ONE
- Publisher
- Public Library of Science (PLoS)
- Published
- 2022-04-21
- Volume
- 17
- Issue
- 4
- Pages
- e0266998
- ISSN
- 1932-6203 (ISSN-L)
- PMC
- PMC9022852
- OpenAlex
- W4224242071
- Semantic Scholar
- f28f2e7050c3614d5ffbf3baf61cf556059e1a4e
- Cited by
- 24
- References
- 37
- Citations by year
- 2026: 2 · 2025: 8 · 2024: 4 · 2023: 9 · 2022: 1
- FWCI
- 3.05
- Type
- journal article
- Language
- en
- Open access
- gold
- doi.org
- Licence
- Locations
- PLoS ONE (publishedVersion, cc-by)
- PubMed (publishedVersion)
- PubMed Central (publishedVersion, cc-by)
- RePEc: Research Papers in Economics (submittedVersion)
- UvA-DARE (University of Amsterdam) (submittedVersion, cc-by)
- DOAJ (DOAJ: Directory of Open Access Journals) (submittedVersion, cc-by-sa)
- DOAJ (DOAJ: Directory of Open Access Journals) (submittedVersion)
- Data Archiving and Networked Services (DANS) (submittedVersion, other-oa)
- Funders
- Nederlandse Organisatie voor Wetenschappelijk Onderzoek (VI.Veni.201S.006)
- Topics
- Social Sciences › Business, Management and Accounting › Marketing › Sharing Economy and Platforms
- Social Sciences › Sociology and Political Science › Digital Economy and Work Transformation
- Social Sciences › Business, Management and Accounting › Strategy and Management › Digital Platforms and Economics
- Keywords
- sharing economy, Airbnb, platform markets, Gini coefficient, market centralization, platform regulation, digital platforms, peer-to-peer accommodation
- MeSH terms
- Cities, Female, Humans, Male, Government Regulation
About these checks
Registry, retraction, Cites and statistics results are computed, not judged, with one exception: a printed reference that no index lists is read once by a model before it counts as a citation error. Claims are extracted by a model and kept only when their quote appears verbatim in the text; each cited source is then checked, with a model’s help, for whether it says what the claim relies on. Those verdicts can be wrong — read the claim’s quote and the cited source before relying on one.
A language model drew the claims from the paper on 2026-11-13, under version 3 of the claim definition (model deepseek-v4.1-flash, prompt extract-v3).
A second model labelled each claim on 2026-11-13 (model jev-1.13-20260917, definition revision gold-guideline-v0.2).
Statistics and arithmetic are recomputed, not judged.
Confidence bands are shown only for fields calibrated on our annotated test set. None is calibrated yet, so no band is shown.
What counts as a claim ›How we measure confidence ›How we check this ›
Are you an author, or do you see a problem with this page? Request a review
Data sources
Bibliographic data: Semantic Scholar, OpenAlex, Crossref.
Contains information from the Semantic Scholar Academic Graph Datasets, made available under the ODC Attribution License (ODC-BY 1.0).
Semantic Scholar’s data is described in: Kinney, R., et al. (2023). The Semantic Scholar Open Data Platform. arXiv:2301.10140.
