

The DOI matches its Crossref record; 22 of the 22 references it cites were found in a registry or an index.
Stability of circulating microRNAs in serum
Abstract
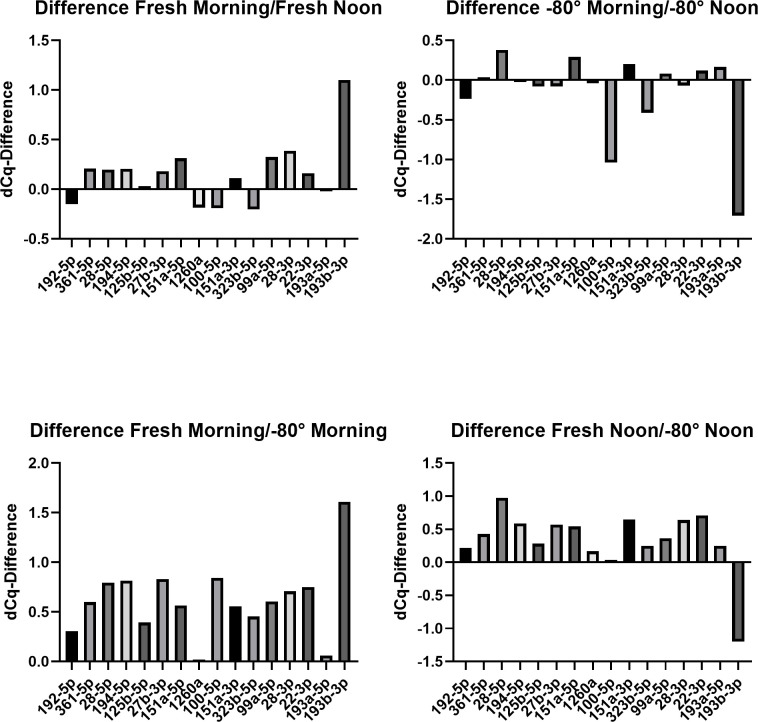
There is a strong body of evidence by several translational studies which demonstrate the potential of circulating miRNAs as a potential biomarker in oncology. However, recent reports documented varying stability of these small RNA molecules in serum samples. The aim of our pilot study was to evaluate the stability of miRNAs in serum in relation to food intake and sample storage. Serum miRNA expression levels of 16 different miRNAs from 8 healthy volunteers were quantified by real-time PCR. 4 samples from each donor were analysed—2 samples (fasting, in the morning and after food intake, at noon) were analysed within 24h and 2 samples (fasting and after food intake, at noon) were stored at -80°C for 14 days and subsequently analysed. Student´s t-test was used to determine significant differences. The detectability of the distinct miRNA as a surrogate for the stability of these small RNA molecules was slightly altered by the storage conditions, but only a miRNA 22-3p, out of the analysed 16 miRNAs, shows significant lower dCq expression (3.821 vs. 4.530; p<0,01) by qPCR dependent on storage conditions (-80°C vs. 4°C). However, miRNA levels were not affected by food intake. The difference between samples taken in the morning (fasting) and at noon (after a normal meal) did not show any significant differences. MiRNAs can be considered to be a relatively stable tool in laboratory diagnostics, but clearly every new assay needs thorough evaluation. The stability of miRNAs documented here in healthy volunteers shows their potential in the search for innovative biomarkers in oncology.
Overview
The claims and statistics of this paper haven’t been checked yet.
Run the check — free, no account needed. It reads the open-access text and checks the sources it cites.
Integrity signals
Registry
Cites
Statistics
Figures
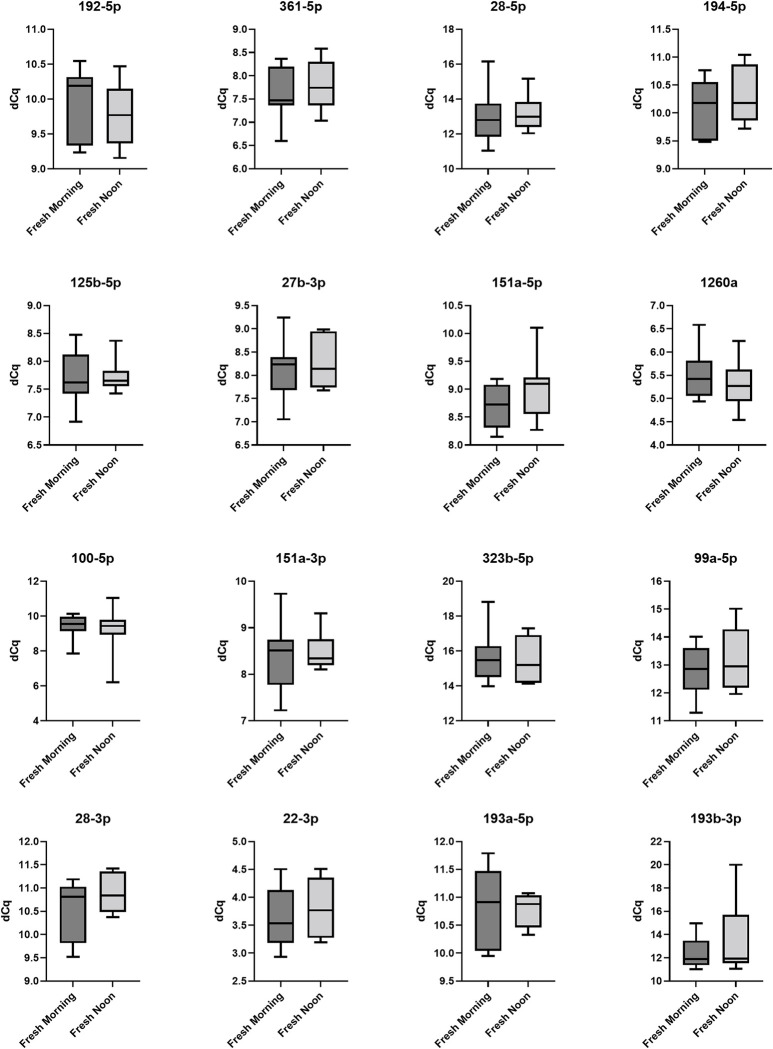
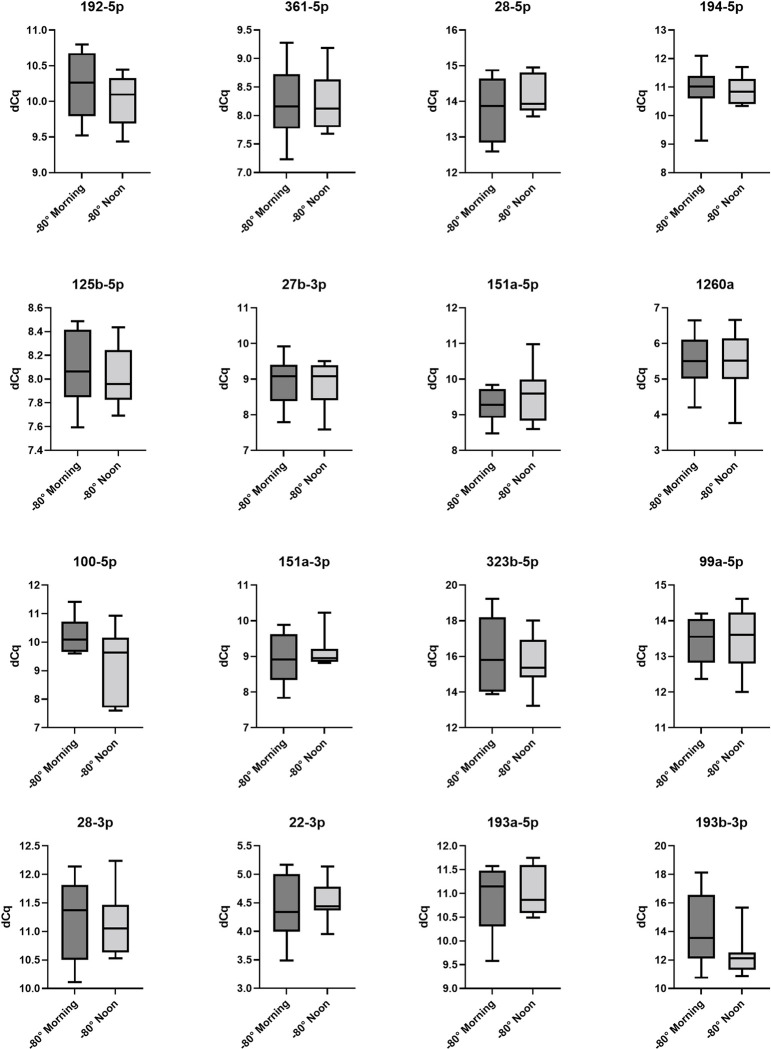
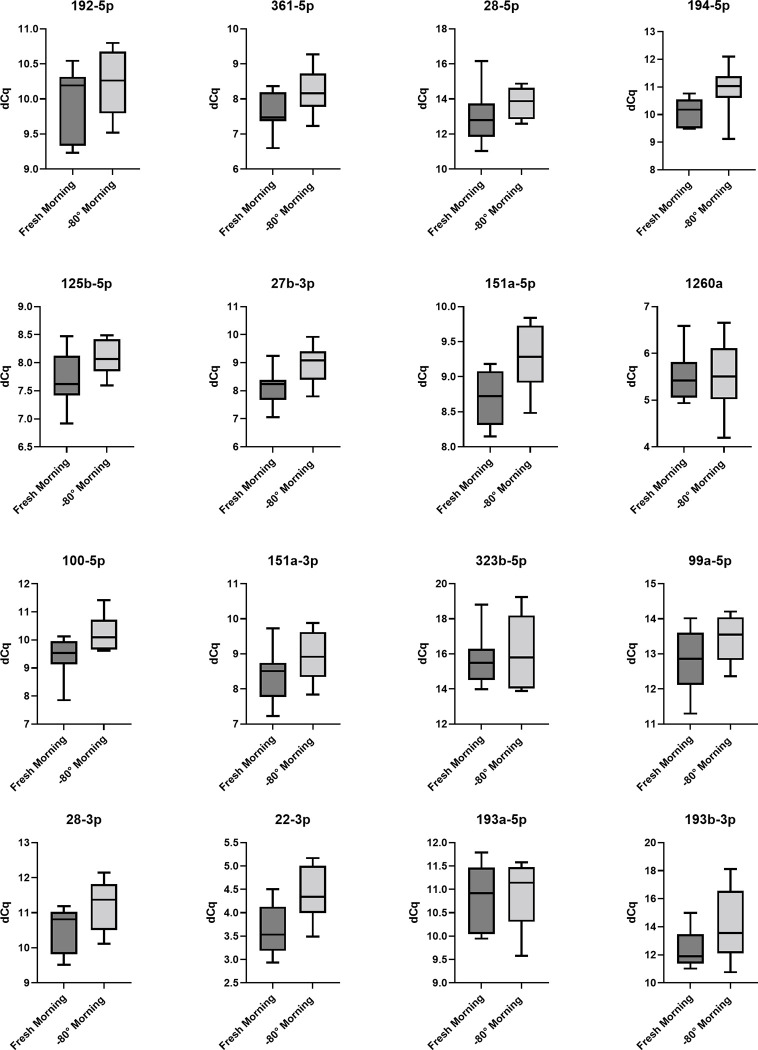
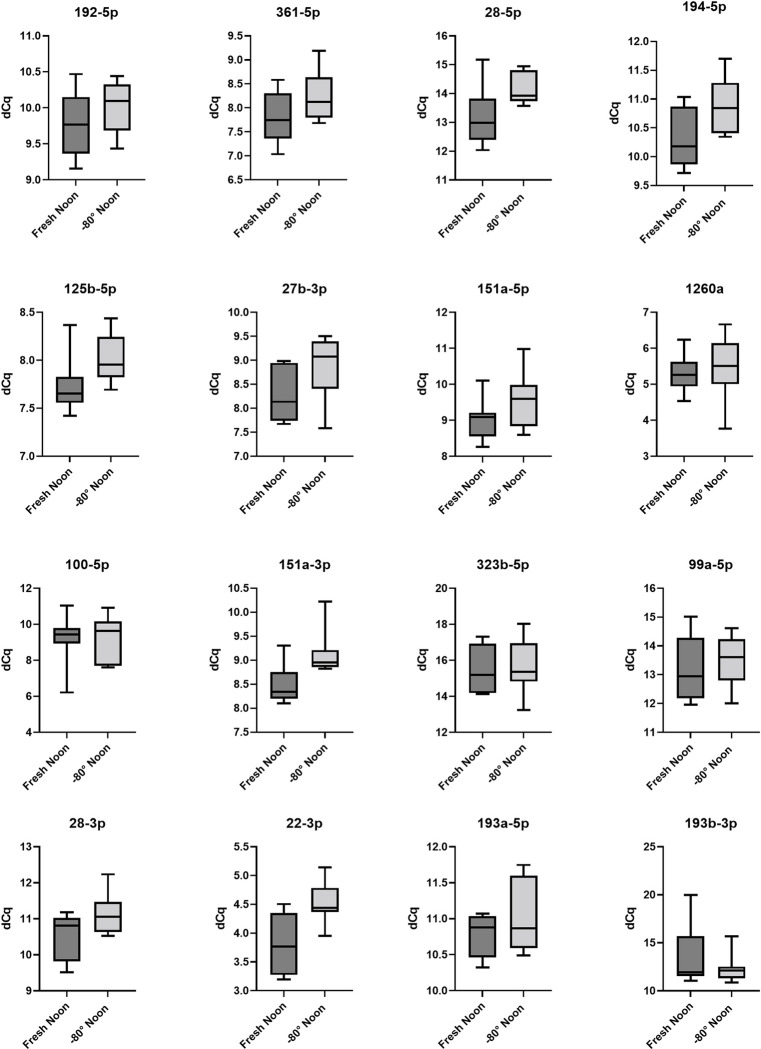
Verification
Claims the paper makes
The claims and statistics of this paper haven’t been checked yet.
Run the check — free, no account needed. It reads the open-access text and checks the sources it cites.
Claims other papers make about this one
Each is checked against this paper’s own text: does it say what the citing paper says it does?
The source backs part of the claim, not all of it — or backs it for a different population, condition or comparison.
In the citing paper
“Unlike other RNA species, they are extracellularly stable and circulate in body fluids, including plasma and cerebrospinal fluid (CSF), and therefore, are discussed as biomarkers for various diseases [16–18].”
From Neurodegenerative disease-associated microRNAs acting as signaling molecules modulate CNS neuron structure and viability (2025) · cites this paper as [17]
Experimental — accuracy not yet measuredThe source backs part of the claim, not all of it — or backs it for a different population, condition or comparison.
In the citing paper
“miRNA is known to be exceptionally stable to degradation in the extracellular space, withstanding even harsh treatments such as numerous freeze-thaw cycles [17, 18].”
From Neurodegenerative disease-associated microRNAs acting as signaling molecules modulate CNS neuron structure and viability (2025) · cites this paper as [17]
Experimental — accuracy not yet measured
Self-check
Percentages, sums and reported differences re-computed from the paper’s own numbers.
The self-check needs the paper’s full text.
Citations
Cites
Circulating microRNAs as stable blood-based markers for cancer detection
Mitchell, P. S., Parkin, R. K., Kroh, E. M., Fritz, B. R., Wyman, S. K., Pogosova-Agadjanyan, E. L., Peterson, A., Noteboom, J., O'Briant, K. C., Allen, A., et al. (2008) · Proceedings of the National Academy of Sciences · doi:10.1073/pnas.0804549105 · Cited by 7,969
Kroh, E. M., Parkin, R. K., Mitchell, P. S., & Tewari, M. (2010) · Methods · doi:10.1016/j.ymeth.2010.01.032 · Cited by 1,184
A Brief Review on the Mechanisms of miRNA Regulation
Cai, Y., Yu, X., Hu, S., & Yu, J. M. (2009) · Genomics Proteomics & Bioinformatics · doi:10.1016/s1672-0229(08)60044-3 · Cited by 1,050
Liquid Biopsy: Current Status and Future Perspectives
Mader, S., & Pantel, K. (2017) · Oncology Research and Treatment · doi:10.1159/000478018 · Cited by 234
Köberle, V., Pleli, T., Schmithals, C., Alonso, E. A., Haupenthal, J., Bonig, H. B., Peveling‐Oberhag, J., Biondi, R. M., Zeuzem, S., Kronenberger, B., et al. (2013) · PLoS ONE · doi:10.1371/journal.pone.0075184 · Cited by 194
Pre-profiling factors influencing serum microRNA levels
MacLellan, S. A., MacAulay, C. E., Lam, S. C., & Garnis, C. (2014) · BMC Clinical Pathology · doi:10.1186/1472-6890-14-27 · Cited by 106
Zhu, J., Zou, Z., Nie, P., Kou, X., Wu, B., Wang, S., Song, Z., & He, J. (2016) · Cell Death and Disease · doi:10.1038/cddis.2016.361 · Cited by 106
Impact of long-term storage and freeze-thawing on eight circulating microRNAs in plasma samples
Matías‐García, P. R., Wilson, R., Mussack, V., Reischl, E., Waldenberger, M., Gieger, C., Anton, G., Peters, A., & Kühn-Steven, A. (2020) · PLoS ONE · doi:10.1371/journal.pone.0227648 · Cited by 106
Arm Selection Preference of MicroRNA-193a Varies in Breast Cancer
Tsai, K.-W., Leung, C.-M., Lo, Y.-H., Chen, T.-W., Chan, W.-C., Yu, S.-Y., Tu, Y.-T., Lam, H.-C., Li, S.-C., Ger, L.-P., et al. (2016) · Scientific Reports · doi:10.1038/srep28176 · Cited by 84
Plasma MicroRNA Pair Panels as Novel Biomarkers for Detection of Early Stage Breast Cancer
Fang, R., Zhu, Y., Hu, L., Khadka, V. S., Ai, J., Zou, H., Ju, D., Jiang, B., Deng, Y., & Hu, X.-M. (2019) · Frontiers in Physiology · doi:10.3389/fphys.2018.01879 · Cited by 62
Circulating miRNAs in Untreated Breast Cancer: An Exploratory Multimodality Morpho-Functional Study
Incoronato, M., Grimaldi, A., Mirabelli, P., Cavaliere, C., Parente, C. A., Franzese, M., Staibano, S., Ilardi, G., Russo, D., Soricelli, A., et al. (2019) · Cancers · doi:10.3390/cancers11060876 · Cited by 53
Yamada, A., Cox, M. A., Gaffney, K., Moreland, A., Boland, C. R., & Goel, A. (2014) · PLoS ONE · doi:10.1371/journal.pone.0112481 · Cited by 52
miR-151-3p Targets TWIST1 to Repress Migration of Human Breast Cancer Cells
Yeh, T.-C., Huang, T., Yeh, T.-S., Chen, Y.-R., Hsu, K., Yin, P., Lee, H., & Tseng, L. (2016) · PLoS ONE · doi:10.1371/journal.pone.0168171 · Cited by 44
Garrido‐Cano, I., Constâncio, V., Adam‐Artigues, A., et al. (2020) · International Journal of Molecular Sciences · doi:10.3390/ijms21197427 · Cited by 40
MORC4 is a novel breast cancer oncogene regulated by miR‐193b‐3p
Yang, Z., Zhuang, Q., Hu, G., & Geng, S. (2018) · Journal of Cellular Biochemistry · doi:10.1002/jcb.27751 · Cited by 39
Positive expression of miR-361-5p indicates better prognosis for breast cancer patients
Cao, Z.-G., Huang, Y., Yao, L., et al. (2016) · Journal of Thoracic Disease · doi:10.21037/jtd.2016.06.29 · Cited by 38
miR‑28‑5p inhibits the migration of breast�cancer by regulating WSB2
Ma, L., Zhang, Y., & Hu, F. (2020) · International Journal of Molecular Medicine · doi:10.3892/ijmm.2020.4685 · Cited by 36
Fuso, P., Salvatore, M. D., Santonocito, C., Guarino, D., Autilio, C., Mulè, A., Arciuolo, D., Rinninella, A., Mignone, F., Ramundo, M., et al. (2021) · Journal of Personalized Medicine · doi:10.3390/jpm11080816 · Cited by 26
miR-151-5p, targeting chromatin remodeler SMARCA5, as a marker for the BRCAness phenotype
Tommasi, S., Pinto, R., Danza, K., Pilato, B., Palumbo, O., Micale, L., & Summa, S. D. (2016) · Oncotarget · doi:10.18632/oncotarget.10345 · Cited by 25
Sugita, B. M., Pereira, S. R. F., de Almeida, R. C., Gill, M. K., Mahajan, A. S., Duttargi, A., Kirolikar, S., Fadda, P., de Lima, R. S., Urban, C. A., et al. (2019) · Oncotarget · doi:10.18632/oncotarget.27250 · Cited by 24
Holubeková, V., Kolková, Z., Grendár, M., et al. (2020) · International Journal of Molecular Sciences · doi:10.3390/ijms21197288 · Cited by 24
Down-Regulation of miR-194-5p for Predicting Metastasis in Breast Cancer Cells
Yen, Y., Yang, J.-C., Chang, J.-B., & Tsai, S. (2021) · International Journal of Molecular Sciences · doi:10.3390/ijms23010325 · Cited by 21
Research works printed but not linked: 1
- J. Li, 2020, miR-28-3p promotes the malignant biological behaviors of triple negative breast cancer MDA-MB-468 cells via inhibiting BIN1, Chinese Journal of Cancer Biotherapy, 27, 55
Cited by
Kumbol, V., Ivanov, A., McGurran, H., Schüler, J., Zhai, Y., Ludwik, K., Hinkelmann, L., Brehm, M., Krüger, C., Küchler, J., et al. (2025) · Cell Communication and Signaling · doi:10.1186/s12964-025-02199-8 · Cited by 8
Maqueda, J. J., De Feo, A., & Scotlandi, K. (2024) · Biomolecules · doi:10.3390/biom14101306 · Cited by 4
Metadata
- Authors
- Kupec, T., Bleilevens, A., Iborra, S., Najjari, L., Wittenborn, J., Maurer, J., & Stickeler, E.
- ORCID
- Kupec, Tomas
- Venue
- PLOS ONE
- Publisher
- Public Library of Science (PLoS)
- Published
- 2022-08-31
- Volume
- 17
- Issue
- 8
- Pages
- e0268958
- ISSN
- 1932-6203
- PMC
- PMC9432728
- Cited by
- 60
- References
- 22
- Language
- en
About these checks
Registry, retraction, Cites and statistics results are computed, not judged, with one exception: a printed reference that no index lists is read once by a model before it counts as a citation error. Claims are extracted by a model and kept only when their quote appears verbatim in the text; each cited source is then checked, with a model’s help, for whether it says what the claim relies on. Those verdicts can be wrong — read the claim’s quote and the cited source before relying on one.
Statistics and arithmetic are recomputed, not judged.
Confidence bands are shown only for fields calibrated on our annotated test set. None is calibrated yet, so no band is shown.
What counts as a claim ›How we measure confidence ›How we check this ›
Are you an author, or do you see a problem with this page? Request a review
Data sources
Bibliographic data: Semantic Scholar, OpenAlex, Crossref.
Contains information from the Semantic Scholar Academic Graph Datasets, made available under the ODC Attribution License (ODC-BY 1.0).
Semantic Scholar’s data is described in: Kinney, R., et al. (2023). The Semantic Scholar Open Data Platform. arXiv:2301.10140.
