

District flood vulnerability assessment using analytic hierarchy process (AHP) with historical flood events in Bhutan
Open accessThe DOI matches its Crossref record; 55 of the 57 references it cites were found in a registry or an index, and 1 are not checked yet.
Abstract
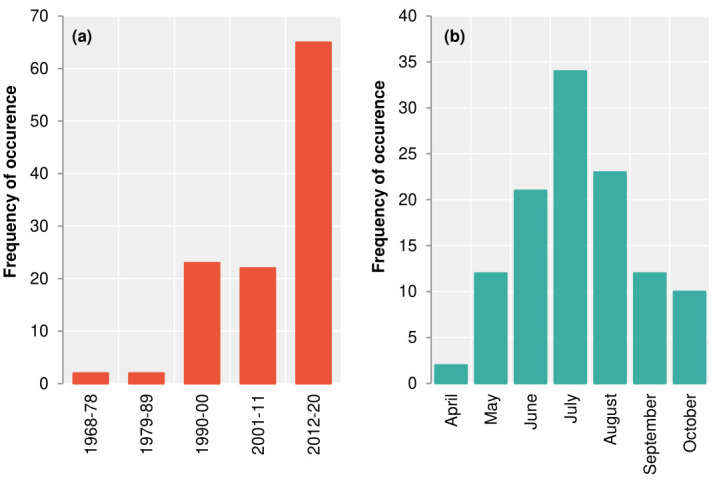
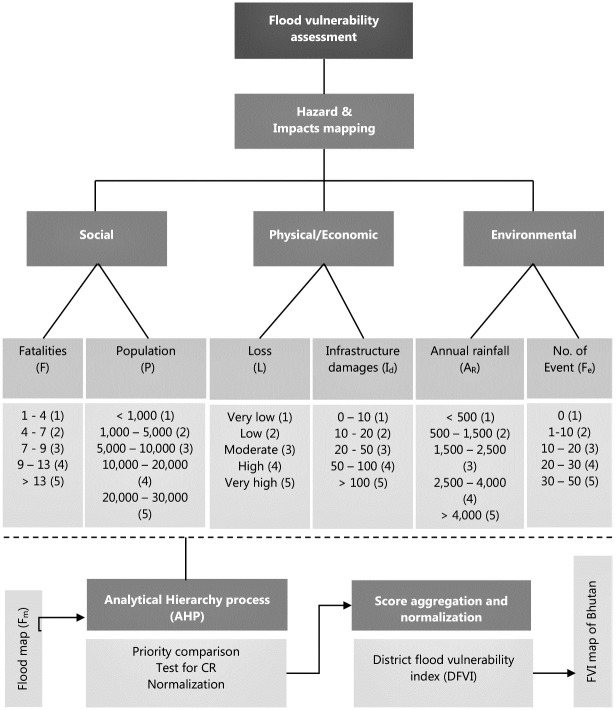
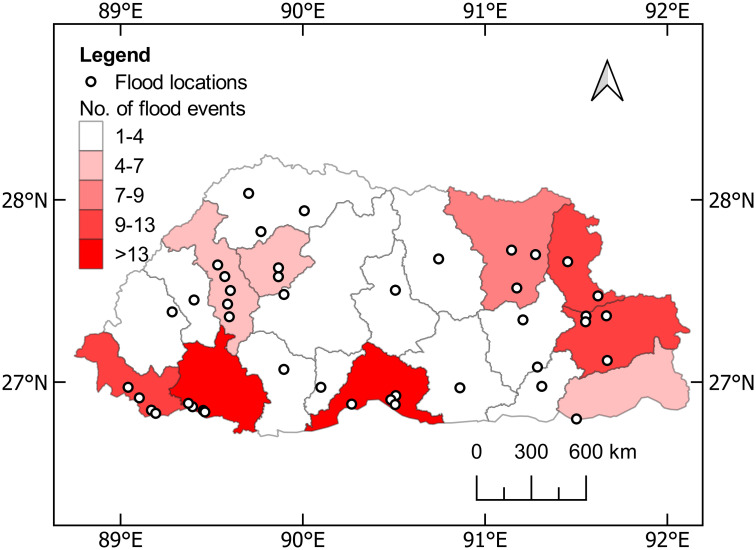
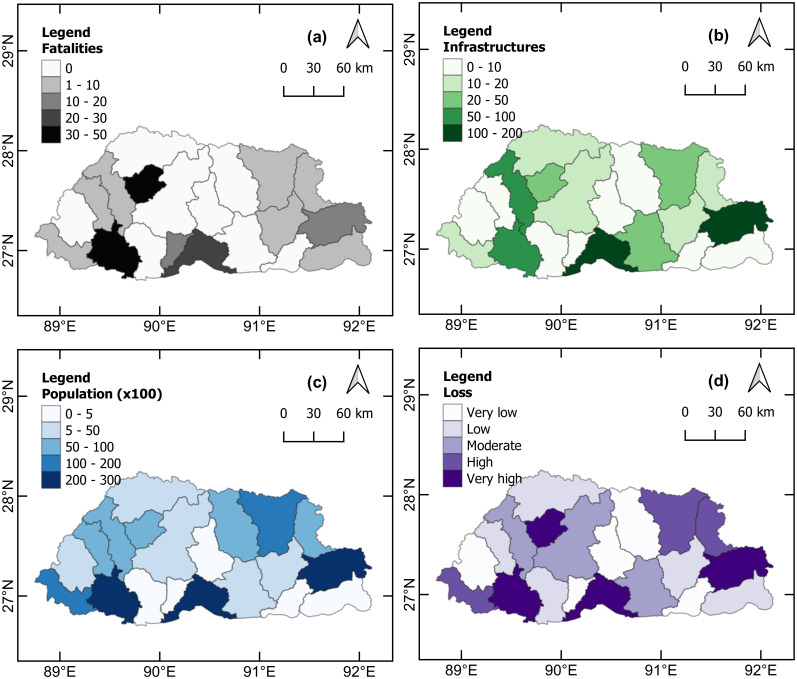
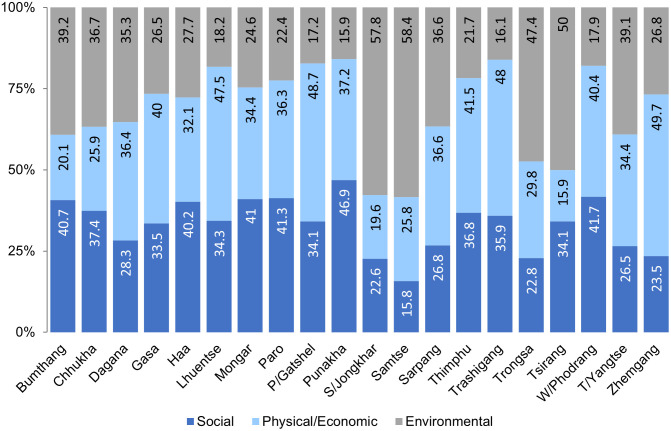
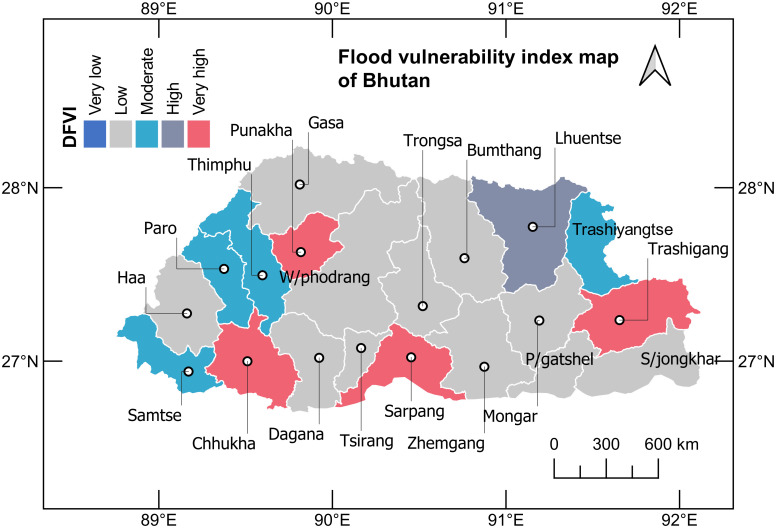
Flood hazards are common in Bhutan as a result of torrential rainfall. Historical flooding events also point to flooding during the main monsoon season of the year, which has had a huge impact in many parts of the country. To account for climate change patterns in flood hazards in Bhutan, 116 historical flood events between 1968 and 2020 for 20 districts were retrieved and reviewed. The preliminary review revealed that the frequency of flood occurrence has increased by three times in recent years. In this study, seven flood vulnerability (FV) indicators were considered. Five are the attributes of historical floods, classified into a number of incidents for flood events, fatalities, affected population, and infrastructure damages including economic losses. Additionally, the highest annual rainfall and existence of a flood map were other two indicators considered. Using historical data, flood hazard and impact zonation were performed. The analytic hierarchy process (AHP) method was employed to derive a multi-criteria decision model. This resulted in priority ranking of the seven FV indicators, broadly classified into social, physical/economic, and environmental. Thereafter, an indicator-based weighted method was used to develop the district flood vulnerability index (DFVI) map of Bhutan. The DFVI map should help researchers understand the flood vulnerability scenarios in Bhutan and use these to mediate flood hazard and risk management. According to the study, FVI is very high in Chhukha, Punakha, Sarpang, and Trashigang districts, and the index ranges between 0.75 to 1.0.
Overview
The claims and statistics of this paper haven’t been checked yet.
Free: it reads the open-access text and checks the first 5 claims that cite a source we can check. Create a free account to check every claim.
Integrity signals
Registry
Cites
Statistics
Figures
Verification
Claims the paper makes
The claims and statistics of this paper haven’t been checked yet.
Free: it reads the open-access text and checks the first 5 claims that cite a source we can check. Create a free account to check every claim.
Claims other papers make about this one
Each is checked against this paper’s own text: does it say what the citing paper says it does?
The cited source says what the claim attributes to it.
In the citing paper
“Comparable to regions like Bhutan, Freetown encounters pronounced flood hazards worsened by climatic unpredictability, highlighting the need for a nuanced understanding of its flood vulnerability dynamics [12,13].”
From Urban Flood Vulnerability Assessment in Freetown, Sierra Leone: AHP Approach (2024) · cites this paper as [12]
Self-check
Percentages, sums and reported differences re-computed from the paper’s own numbers.
The self-check needs the paper’s full text.
Citations
Cites
A scaling method for priorities in hierarchical structures
Saaty, T. L. (1977) · Journal of Mathematical Psychology · doi:10.1016/0022-2496(77)90033-5 · Cited by 10,360 · cited 2×
“A multi-objective AHP developed by Saaty [56] employs multi-criteria decision analysis that uses a pair-wise comparison process to efficiently evaluate complex decisions by constructing the judgement matrix with the scale of absolute numbers 1–9 (Table 3).”
MethodHow to Make a Decision: The Analytic Hierarchy Process
Saaty, T. L. (1990) · European Journal of Operational Research · doi:10.1016/0377-2217(90)90057-i · Cited by 9,605
A flood vulnerability index for coastal cities and its use in assessing climate change impacts
Balica, S. F., Wright, N. G., & van der Meulen, F. (2012) · Natural Hazards · doi:10.1007/s11069-012-0234-1 · Cited by 792 · cited 1×
“Some also used a combination of flood vulnerability indicators and climate change impacts [22, 23].”
BackgroundOuma, Y., & Tateishi, R. (2014) · Water · doi:10.3390/w6061515 · Cited by 711 · cited 4×
“Such studies are possible due to the availability of geographical information system (GIS) platforms and RS products, e.g., a remote sensing and GIS-based flood vulnerability assessment in Jiangxi province, China [45], urban flood vulnerability using AHP and GIS [46], social vulnerability assessment of flood risk usin…”
MethodInfluentialA multi-scale coastal vulnerability index: A tool for coastal managers?
Mclaughlin, S., & Cooper, J. A. G. (2010) · Environmental Hazards · doi:10.3763/ehaz.2010.0052 · Cited by 377 · cited 1×
“Initially, this scale system was defined by Mchaughlin and Cooper [55], with ‘5’ contributing most strongly to vulnerability, and ‘1’ contributing least.”
MethodFlood vulnerability indices at varying spatial scales
Balica, S. F., Douben, N., & Wright, N. G. (2009) · Water Science and Technology · doi:10.2166/wst.2009.183 · Cited by 328 · cited 1×
“, flood vulnerability indices at varying spatial scales [17], reducing the complexity of the flood vulnerability index [18], using the flood vulnerability index as a knowledge base for flood risk in urban areas [19], using the vulnerability index for urban flooding [20] and creating a new flood vulnerability index ada…”
MethodJonkman, S. N., & Vrijling, J. K. (2008) · Journal of Flood Risk Management · doi:10.1111/j.1753-318x.2008.00006.x · Cited by 288 · cited 1×
“Such an impact assessment not only gives a detailed insight into flood characteristics but is also helpful in providing information on warning and evacuation [60, 61].”
BackgroundFlood Risk Mapping Using GIS and Multi-Criteria Analysis: A Greater Toronto Area Case Study
Rincón, D., Khan, U. T., & Armenakis, C. (2018) · Geosciences · doi:10.3390/geosciences8080275 · Cited by 255 · cited 1×
“, a remote sensing and GIS-based flood vulnerability assessment in Jiangxi province, China [45], urban flood vulnerability using AHP and GIS [46], social vulnerability assessment of flood risk using GIS-based MCDA [47, 48], assessment of urban vulnerability to pluvial flooding using GIS applications [48], flood risk m…”
MethodRyan Cook, D., Staschak, S., & Green, W. T. (1990) · European Journal of Operational Research · doi:10.1016/0377-2217(90)90060-o · Cited by 197
Müller, A., Reiter, J., & Weiland, U. (2011) · Natural Hazards and Earth System Sciences · doi:10.5194/nhess-11-2107-2011 · Cited by 192
Research works printed but not linked: 2
- Sudhaus D, Seidel J, Bürger K, Dostal P, Imbery F, Mayer H, et al. Discharges of past flood events based on historical river profiles Hydrology and Earth System Sciences Discussions. Hydrol Earth Syst Sci. 2008; 323– 344.
- Nasiri H, Shahmohammadi-Kalalagh S. Flood vulnerability index as a knowledge base for flood risk assessment in urban area. J Nov Appl Sci. 2013; 2: 266– 269.
Cited by
Debnath, J., Sahariah, D., Mazumdar, M., Lahon, D., Meraj, G., Hashimoto, S., Kumar, P., Singh, S. K., Kanga, S., Chand, K., et al. (2023) · Earth Systems and Environment · doi:10.1007/s41748-023-00358-w · Cited by 77
“Geopolitically, the basin's territory is distributed among Bhutan (7.8%), Bangladesh (8.1%), India (33.6%), and China (50.5”
InfluentialJanizadeh, S., Kim, D., Jun, C., Bateni, S. M., Pandey, M. K., & Mishra, V. N. (2024) · Journal of Environmental Management · doi:10.1016/j.jenvman.2024.121764 · Cited by 52
Bhuyan, N., Sajjad, H., Saha, T. K., Roshani, Sharma, Y., Masroor, M., Rahaman, M. H., & Ahmed, R. (2023) · CATENA · doi:10.1016/j.catena.2023.107581 · Cited by 39
Mekonnen, T. M., Mitiku, A. B., & Woldemichael, A. T. (2023) · The Scientific World JOURNAL · doi:10.1155/2023/1675634 · Cited by 41
Risk assessment of land subsidence in Shanghai municipality based on AHP and EWM
Zhan, Y., Zhang, Y., Zhang, J., Xu, J., Chen, H., Liu, G., & Wan, Z. (2025) · Scientific Reports · doi:10.1038/s41598-025-91109-6 · Cited by 25
Metadata
- Authors
- Tempa, K.
- Affiliations
- College of Science and Technology (BT)
- Corresponding author
- Tempa, Karma
- ORCID
- Tempa, Karma
- Venue
- PLOS ONE
- Publisher
- Public Library of Science (PLoS)
- Published
- 2022-06-24
- Volume
- 17
- Issue
- 6
- Pages
- e0270467
- ISSN
- 1932-6203 (ISSN-L)
- PMC
- PMC9231754
- OpenAlex
- W4283466965
- Cited by
- 56
- References
- 57
- Citations by year
- 2026: 14 · 2025: 12 · 2024: 16 · 2023: 12 · 2022: 2
- FWCI
- 4.18
- Type
- journal article
- Language
- en
- Open access
- gold
- doi.org
- Licence
- Locations
- PLoS ONE (publishedVersion, cc-by)
- PubMed Central (publishedVersion, cc-by)
- PubMed (publishedVersion)
- RePEc: Research Papers in Economics (submittedVersion)
- DOAJ (DOAJ: Directory of Open Access Journals) (submittedVersion)
- Greater South Information System
- Funders
- Royal Government of Bhutan
- Topics
- Physical Sciences › Environmental Science › Global and Planetary Change › Flood Risk Assessment and Management
- Social Sciences › Sociology and Political Science › Disaster Management and Resilience
- Physical Sciences › Environmental Science › Management, Monitoring, Policy and Law › Landslides and related hazards
- Keywords
- flood vulnerability, flood history, flood vulnerability index, flood hazard mapping, multi-criteria decision making, torrential rainfall, monsoon flooding, climate change impacts on floods, flood fatalities, infrastructure damage, flood maps
- MeSH terms
- Analytic Hierarchy Process, Bhutan, Floods, Climate Change
About these checks
Registry, retraction, Cites and statistics results are computed, not judged, with one exception: a printed reference that no index lists is read once by a model before it counts as a citation error. Claims are extracted by a model and kept only when their quote appears verbatim in the text; each cited source is then checked, with a model’s help, for whether it says what the claim relies on. Those verdicts can be wrong — read the claim’s quote and the cited source before relying on one.
Statistics and arithmetic are recomputed, not judged.
Confidence bands are shown only for fields calibrated on our annotated test set. None is calibrated yet, so no band is shown.
What counts as a claim ›How we measure confidence ›How we check this ›
Are you an author, or do you see a problem with this page? Request a review
Data sources
Bibliographic data: Semantic Scholar, OpenAlex, Crossref.
Contains information from the Semantic Scholar Academic Graph Datasets, made available under the ODC Attribution License (ODC-BY 1.0).
Semantic Scholar’s data is described in: Kinney, R., et al. (2023). The Semantic Scholar Open Data Platform. arXiv:2301.10140.
