

The DOI matches its Crossref record; 85 of the 85 references it cites were found in a registry or an index.
Analysis of the Leishmania mexicana promastigote cell cycle using imaging flow cytometry provides new insights into cell cycle flexibility and events of short duration
Open accessAbstract
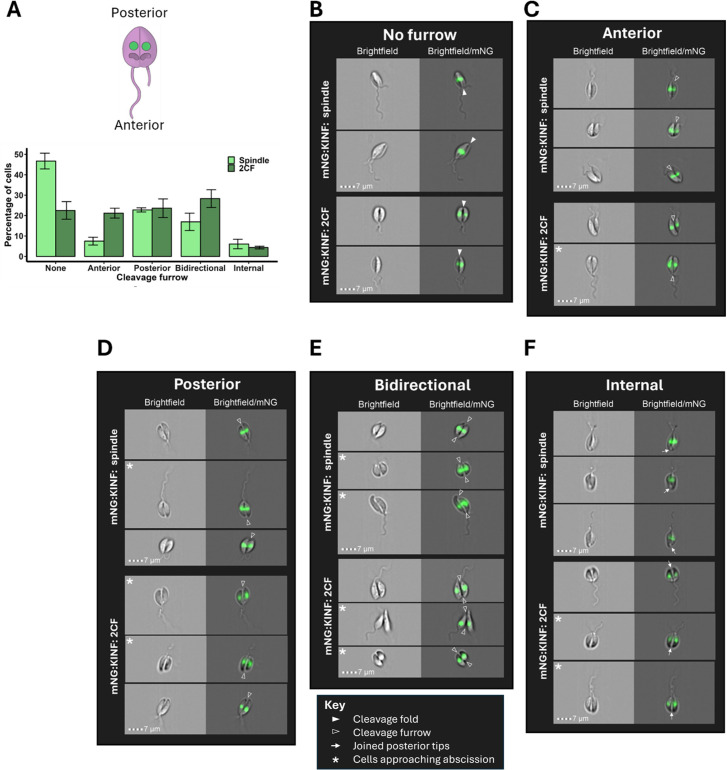
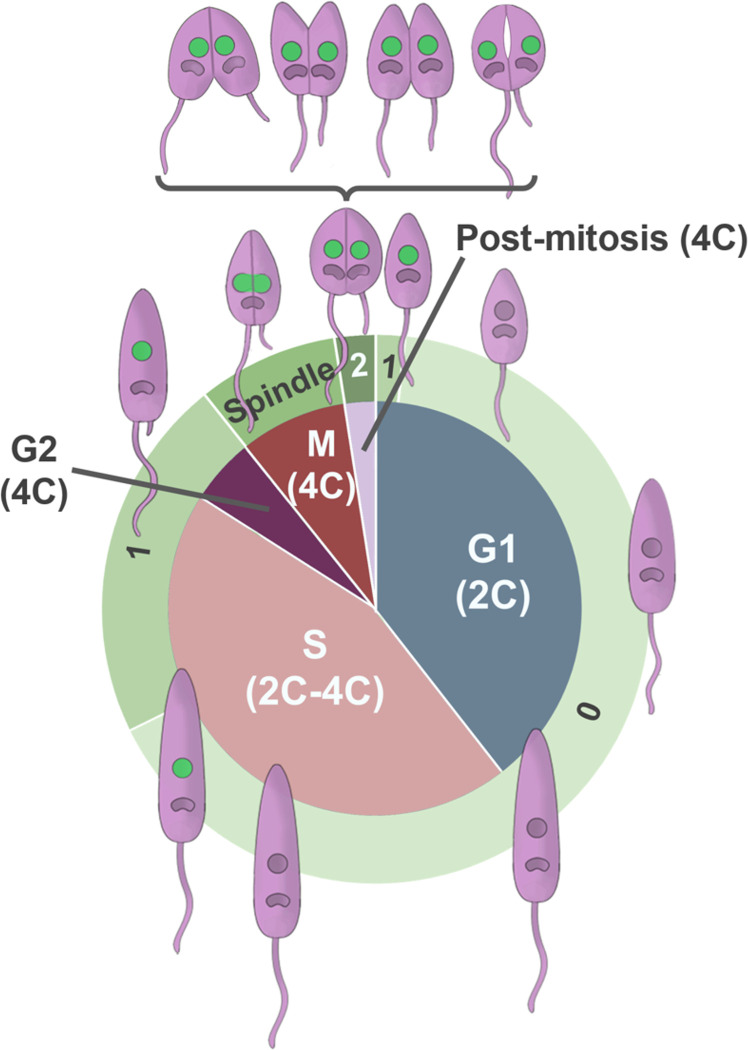
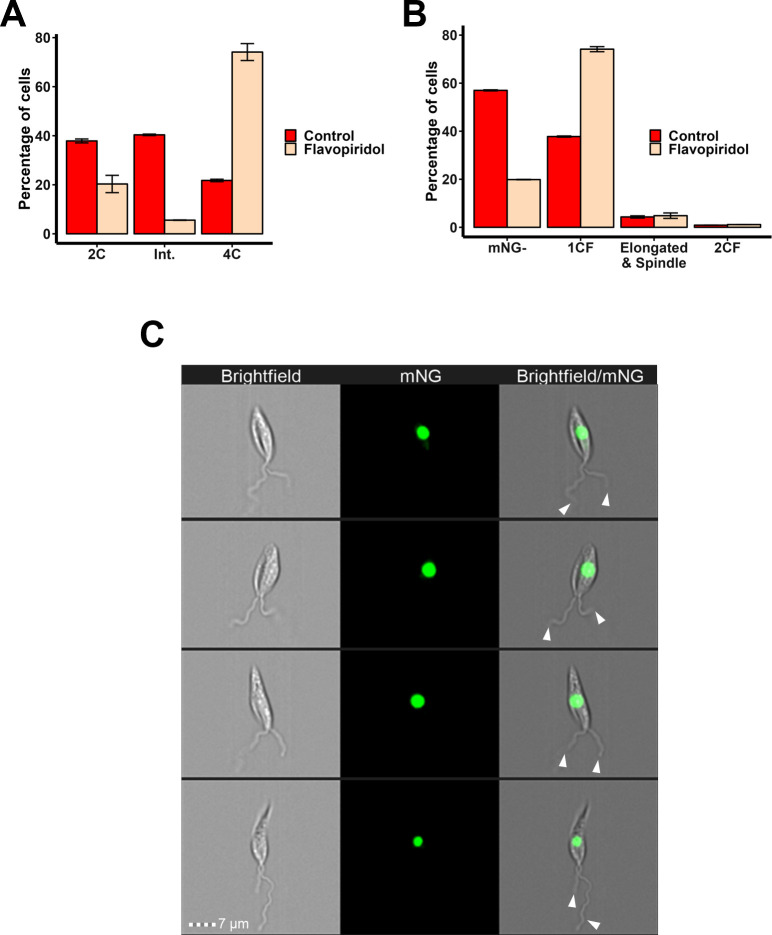
Promastigote Leishmania mexicana have a complex cell division cycle characterised by the ordered replication of several single-copy organelles, a prolonged S phase and rapid G2 and cytokinesis phases, accompanied by cell cycle stage-associated morphological changes. Here we exploit these morphological changes to develop a high-throughput and semi-automated imaging flow cytometry (IFC) pipeline to analyse the cell cycle in live L. mexicana. Firstly, we demonstrate that, unlike several other DNA stains, Vybrant™ DyeCycle™ Orange (DCO) is non-toxic and enables quantitative DNA imaging in live promastigotes. Secondly, by tagging the orphan spindle kinesin, KINF, with mNeonGreen, we describe KINF’s cell cycle-dependent expression and localisation. Then, by combining manual gating of DCO DNA intensity profiles with automated masking and morphological measurements of parasite images, visual determination of the number of flagella per cell, and automated masking and analysis of mNG:KINF fluorescence, we provide a newly detailed description of L. mexicana promastigote cell cycle events that, for the first time, includes the durations of individual G2, mitosis and post-mitosis phases, and identifies G1 cells within the first 12 minutes of the new cell cycle. Our custom-developed masking and gating scheme allowed us to identify elusive G2 cells and to demonstrate that the CDK-inhibitor, flavopiridol, arrests cells in G2 phase, rather than mitosis, providing proof-of-principle of the utility of IFC for drug mechanism-of-action studies. Further, the high-throughput nature of IFC allowed the close examination of promastigote cytokinesis, revealing considerable flexibility in both the timing of cytokinesis initiation and the direction of furrowing, in contrast to the related kinetoplastid parasite, Trypanosoma brucei and many other cell types. Our new pipeline offers many advantages over traditional methods of cell cycle analysis such as fluorescence microscopy and flow cytometry and paves the way for novel high-throughput analysis of Leishmania cell division.
Overview
The claims and statistics of this paper haven’t been checked yet.
Run the check — free, no account needed. It reads the open-access text and checks the sources it cites.
Integrity signals
Registry
Cites
Statistics
Figures
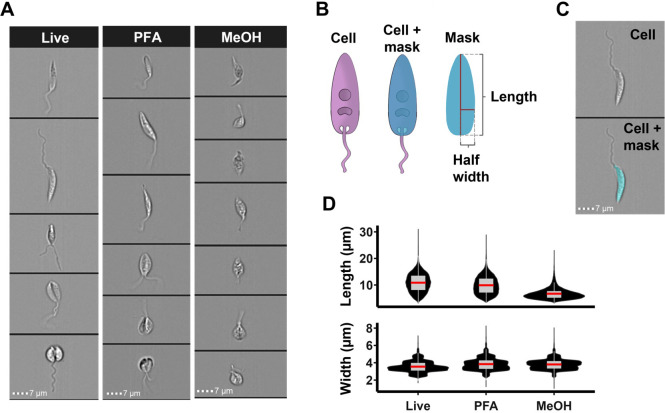
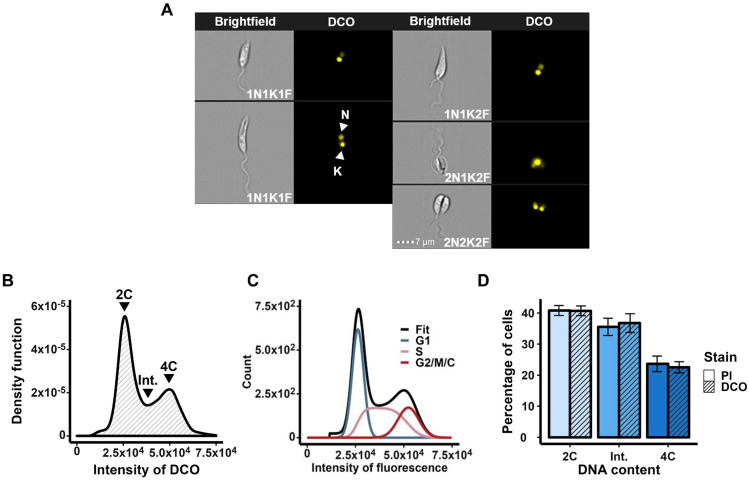
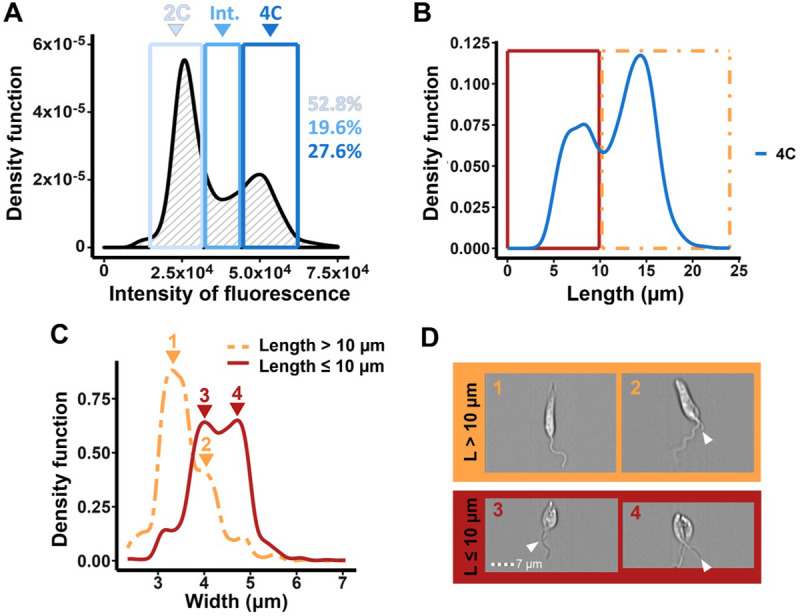
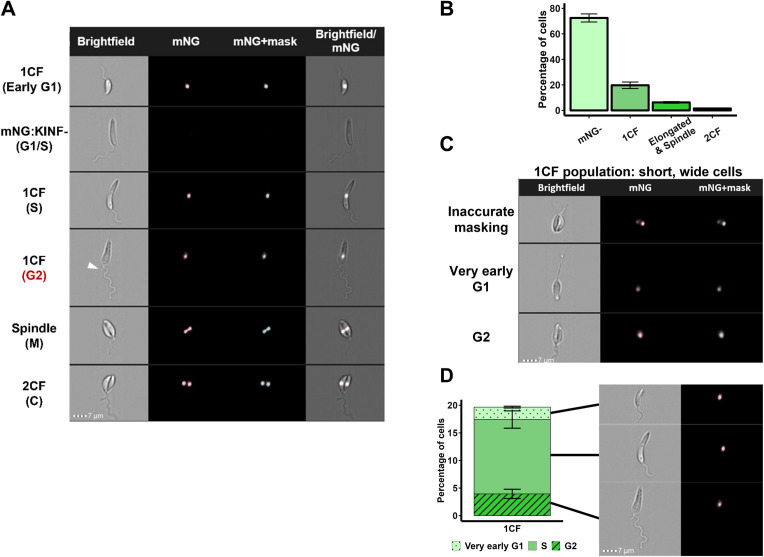
Verification
Claims the paper makes
The claims and statistics of this paper haven’t been checked yet.
Run the check — free, no account needed. It reads the open-access text and checks the sources it cites.
Claims other papers make about this one
Each is checked against this paper’s own text: does it say what the citing paper says it does?
The source backs part of the claim, not all of it — or backs it for a different population, condition or comparison.
In the citing paper
“This method can be used to evaluate the proliferation rates of microalgae depending on the cultivation conditions, e.g., changes in nutrient availability or light intensity [235].”
From Multi-Sensing Monitoring of the Microalgae Biomass Cultivation Systems for Biofuels and Added Value Products Synthesis—Challenges and Opportunities (2025) · cites this paper as [235]
Experimental — accuracy not yet measured
Self-check
Percentages, sums and reported differences re-computed from the paper’s own numbers.
The self-check needs the paper’s full text.
Citations
Cites
NIH Image to ImageJ: 25 years of image analysis
Schneider, C. A., Rasband, W. S., & Eliceiri, K. W. (2012) · Nature Methods · doi:10.1038/nmeth.2089 · Cited by 64,638
A CRISPR Cas9 high-throughput genome editing toolkit for kinetoplastids
Beneke, T., Madden, R., Makin, L., Valli, J., Sunter, J. D., & Gluenz, E. (2017) · Royal Society Open Science · doi:10.1098/rsos.170095 · Cited by 392
Label-free cell cycle analysis for high-throughput imaging flow cytometry
Blasi, T., Hennig, H., Summers, H. D., Theis, F. J., Cerveira, J., Patterson, J. O., Davies, D. C., Filby, A. J., Carpenter, A. E., & Rees, P. C. T. (2016) · Nature Communications · doi:10.1038/ncomms10256 · Cited by 301
Reconstructing cell cycle and disease progression using deep learning
Eulenberg, P., Köhler, N., Blasi, T., Filby, A. J., Carpenter, A. E., Rees, P. C. T., Theis, F. J., & Wolf, F. A. (2017) · Nature Communications · doi:10.1038/s41467-017-00623-3 · Cited by 278
A pragmatic approach to the analysis of DNA histograms with a definable G1 peak
Watson, J. V., Chambers, S. H., & Smith, P. J. (1987) · Cytometry · doi:10.1002/cyto.990080101 · Cited by 258
The cell cycle of Leishmania: morphogenetic events and their implications for parasite biology
Wheeler, R. J., Gluenz, E., & Gull, K. (2010) · Molecular Microbiology · doi:10.1111/j.1365-2958.2010.07479.x · Cited by 222
mScarlet3: a brilliant and fast-maturing red fluorescent protein
Gadella, T. W. J., van Weeren, L., Stouthamer, J., Hink, M. A., Wolters, A. H. G., Giepmans, B. N. G., Aumonier, S., Dupuy, J., & Royant, A. (2023) · Nature Methods · doi:10.1038/s41592-023-01809-y · Cited by 218
Sunter, J. D., & Gull, K. (2017) · Open Biology · doi:10.1098/rsob.170165 · Cited by 192
Rees, P. C. T., Summers, H. D., Filby, A. J., Carpenter, A. E., & Doan, M. (2022) · Nature Reviews Methods Primers · doi:10.1038/s43586-022-00167-x · Cited by 180
A model for the computer analysis of synchronous DNA distributions obtained by flow cytometry
Fox, M. H. (1980) · Cytometry · doi:10.1002/cyto.990010114 · Cited by 146
Cited by
Dębowski, M., Kazimierowicz, J., & Zieliński, M. (2025) · Applied Sciences · doi:10.3390/app15137324 · Cited by 30
Kumari, D., Kour, J., Kumar, A., Sangral, M., Singh, S. K., Sawant, S. D., & Singh, K. (2025) · Bioorganic Chemistry · doi:10.1016/j.bioorg.2025.108804 · Cited by 14
Dual immunomodulatory and antileishmanial potential of TLR7/8 agonists against Leishmania donovani
Thakur, S., Kaushik, D., Kumar, K., Kaur, S., Kumar, R., Salunke, D. B., & Kaur, S. (2025) · Infection and Immunity · doi:10.1128/iai.00323-25 · Cited by 6
Howell, J., Hall, N. M., Omwenga, S., Hammarton, T. C., & Jimenez, M. (2025) · The Analyst · doi:10.1039/d4an01288g · Cited by 2
Self-citationGupta, A. R., Beg, M. A., Badhwar, S., Srivastava, S., Srivastava, R., Puri, N., Saxena, A. K., Abdin, M. Z., & Selvapandiyan, A. (2025) · Microbial Pathogenesis · doi:10.1016/j.micpath.2025.108192 · Cited by 1
Ribeiro, J. M., da Fonseca, G. F., Anbo, M. A. K., Costa, K. F., de Oliveira, A. C. S., Lopes, K. F., Cruz, M. G. F. D. M. L., Costa-Silva, H. M., Santi, A. M. M., & Murta, S. M. F. (2026) · PLoS neglected tropical diseases · doi:10.1371/journal.pntd.0014330 · Cited by 1
Howell, J., Jimenez, M., & Hammarton, T. C. (2026) · Methods in molecular biology · doi:10.1007/978-1-0716-5146-9_10
Self-citationLei, T., 余梦涛, Lv, P., Deng, H., Yang, D., Li, K., & Li, Y. (2026) · Pathogens · doi:10.3390/pathogens15040448
Cruz, M. G. F. D. M. L., Silva, F. V. M., Sá, G. C. D. P. E., Ribeiro, J. M., da Fonseca, G. F., Lima, D. A., Lopes, K. F., Santi, A. M. M., & Murta, S. M. F. (2026) · Antimicrobial Agents and Chemotherapy · doi:10.1128/aac.00247-26
Marques, C. A., Laidlaw, R. F., Warren, F., Silva, G. L. A., Young, M., Crouch, K., Burchmore, R., Otto, T. D., Llewellyn, M., McCulloch, R., et al. (2026) · bioRxiv (Cold Spring Harbor Laboratory) · doi:10.64898/2026.09.29.755301
Metadata
- Authors
- Howell, J., Omwenga, S., Jimenez, M., & Hammarton, T. C.
- Affiliations
- University of Glasgow (GB)
- Corresponding author
- Hammarton, Tansy C.
- Venue
- PLOS ONE
- Publisher
- Public Library of Science (PLoS)
- Published
- 2024-10-03
- Volume
- 19
- Issue
- 10
- Pages
- e0311367
- ISSN
- 1932-6203 (ISSN-L)
- PMC
- PMC11449296
- OpenAlex
- W4403092611
- Cited by
- 10
- References
- 85
- Citations by year
- 2026: 5 · 2025: 5
- FWCI
- 4.14
- Type
- journal article
- Language
- en
- Open access
- gold
- doi.org
- Licence
- Locations
- PLoS ONE (publishedVersion, cc-by)
- PubMed Central (publishedVersion, cc-by)
- PubMed (publishedVersion)
- ENLIGHTEN (Jurnal Bimbingan dan Konseling Islam) (acceptedVersion, cc-by-sa)
- Strathprints: The University of Strathclyde institutional repository (University of Strathclyde) (acceptedVersion)
- DOAJ (DOAJ: Directory of Open Access Journals) (submittedVersion, cc-by-sa)
- Funders
- Engineering and Physical Sciences Research Council (EP/R513222/1)
- Royal Academy of Engineering (RF/201718/1741)
- The Cunningham Trust (PhD-CT-19-14)
- Topics
- Health Sciences › Medicine › Public Health, Environmental and Occupational Health › Research on Leishmaniasis Studies
- Life Sciences › Biochemistry, Genetics and Molecular Biology › Biophysics › Cell Image Analysis Techniques
- Physical Sciences › Computer Science › Computer Vision and Pattern Recognition › Digital Imaging for Blood Diseases
- Keywords
- Leishmania mexicana, promastigotes, cell cycle, imaging flow cytometry, mNeonGreen tagging, G2 phase, cytokinesis, mitosis, flavopiridol, cyclin-dependent kinase inhibitors, cell morphology, mechanism of action
- MeSH terms
- Cell Cycle, Flow Cytometry, Leishmania mexicana, Mitosis, Protozoan Proteins, Kinesins
About these checks
Registry, retraction, Cites and statistics results are computed, not judged, with one exception: a printed reference that no index lists is read once by a model before it counts as a citation error. Claims are extracted by a model and kept only when their quote appears verbatim in the text; each cited source is then checked, with a model’s help, for whether it says what the claim relies on. Those verdicts can be wrong — read the claim’s quote and the cited source before relying on one.
Statistics and arithmetic are recomputed, not judged.
Confidence bands are shown only for fields calibrated on our annotated test set. None is calibrated yet, so no band is shown.
What counts as a claim ›How we measure confidence ›How we check this ›
Are you an author, or do you see a problem with this page? Request a review
