

The DOI matches its Crossref record; 95 of the 95 references it cites were found in a registry or an index.
Helicobacter pylori Perturbs Iron Trafficking in the Epithelium to Grow on the Cell Surface
Open accessAbstract
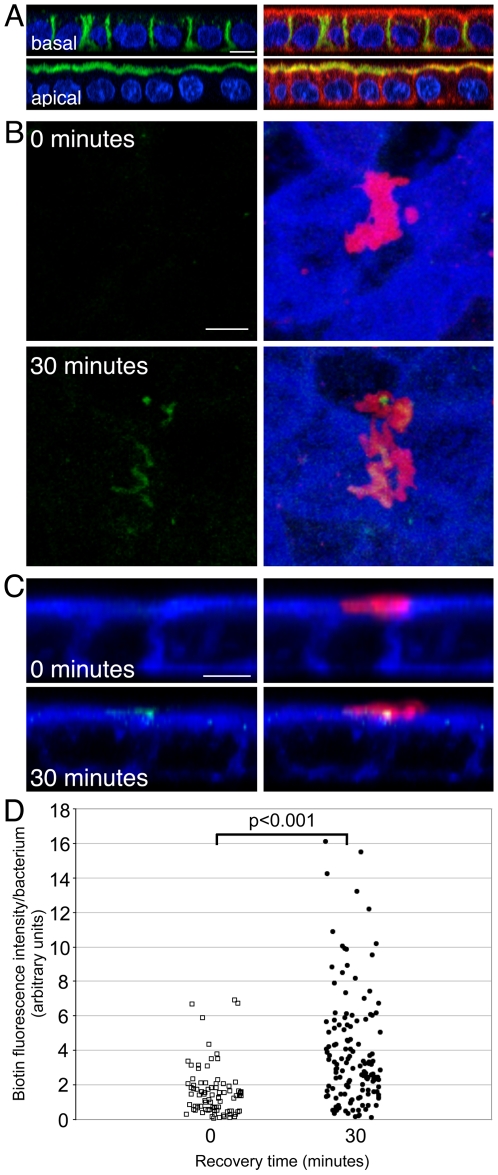
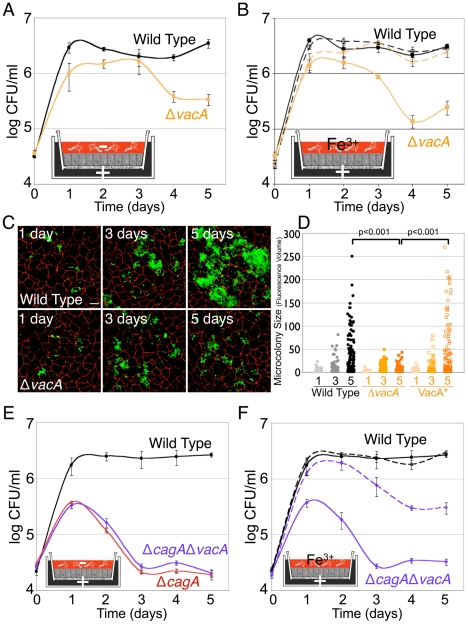
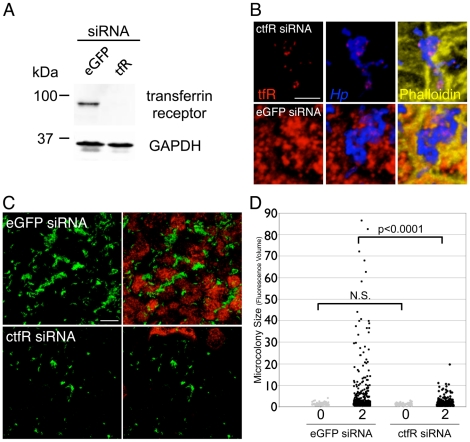
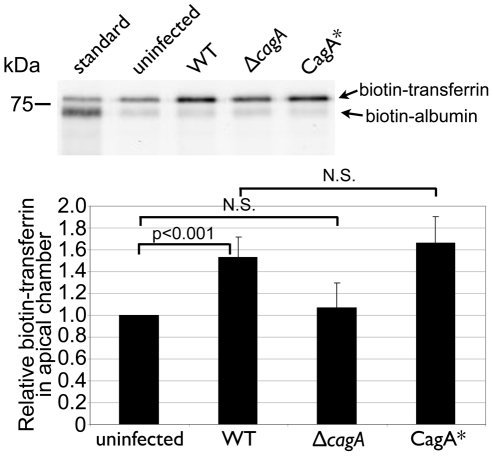
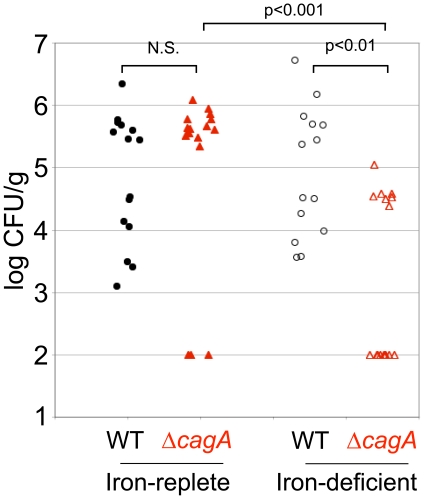
Helicobacter pylori (Hp) injects the CagA effector protein into host epithelial cells and induces growth factor-like signaling, perturbs cell-cell junctions, and alters host cell polarity. This enables Hp to grow as microcolonies adhered to the host cell surface even in conditions that do not support growth of free-swimming bacteria. We hypothesized that CagA alters host cell physiology to allow Hp to obtain specific nutrients from or across the epithelial barrier. Using a polarized epithelium model system, we find that isogenic ΔcagA mutants are defective in cell surface microcolony formation, but exogenous addition of iron to the apical medium partially rescues this defect, suggesting that one of CagA's effects on host cells is to facilitate iron acquisition from the host. Hp adhered to the apical epithelial surface increase basolateral uptake of transferrin and induce its transcytosis in a CagA-dependent manner. Both CagA and VacA contribute to the perturbation of transferrin recycling, since VacA is involved in apical mislocalization of the transferrin receptor to sites of bacterial attachment. To determine if the transferrin recycling pathway is involved in Hp colonization of the cell surface, we silenced transferrin receptor expression during infection. This resulted in a reduced ability of Hp to colonize the polarized epithelium. To test whether CagA is important in promoting iron acquisition in vivo, we compared colonization of Hp in iron-replete vs. iron-deficient Mongolian gerbils. While wild type Hp and ΔcagA mutants colonized iron-replete gerbils at similar levels, ΔcagA mutants are markedly impaired in colonizing iron-deficient gerbils. Our study indicates that CagA and VacA act in concert to usurp the polarized process of host cell iron uptake, allowing Hp to use the cell surface as a replicative niche.
Overview
The claims and statistics of this paper haven’t been checked yet.
Run the check — free, no account needed. It reads the open-access text and checks the sources it cites.
Integrity signals
Registry
Cites
Statistics
Figures
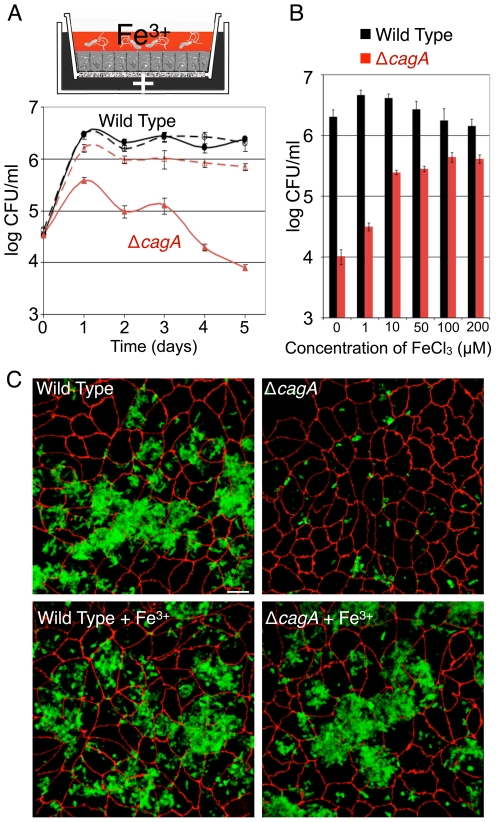
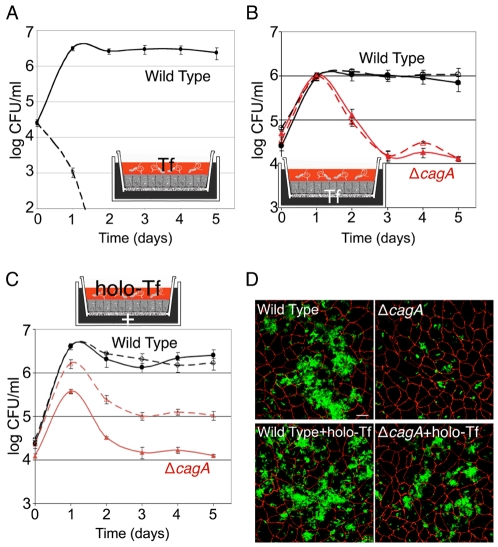
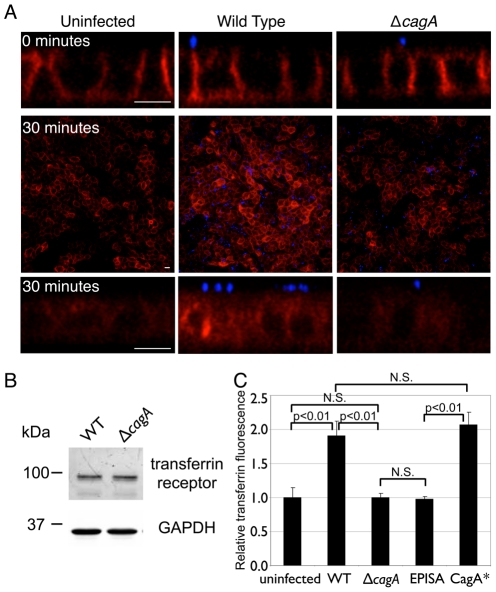
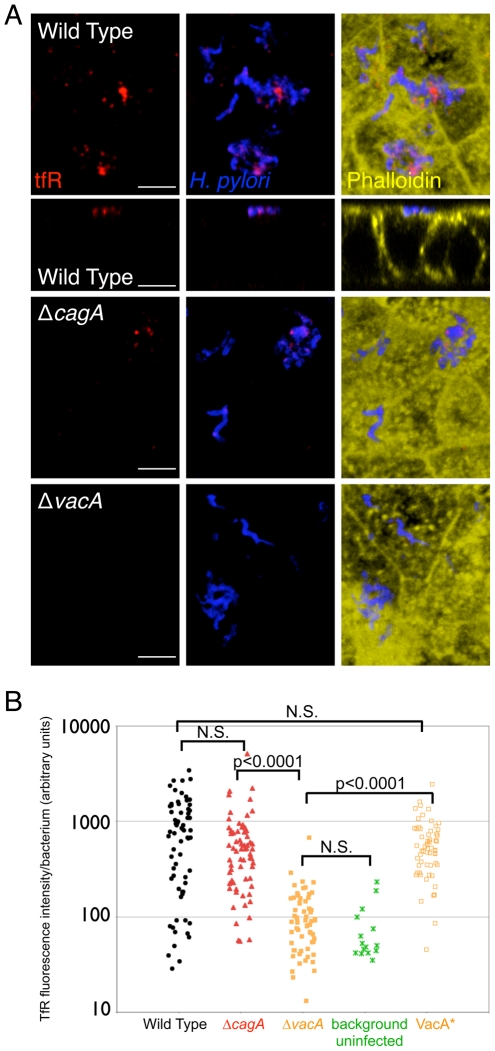
Verification
Claims the paper makes
The claims and statistics of this paper haven’t been checked yet.
Run the check — free, no account needed. It reads the open-access text and checks the sources it cites.
Claims other papers make about this one
Each is checked against this paper’s own text: does it say what the citing paper says it does?
In the citing paper
“H. pylori subsequently acquires iron from transferrin and reveals how H. pylori manipulates host iron metabolism under iron-deplete conditions to promote survival in the stomach.”
From The Impact of Dietary Transition Metals on Host-Bacterial Interactions (2018) · cites this paper as Tan et al., 2011
In the citing paper
“CagA causes the mislocalization of transferrin receptors from the basolateral membrane to the apical surface where the pathogen is located (Tan et al., 2011).”
From The Impact of Dietary Transition Metals on Host-Bacterial Interactions (2018) · cites this paper as Tan et al., 2011
In the citing paper
“H. pylori subsequently acquires iron from transferrin”
From The Impact of Dietary Transition Metals on Host-Bacterial Interactions (2018) · cites this paper as Tan et al., 2011
Self-check
Percentages, sums and reported differences re-computed from the paper’s own numbers.
The self-check needs the paper’s full text.
Citations
Cites
Malfertheiner, P., Mégraud, F., O'Morain, C. A., Bazzoli, F., El-Omar, E. M., Graham, D., Hunt, R. H., Rokkas, T., Vakil, N. B., Kuipers, E. J., et al. (2006) · Gut · doi:10.1136/gut.2006.101634 · Cited by 2,242
Mosaicism in Vacuolating Cytotoxin Alleles of Helicobacter pylori
Atherton, J. C., Cao, P., Peek, R. M., Tummuru, M. K. R., Blaser, M. J., & Cover, T. L. (1995) · Journal of Biological Chemistry · doi:10.1074/jbc.270.30.17771 · Cited by 1,564
Self-citationHelicobacter pylori Adhesin Binding Fucosylated Histo-Blood Group Antigens Revealed by Retagging
Ilver, D., Arnqvist, A., Ögren, J., Frick, I.-M., Kersulyte, D., Incecik, E. T., Berg, D. E., Covacci, A., Engstrand, L. G., & Borén, T. (1998) · Science · doi:10.1126/science.279.5349.373 · Cited by 1,225
SHP-2 Tyrosine Phosphatase as an Intracellular Target of Helicobacter pylori CagA Protein
Higashi, H., Tsutsumi, R., Muto, S., Sugiyama, T., Azuma, T., Asaka, M., & Hatakeyama, M. (2002) · Science · doi:10.1126/science.1067147 · Cited by 1,028
Helicobacter pylori SabA Adhesin in Persistent Infection and Chronic Inflammation
Mahdavi, J., Sondén, B., Hurtig, M., Olfat, F. O., Forsberg, L., Roche, N., Ångström, J., Larsson, T. P., Teneberg, S., Karlsson, K., et al. (2002) · Science · doi:10.1126/science.1069076 · Cited by 935
Lactoferrin: structure, function and applications
González‐Chávez, S. A., Arévalo‐Gallegos, S., & Rascón-Cruz, Q. (2008) · International Journal of Antimicrobial Agents · doi:10.1016/j.ijantimicag.2008.07.020 · Cited by 759
Disruption of the Epithelial Apical-Junctional Complex by Helicobacter pylori CagA
Amieva, M. R., Vogelmann, R., Covacci, A., Tompkins, L. S., Nelson, W. J., & Falkow, S. (2003) · Science · doi:10.1126/science.1081919 · Cited by 739
Self-citationThe serine protease TMPRSS6 is required to sense iron deficiency
Du, X., She, E., Gelbart, T., Truksa, J., Lee, P., Xia, Y., Khovananth, K., Mudd, S., Mann, N., Moresco, E. M. Y., et al. (2008) · Science · doi:10.1126/science.1157121 · Cited by 578
Organization of vesicular trafficking in epithelia
Rodriguez-Boulan, E., Kreitzer, G., & Müsch, A. (2005) · Nature Reviews Molecular Cell Biology · doi:10.1038/nrm1593 · Cited by 574
Helicobacter pylori VacA, a paradigm for toxin multifunctionality
Cover, T. L., & Blanke, S. R. (2005) · Nature Reviews Microbiology · doi:10.1038/nrmicro1095 · Cited by 569
Cited by
Sorted by citations
Pathobiology of Helicobacter pylori–Induced Gastric Cancer
Amieva, M. R., & Peek, R. M. (2015) · Gastroenterology · doi:10.1053/j.gastro.2015.09.004 · Cited by 907
Self-citationLife in the human stomach: persistence strategies of the bacterial pathogen Helicobacter pylori
Salama, N. R., Hartung, M. L., & Mueller, A. (2013) · Nature Reviews Microbiology · doi:10.1038/nrmicro3016 · Cited by 668
Helicobacter pylori CagA and Gastric Cancer: A Paradigm for Hit-and-Run Carcinogenesis
Hatakeyama, M. (2014) · Cell Host & Microbe · doi:10.1016/j.chom.2014.02.008 · Cited by 557
Helicobacter pylori and gastric cancer: mechanisms and new perspectives
Duan, Y., Xu, Y., Dou, Y., & Xu, D. (2025) · Journal of Hematology & Oncology · doi:10.1186/s13045-024-01654-2 · Cited by 311
Gastrointestinal biofilms in health and disease
Motta, J., Wallace, J. L., Buret, A. G., Deraison, C., & Vergnolle, N. (2021) · Nature Reviews Gastroenterology & Hepatology · doi:10.1038/s41575-020-00397-y · Cited by 291
HATAKEYAMA, M. (2017) · Proceedings of the Japan Academy Series B · doi:10.2183/pjab.93.013 · Cited by 261
Sigal, M. J., Rothenberg, M. E., Logan, C. Y., Lee, J. Y., Honaker, R. W., Cooper, R. L., Passarelli, B., Camorlinga, M., Bouley, D. M., Cabrera-Álvarez, G., et al. (2015) · Gastroenterology · doi:10.1053/j.gastro.2015.02.049 · Cited by 244
Self-citationAn Overview of Helicobacter pylori VacA Toxin Biology
Foegeding, N. J., Caston, R. R., McClain, M. S., Ohi, M. D., & Cover, T. L. (2016) · Toxins · doi:10.3390/toxins8060173 · Cited by 244
Helicobacter pylori Diversity and Gastric Cancer Risk
Cover, T. L. (2016) · mBio · doi:10.1128/mbio.01869-15 · Cited by 217
High Dietary Salt Intake Exacerbates Helicobacter pylori-Induced Gastric Carcinogenesis
Gaddy, J. A., Radin, J. N., Loh, J. T., Zhang, F., Washington, M. K., Peek, R. M., Algood, H. M. S., & Cover, T. L. (2013) · Infection and Immunity · doi:10.1128/iai.01271-12 · Cited by 209
Self-citationBackert, S., Tegtmeyer, N., & Fischer, W. H. (2015) · Future Microbiology · doi:10.2217/fmb.15.32 · Cited by 198
The Impact of Dietary Transition Metals on Host-Bacterial Interactions
Lopez, C. A., & Skaar, E. P. (2018) · Cell Host & Microbe · doi:10.1016/j.chom.2018.05.008 · Cited by 190
Iron deficiency accelerates Helicobacter pylori–induced carcinogenesis in rodents and humans
Noto, J. M., Gaddy, J. A., Lee, J. Y., Piazuelo, M. B., Friedman, D. B., Colvin, D. C., Romero-Gallo, J., Suarez, G., Loh, J., Slaughter, J. C., et al. (2013) · Journal of Clinical Investigation · doi:10.1172/jci64373 · Cited by 178
Self-citationChemodetection and Destruction of Host Urea Allows Helicobacter pylori to Locate the Epithelium
Huang, J. Y., Sweeney, E. G., Sigal, M. J., Zhang, H. C., Remington, S. J., Cantrell, M. A., Kuo, C. J., Guillemin, K. J., & Amieva, M. R. (2015) · Cell Host & Microbe · doi:10.1016/j.chom.2015.07.002 · Cited by 177
Self-citationBackert, S., Clyne, M., & Tegtmeyer, N. (2011) · Cell Communication and Signaling · doi:10.1186/1478-811x-9-28 · Cited by 174
Helicobacter pylori Vacuolating Toxin and Gastric Cancer
McClain, M. S., Beckett, A. C., & Cover, T. L. (2017) · Toxins · doi:10.3390/toxins9100316 · Cited by 148
Functional Plasticity in the Type IV Secretion System of Helicobacter pylori
Barrozo, R. M., Cooke, C. L., Hansen, L. M., Lam, A. M., Gaddy, J. A., Johnson, E., Cariaga, T. A., Suárez, G., Peek, R. M., Cover, T. L., et al. (2013) · PLoS Pathogens · doi:10.1371/journal.ppat.1003189 · Cited by 145
Self-citationThe Helicobacter pylori Cag Type IV Secretion System
Cover, T. L., Lacy, D. B., & Ohi, M. D. (2020) · Trends in Microbiology · doi:10.1016/j.tim.2020.02.004 · Cited by 154
Wroblewski, L. E., Piazuelo, M. B., Chaturvedi, R., Schumacher, M., Aihara, E., Feng, R., Noto, J. M., Delgado, A., Israel, D. A., Zavros, Y., et al. (2015) · Gut · doi:10.1136/gutjnl-2014-307650 · Cited by 143
Self-citationStein, S. C., Faber, E., Bats, S. H., Murillo, T., Speidel, Y., Coombs, N., & Josenhans, C. (2017) · PLoS Pathogens · doi:10.1371/journal.ppat.1006514 · Cited by 131
Helicobacter pylori in Gastric Carcinogenesis
Wroblewski, L. E., & Peek, R. M. (2013) · Gastroenterology Clinics of North America · doi:10.1016/j.gtc.2013.01.006 · Cited by 129
Self-citationIntoxication strategy of Helicobacter pylori VacA toxin
Boquet, P., & Ricci, V. (2012) · Trends in Microbiology · doi:10.1016/j.tim.2012.01.008 · Cited by 120
Chemorepulsion from the Quorum Signal Autoinducer-2 Promotes Helicobacter pylori Biofilm Dispersal
Anderson, J. K., Huang, J. Y., Wreden, C. C., Sweeney, E. G., Goers, J. W. F., Remington, S. J., & Guillemin, K. J. (2015) · mBio · doi:10.1128/mbio.00379-15 · Cited by 120
Structural Insights into Polymorphic ABO Glycan Binding by Helicobacter pylori
Moonens, K., Gideonsson, P., Subedi, S., Bugaytsova, J. A., Romão, E., Méndez, M., Nordén, J., Fallah, M., Rakhimova, L., Shevtsova, A. A., et al. (2016) · Cell Host & Microbe · doi:10.1016/j.chom.2015.12.004 · Cited by 113
Subversion of host kinases: a key network in cellular signaling hijacked by Helicobacter pylori CagA
Tegtmeyer, N., Neddermann, M., Asche, C. I., & Backert, S. (2017) · Molecular Microbiology · doi:10.1111/mmi.13707 · Cited by 111
Diet, microbial virulence, and Helicobacter pylori -induced gastric cancer
Cover, T. L., & Peek, R. M. (2013) · Gut Microbes · doi:10.4161/gmic.26262 · Cited by 109
Self-citationKim, I.-J., & Blanke, S. R. (2012) · Frontiers in Cellular and Infection Microbiology · doi:10.3389/fcimb.2012.00037 · Cited by 110
Fung, C., Tan, S., Nakajima, M., Skoog, E. C., Camarillo-Guerrero, L. F., Klein, J. A., Lawley, T. D., Solnick, J. V., Fukami, T., & Amieva, M. R. (2019) · PLoS Biology · doi:10.1371/journal.pbio.3000231 · Cited by 101
Self-citationMultiple Acid Sensors Control Helicobacter pylori Colonization of the Stomach
Huang, J. Y., Sweeney, E. G., Guillemin, K. J., & Amieva, M. R. (2017) · PLoS Pathogens · doi:10.1371/journal.ppat.1006118 · Cited by 91
Self-citationEpidemiology and role of Helicobacter pylori virulence factors in gastric cancer carcinogenesis
Sukri, A., Hanafiah, A., Zin, N. M., & Kosai, N. R. (2020) · Apmis · doi:10.1111/apm.13034 · Cited by 95
Polymorphism in the Helicobacter pylori CagA and VacA toxins and disease
Bridge, D. R., & Merrell, D. S. (2013) · Gut Microbes · doi:10.4161/gmic.23797 · Cited by 92
CagY Is an Immune-Sensitive Regulator of the Helicobacter pylori Type IV Secretion System
Barrozo, R. M., Hansen, L. M., Lam, A. M., Skoog, E. C., Martín, M. E., Cai, L. P., Lin, Y., Latoscha, A., Suerbaum, S., Canfield, D. R., et al. (2016) · Gastroenterology · doi:10.1053/j.gastro.2016.08.014 · Cited by 85
Commensal inter-bacterial interactions shaping the microbiota
Kern, L., Abdeen, S. K., Kolodziejczyk, A. A., & Elinav, E. (2021) · Current Opinion in Microbiology · doi:10.1016/j.mib.2021.07.011 · Cited by 82
Rizzato, C., Torres, J., Kasamatsu, E., Camorlinga‐Ponce, M., Bravo, M. M., Canzian, F., & Kato, I. (2019) · Frontiers in Microbiology · doi:10.3389/fmicb.2019.00846 · Cited by 83
Immunological Perspective: Helicobacter pylori Infection and Gastritis
Yang, H., & Hu, B. (2022) · Mediators of Inflammation · doi:10.1155/2022/2944156 · Cited by 90
The Helicobacter pylori cag pathogenicity island as a determinant of gastric cancer risk
Tran, S. C., Bryant, K. N., & Cover, T. L. (2024) · Gut Microbes · doi:10.1080/19490976.2024.2314201 · Cited by 80
Morgenthau, A., Pogoutse, A., Adamiak, P., Moraes, T. F., & Schryvers, A. B. (2013) · Future Microbiology · doi:10.2217/fmb.13.125 · Cited by 78
The adherens junctions control susceptibility to Staphylococcus aureus α-toxin
Popov, L. M., Marceau, C. D., Starkl, P. M., Lumb, J. H., Shah, J., Guerrera, D., Cooper, R. L., Merakou, C., Bouley, D. M., Meng, W., et al. (2015) · Proceedings of the National Academy of Sciences · doi:10.1073/pnas.1510265112 · Cited by 82
Self-citationWizenty, J., & Sigal, M. J. (2025) · Nature Reviews Gastroenterology & Hepatology · doi:10.1038/s41575-025-01042-2 · Cited by 86
Haley, K. P., Delgado, A. G., Piazuelo, M. B., Mortensen, B. L., Correa, P., Damo, S. M., Chazin, W. J., Skaar, E. P., & Gaddy, J. A. (2015) · Infection and Immunity · doi:10.1128/iai.00544-15 · Cited by 68
Structure of the Helicobacter pylori CagA oncoprotein bound to the human tumor suppressor ASPP2
Nes̆ić, D., Buti, L., Lü, X., & Stebbins, C. E. (2014) · Proceedings of the National Academy of Sciences · doi:10.1073/pnas.1320631111 · Cited by 67
Helicobacter pylori senses bleach (HOCl) as a chemoattractant using a cytosolic chemoreceptor
Perkins, A., Tudorica, D. A., Amieva, M. R., Remington, S. J., & Guillemin, K. J. (2019) · PLoS Biology · doi:10.1371/journal.pbio.3000395 · Cited by 61
Self-citationHelicobacter pylori in the Oral Cavity: Current Evidence and Potential Survival Strategies
Zhang, L., Chen, X., Ren, B., Zhou, X., & Cheng, L. (2022) · International Journal of Molecular Sciences · doi:10.3390/ijms232113646 · Cited by 65
Pich, Ò. Q., & Merrell, D. S. (2013) · Future Microbiology · doi:10.2217/fmb.13.43 · Cited by 64
Hathroubi, S., Hu, S., & Ottemann, K. M. (2020) · npj Biofilms and Microbiomes · doi:10.1038/s41522-020-00167-3 · Cited by 60
Helicobacter pylori shows tropism to gastric differentiated pit cells dependent on urea chemotaxis
Aguilar, C., Paužuolis, M., Pompaiah, M., Vafadarnejad, E., Arampatzi, P., Fischer, M., Narres, D., Neyazi, M., Kayisoglu, Ö., Sell, T., et al. (2022) · Nature Communications · doi:10.1038/s41467-022-33165-4 · Cited by 56
Pathogenesis of H elicobacter pylori Infection
Delahay, R. M., & Rugge, M. (2012) · Helicobacter · doi:10.1111/j.1523-5378.2012.00976.x · Cited by 53
Unintended consequences of Helicobacter pylori infection in children in developing countries
Queiroz, D. M. M., Rocha, A. M., & Crabtree, J. E. (2013) · Gut Microbes · doi:10.4161/gmic.26277 · Cited by 55
Pich, Ò. Q., Carpenter, B. M., Gilbreath, J. J., & Merrell, D. S. (2012) · Molecular Microbiology · doi:10.1111/j.1365-2958.2012.08066.x · Cited by 47
Targeting the Mucosal Barrier: How Pathogens Modulate the Cellular Polarity NetworkPreprint
Ruch, T. R., & Engel, J. N. (2017) · Cold Spring Harbor Perspectives in Biology · doi:10.1101/cshperspect.a027953 · Cited by 47
Helicobacter and Salmonella Persistent Infection StrategiesPreprint
Monack, D. M. (2013) · Cold Spring Harbor Perspectives in Medicine · doi:10.1101/cshperspect.a010348 · Cited by 44
Jones, T. A., Hernandez, D. Z., Wong, Z. C., Wandler, A. M., & Guillemin, K. J. (2017) · PLoS Pathogens · doi:10.1371/journal.ppat.1006631 · Cited by 47
Natural History of Helicobacter pylori Infection in Mexican Schoolchildren
Duque, X., Vilchis‐Gil, J., Mera, R. M., Valdivia, B. T., Goodman, K. J., Mendoza, E., Navarro, F., Roque-Evangelista, V., Morán, S., Torres, J., et al. (2012) · Journal of Pediatric Gastroenterology and Nutrition · doi:10.1097/mpg.0b013e318248877f · Cited by 43
Helicobacter pylori-associated hypochlorhydria in children, and development of iron deficiency
Harris, P. R., Serrano, C. A., Villagrán, A., Walker, M. M., Thomson, M. J., Duarte, I., Windle, H. J., & Crabtree, J. E. (2012) · Journal of Clinical Pathology · doi:10.1136/jclinpath-2012-201243 · Cited by 43
Extracellular vesicles promote transkingdom nutrient transfer during viral-bacterial co-infection
Hendricks, M. R., Lane, S., Melvin, J. A., Ouyang, Y., Stolz, D. B., Williams, J. V., Sadovsky, Y., & Bomberger, J. M. (2021) · Cell Reports · doi:10.1016/j.celrep.2020.108672 · Cited by 41
The CagA toxin of Helicobacter pylori: abundant production but relatively low amount translocated
Soto, L. F. J., & Haas, R. (2016) · Scientific Reports · doi:10.1038/srep23227 · Cited by 39
Iron trafficking system in Helicobacter pylori
Ge, R., & Sun, X. (2011) · BioMetals · doi:10.1007/s10534-011-9512-8 · Cited by 39
Gastric Helicobacter Infection Induces Iron Deficiency in the INS-GAS Mouse
Thomson, M. J., Pritchard, D. M., Boxall, S., Abuderman, A. A., Williams, J. M., Varró, A., & Crabtree, J. E. (2012) · PLoS ONE · doi:10.1371/journal.pone.0050194 · Cited by 38
Metalloregulation of Helicobacter pylori physiology and pathogenesis
Haley, K. P., & Gaddy, J. A. (2015) · Frontiers in Microbiology · doi:10.3389/fmicb.2015.00911 · Cited by 38
A Repeat-Associated Small RNA Controls the Major Virulence Factors of Helicobacter pylori
Eisenbart, S. K., Alzheimer, M., Pernitzsch, S. R., Dietrich, S., Stahl, S., & Sharma, C. M. (2020) · Molecular Cell · doi:10.1016/j.molcel.2020.09.009 · Cited by 42
Raghwan, & Chowdhury, R. (2013) · Helicobacter · doi:10.1111/hel.12087 · Cited by 37
Burns, M. A., Muthupalani, S., Ge, Z., Wang, T. C., Bakthavatchalu, V., Cunningham, C. J., Ennis, K., Georgieff, M., & Fox, J. G. (2015) · PLoS ONE · doi:10.1371/journal.pone.0142630 · Cited by 37
Haley, K. P., & Gaddy, J. A. (2016) · Gastroenterology Research and Practice · doi:10.1155/2016/3019362 · Cited by 35
Behrens, W., Schweinitzer, T., Bal, J., Dorsch, M. M., Bleich, A., Kops, F., Brenneke, B., Didelot, X., Suerbaum, S., & Josenhans, C. (2013) · Infection and Immunity · doi:10.1128/iai.00750-13 · Cited by 34
Kersulyte, D., Rossi, M., & Berg, D. E. (2013) · PLoS ONE · doi:10.1371/journal.pone.0083177 · Cited by 33
Skoog, E. C., Morikis, V. A., Martín, M. E., Foster, G. A., Cai, L. P., Hansen, L. M., Li, B., Gaddy, J. A., Simon, S. I., & Solnick, J. V. (2018) · mBio · doi:10.1128/mbio.00717-18 · Cited by 35
Activity and Functional Importance of Helicobacter pylori Virulence Factors
Sgouras, D. N., Tegtmeyer, N., & Weßler, S. (2019) · Advances in experimental medicine and biology · doi:10.1007/5584_2019_358 · Cited by 32
New Advances in Nano-Drug Delivery Systems: Helicobacter pylori and Gastric Cancer
Zhu, X. Y., Su, T., Wang, S., Zhou, H.-Q., & Shi, W. (2022) · Frontiers in Oncology · doi:10.3389/fonc.2022.834934 · Cited by 31
Yokota, S., Toita, N., Yamamoto, S., Fujii, N., & Konno, M. (2012) · Helicobacter · doi:10.1111/hel.12011 · Cited by 31
Avilés‐Jiménez, F., Reyes-León, A., Nieto-Patlán, E., Hansen, L. M., Burgueño, J. A., Ramos, I., Camorlinga‐Ponce, M., Bermúdez, H., Blancas, J. M., Cabrera, L., et al. (2011) · Infection and Immunity · doi:10.1128/iai.05845-11 · Cited by 32
Alterations in Helicobacter pylori Triggered by Contact with Gastric Epithelial Cells
Johnson, E., Gaddy, J. A., & Cover, T. L. (2012) · Frontiers in Cellular and Infection Microbiology · doi:10.3389/fcimb.2012.00017 · Cited by 30
Saberi, S., Douraghi, M., Azadmanesh, K., Shokrgozar, M. A., Zeraati, H., Hosseini, M. E., Mohagheghi, M. A., Parsaeian, M., & Mohammadi, M. (2012) · Helicobacter · doi:10.1111/j.1523-5378.2012.00954.x · Cited by 30
Hansen, L. M., Gideonsson, P., Canfield, D. R., Borén, T., & Solnick, J. V. (2017) · Infection and Immunity · doi:10.1128/iai.00094-17 · Cited by 30
Kronsteiner, B., Bassaganya-Riera, J., Philipson, N., & Hontecillas, R. (2014) · Gut Microbes · doi:10.4161/gmic.28899 · Cited by 29
The Mongolian Gerbil: A Robust Model of Helicobacter pylori-Induced Gastric Inflammation and Cancer
Noto, J. M., Romero–Gallo, J., Piazuelo, M. B., & Peek, R. M. (2016) · Methods in molecular biology · doi:10.1007/978-1-4939-3603-8_24 · Cited by 29
Self-citationMechanisms and Regulation of Intestinal Iron Transport
Collins, J. F., Flores, S. R., Wang, X., & Anderson, G. J. (2018) · Elsevier eBooks · doi:10.1016/b978-0-12-809954-4.00060-8 · Cited by 30
Nishikawa, H., Hayashi, T., Arisaka, F., Senda, T., & Hatakeyama, M. (2016) · Scientific Reports · doi:10.1038/srep30031 · Cited by 30
Helicobacter pylori infection perturbs iron homeostasis in gastric epithelial cells
Flores, S. E., Aitchison, A., Day, A. S., & Keenan, J. I. (2017) · PLoS ONE · doi:10.1371/journal.pone.0184026 · Cited by 28
Regulation ofHelicobacter pyloriVirulence Within the Context of Iron Deficiency
Noto, J. M., Lee, J. Y., Gaddy, J. A., Cover, T. L., Amieva, M. R., & Peek, R. M. (2014) · The Journal of Infectious Diseases · doi:10.1093/infdis/jiu805 · Cited by 27
Self-citationBacterial cyclomodulins: types and roles in carcinogenesis
Morgan, R. N., Saleh, S. E., Farrag, H. A., & Aboulwafa, M. (2021) · Critical Reviews in Microbiology · doi:10.1080/1040841x.2021.1944052 · Cited by 27
Mohammadzadeh, R., Menbari, S., Pishdadian, A., & Farsiani, H. (2023) · Expert Reviews in Molecular Medicine · doi:10.1017/erm.2023.17 · Cited by 28
Donczew, R., Makowski, Ł., Jaworski, P., Bezulska‐Ditkowska, M., Nowaczyk, M., Zakrzewska‐Czerwińska, J., & Zawilak-Pawlik, A. M. (2014) · Molecular Microbiology · doi:10.1111/mmi.12866 · Cited by 28
The Human Stomach in Health and Disease: Infection Strategies by Helicobacter pylori
Robinson, K., Letley, D. P., & Kaneko, K. (2017) · Current topics in microbiology and immunology · doi:10.1007/978-3-319-50520-6_1 · Cited by 27
Genetic Manipulation of Helicobacter pylori Virulence Function by Host Carcinogenic Phenotypes
Suárez, G., Romero–Gallo, J., Sierra, J. C., Piazuelo, M. B., Krishna, U. S., Zuleta, M. A. G., Wilson, K. T., & Peek, R. M. (2017) · Cancer Research · doi:10.1158/0008-5472.can-16-2922 · Cited by 27
Self-citationThe Role of Adhesion in Helicobacter pylori Persistent Colonization
Yang, H., Wang, L., Zhang, M., & Hu, B. (2023) · Current Microbiology · doi:10.1007/s00284-023-03264-6 · Cited by 26
Lin, A. S., McClain, M. S., Beckett, A. C., Caston, R. R., Harvey, M. L., Dixon, B. R. E. A., Campbell, A. M., Shuman, J. H. B., Sawhney, N., Delgado, A. G., et al. (2020) · mBio · doi:10.1128/mbio.01296-20 · Cited by 25
Jang, S., Hansen, L. M., Su, H., Solnick, J. V., & Cha, J. (2022) · Gut Microbes · doi:10.1080/19490976.2022.2044721 · Cited by 25
Helicobacter pylori: Genomic Insight into the Host-Pathogen Interaction
Haley, K. P., & Gaddy, J. A. (2015) · International Journal of Genomics · doi:10.1155/2015/386905 · Cited by 26
Dyer, V., Brüggemann, H., Soerensen, M., Kühl, A. A., Hoffman, K., Brinkmann, V., Reinés, M., Zimmerman, S., Meyer, T. F., & Koch, M. (2018) · Molecular Microbiology · doi:10.1111/mmi.14123 · Cited by 23
Kassa, E. G., Zlotkin‐Rivkin, E., Friedman, G., Ramachandran, R. P., Melamed‐Book, N., Weiss, A. M., Belenky, M. A., Reichmann, D., Breuer, W. V., Pal, R. R., et al. (2019) · PLoS Pathogens · doi:10.1371/journal.ppat.1007851 · Cited by 23
Pirzadeh, M., Khalili, N., & Rezaei, N. (2020) · International Reviews of Immunology · doi:10.1080/08830185.2020.1851371 · Cited by 20
Targeting bacterial transferrin and lactoferrin receptors for vaccines
Schryvers, A. B. (2022) · Trends in Microbiology · doi:10.1016/j.tim.2022.01.017 · Cited by 20
Measurement of total iron in Helicobacter pylori-infected gastric epithelial cells
Flores, S. E., Day, A. S., & Keenan, J. I. (2014) · BioMetals · doi:10.1007/s10534-014-9810-z · Cited by 20
Responses of gastric epithelial stem cells and their niche to Helicobacter pylori infection
Wizenty, J., Tacke, F., & Sigal, M. J. (2020) · Annals of Translational Medicine · doi:10.21037/atm.2020.02.178 · Cited by 20
Estibariz, I., Ailloud, F., Woltemate, S., Bunk, B., Spröer, C., Overmann, J., Aebischer, T., Meyer, T. F., Josenhans, C., & Suerbaum, S. (2020) · mBio · doi:10.1128/mbio.01803-20 · Cited by 20
Asl, D. H., Farivar, T. N., Rahmani, B., Hajmanoochehri, F., Razavi, À. E., Jahanbin, B., Dodaran, M. S., & Peymani, A. (2018) · Microbial Pathogenesis · doi:10.1016/j.micpath.2018.10.039 · Cited by 18
Burns, M. A., Amaya, A., Winn, C. B., Ge, Z., Bakthavatchalu, V., Ennis, K., Wang, T. C., Georgieff, M., & Fox, J. G. (2017) · PLoS ONE · doi:10.1371/journal.pone.0173108 · Cited by 18
Identification of genetic modifiers of CagA-induced epithelial disruption in Drosophila
Reid, D. W., Muyskens, J. B., Neal, J. T., Gaddini, G. W., Cho, L. Y., Wandler, A. M., Botham, C. M., & Guillemin, K. (2012) · Front. Cell. Inf. Microbio. · doi:10.3389/fcimb.2012.00024 · Cited by 14
Lettl, C., Haas, R., & Fischer, W. H. (2021) · Molecular Microbiology · doi:10.1111/mmi.14772 · Cited by 16
Pu, S., Zhuang, Z., Liu, N., Luo, Q., & Zhang, D. (2025) · Frontiers in Microbiology · doi:10.3389/fmicb.2025.1552630 · Cited by 15
Metadata
- Authors
- Tan, S., Noto, J. M., Romero-Gallo, J., Peek, R. M., & Amieva, M. R.
- Affiliations
- Stanford University (US)
- Vanderbilt University (US)
- Corresponding author
- Amieva, Manuel R.
- Venue
- PLoS Pathogens
- Publisher
- Public Library of Science (PLoS)
- Published
- 2011-05-12
- Volume
- 7
- Issue
- 5
- Pages
- e1002050
- ISSN
- 1553-7366 (ISSN-L)
- 1553-7374
- PMC
- PMC3093365
- OpenAlex
- W2079054594
- Cited by
- 175
- References
- 95
- Citations by year
- 2026: 8 · 2025: 8 · 2024: 4 · 2023: 6 · 2022: 9 · 2021: 14 · 2020: 15 · 2019: 8 · 2018: 8 · 2017: 15 · 2016: 17 · 2015: 17 · 2014: 12 · 2013: 18 · 2012: 13
- FWCI
- 15.07
- Type
- journal article
- Language
- en
- Open access
- gold
- doi.org
- Locations
- PLoS Pathogens (publishedVersion, cc-by)
- PubMed Central (publishedVersion, cc-by)
- PubMed (publishedVersion)
- DOAJ (DOAJ: Directory of Open Access Journals) (submittedVersion, cc-by-sa)
- Figshare (submittedVersion, cc-by)
- Funders
- National Institutes of Health (CA-77955)
- National Cancer Institute (R29CA077955, CA 92229, CA-77955, CA116837, R01CA092229, R01CA077955)
- National Institute of Allergy and Infectious Diseases (R01AI038459, AI038459)
- National Institute of Diabetes and Digestive and Kidney Diseases (R01DK058587, DK-58587)
- Topics
- Health Sciences › Medicine › Gastroenterology › Helicobacter pylori-related gastroenterology studies
- Health Sciences › Medicine › Gastroenterology › Gastrointestinal motility and disorders
- Health Sciences › Medicine › Hematology › Iron Metabolism and Disorders
- Keywords
- Helicobacter pylori, CagA, VacA, iron acquisition, transferrin, transferrin receptor, transcytosis, iron trafficking, host-pathogen interaction, iron deficiency, Mongolian gerbil, bacterial effector proteins
- MeSH terms
- Adaptation, Physiological, Animals, Antigens, Bacterial, Bacterial Adhesion, Bacterial Proteins, Cell Line, Cell Membrane, Dogs, Epithelium, Gastric Mucosa, Gerbillinae, Humans, Intercellular Junctions, Iron, Receptors, Transferrin, Transferrin, Signal Transduction, Down-Regulation, Helicobacter pylori, Helicobacter Infections, Cell Polarity, Sequence Deletion, Caco-2 Cells, Transcytosis
About these checks
Registry, retraction, Cites and statistics results are computed, not judged, with one exception: a printed reference that no index lists is read once by a model before it counts as a citation error. Claims are extracted by a model and kept only when their quote appears verbatim in the text; each cited source is then checked, with a model’s help, for whether it says what the claim relies on. Those verdicts can be wrong — read the claim’s quote and the cited source before relying on one.
Statistics and arithmetic are recomputed, not judged.
Confidence bands are shown only for fields calibrated on our annotated test set. None is calibrated yet, so no band is shown.
What counts as a claim ›How we measure confidence ›How we check this ›
Are you an author, or do you see a problem with this page? Request a review
