

The DOI matches its Crossref record; 63 of the 63 references it cites were found in a registry or an index.
Identification of Host-Targeted Small Molecules That Restrict Intracellular Mycobacterium tuberculosis Growth
Open accessAbstract
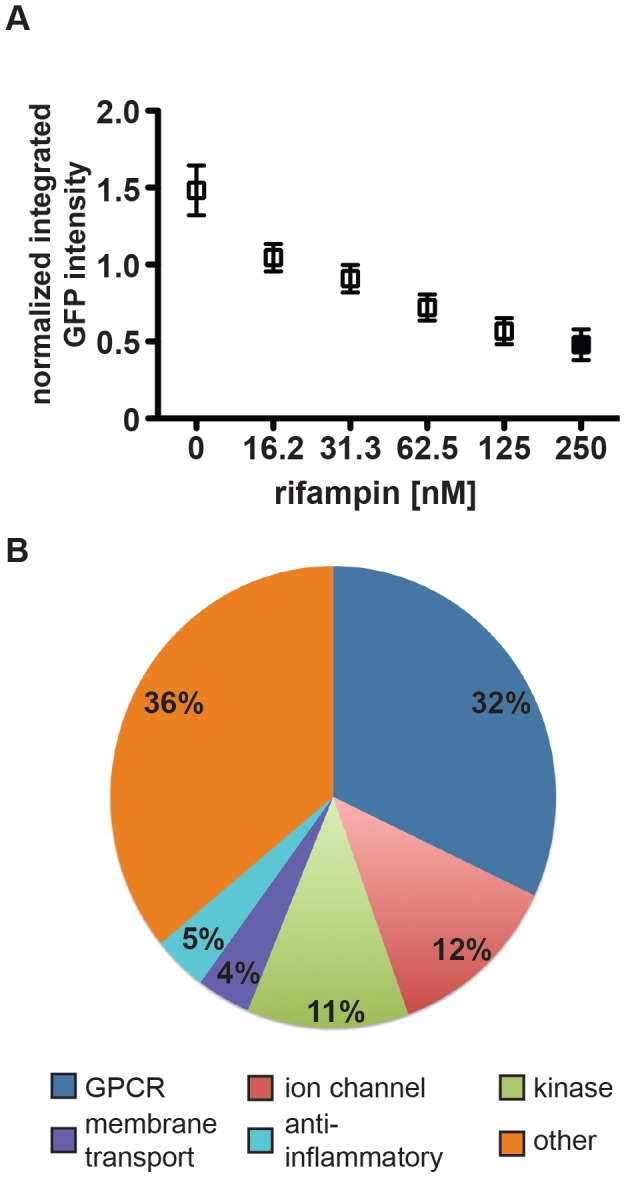
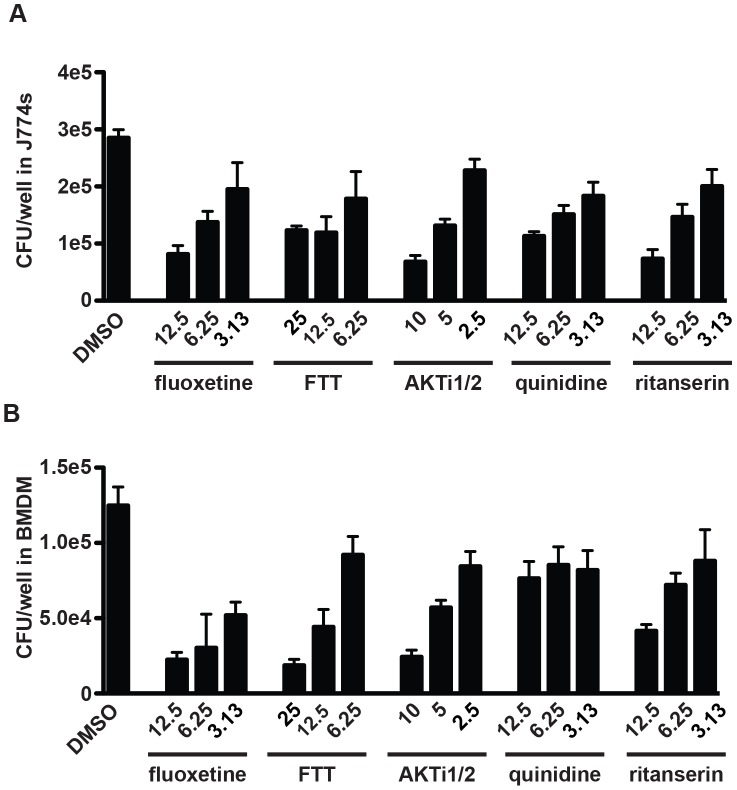
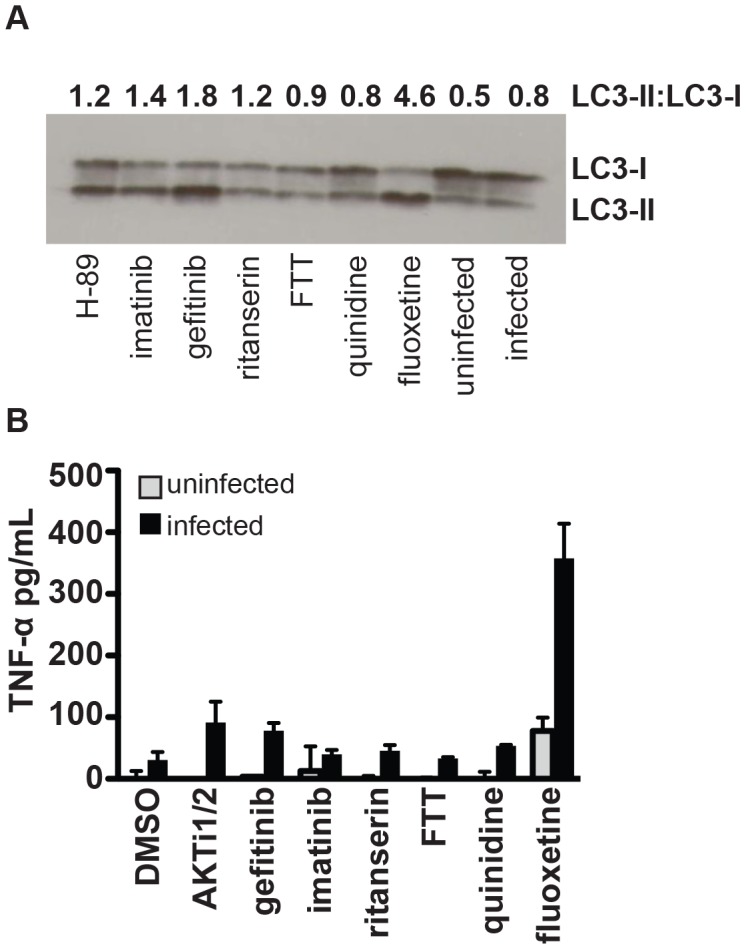
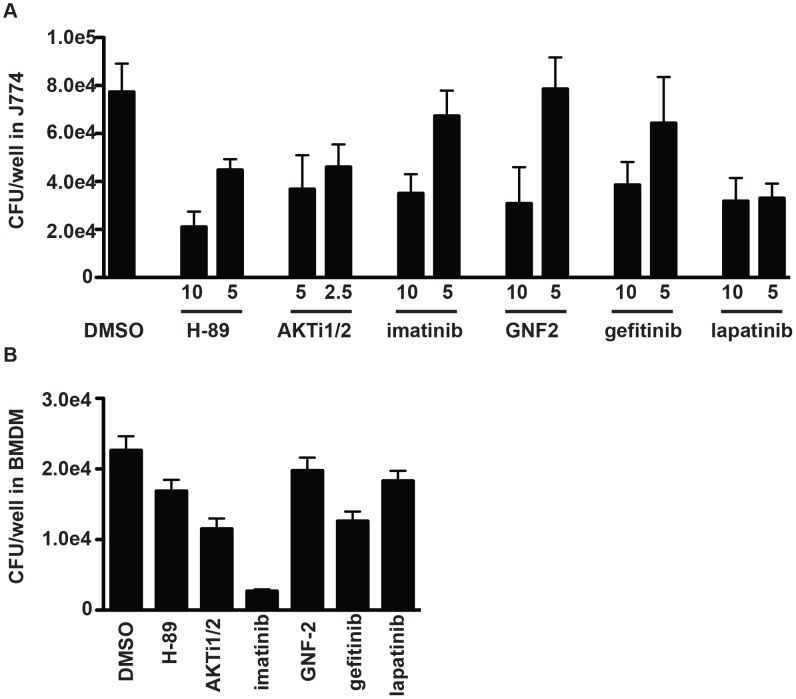
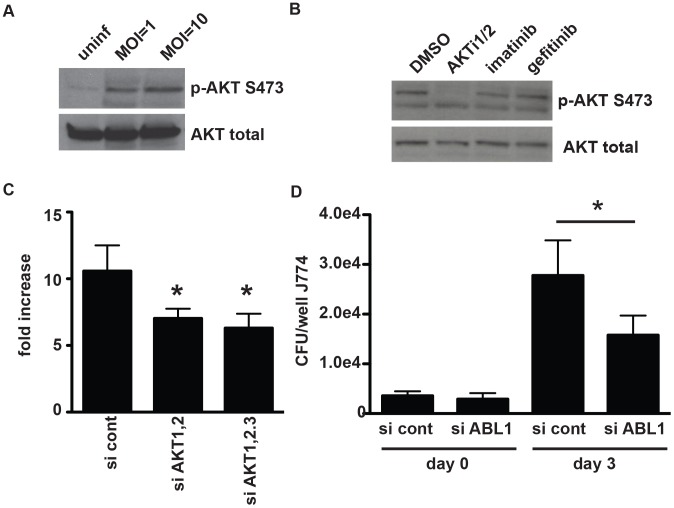
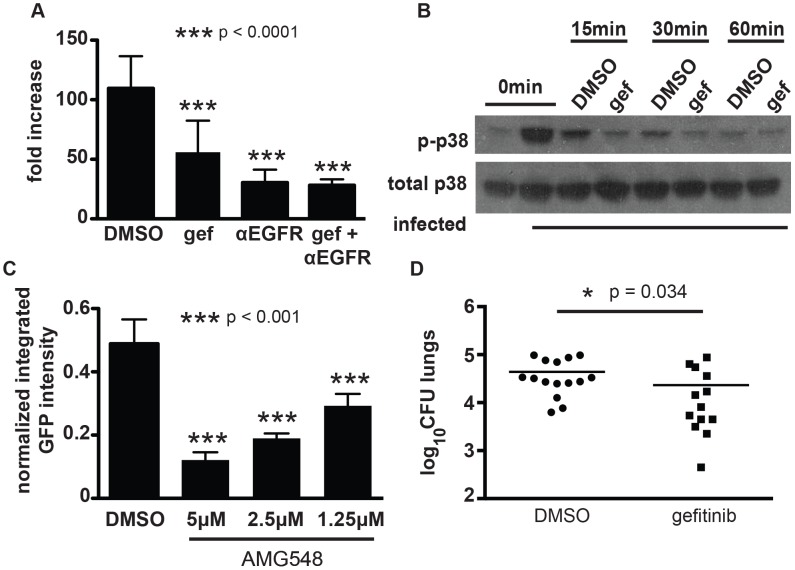
Mycobacterium tuberculosis remains a significant threat to global health. Macrophages are the host cell for M. tuberculosis infection, and although bacteria are able to replicate intracellularly under certain conditions, it is also clear that macrophages are capable of killing M. tuberculosis if appropriately activated. The outcome of infection is determined at least in part by the host-pathogen interaction within the macrophage; however, we lack a complete understanding of which host pathways are critical for bacterial survival and replication. To add to our understanding of the molecular processes involved in intracellular infection, we performed a chemical screen using a high-content microscopic assay to identify small molecules that restrict mycobacterial growth in macrophages by targeting host functions and pathways. The identified host-targeted inhibitors restrict bacterial growth exclusively in the context of macrophage infection and predominantly fall into five categories: G-protein coupled receptor modulators, ion channel inhibitors, membrane transport proteins, anti-inflammatories, and kinase modulators. We found that fluoxetine, a selective serotonin reuptake inhibitor, enhances secretion of pro-inflammatory cytokine TNF-α and induces autophagy in infected macrophages, and gefitinib, an inhibitor of the Epidermal Growth Factor Receptor (EGFR), also activates autophagy and restricts growth. We demonstrate that during infection signaling through EGFR activates a p38 MAPK signaling pathway that prevents macrophages from effectively responding to infection. Inhibition of this pathway using gefitinib during in vivo infection reduces growth of M. tuberculosis in the lungs of infected mice. Our results support the concept that screening for inhibitors using intracellular models results in the identification of tool compounds for probing pathways during in vivo infection and may also result in the identification of new anti-tuberculosis agents that work by modulating host pathways. Given the existing experience with some of our identified compounds for other therapeutic indications, further clinically-directed study of these compounds is merited.
Overview
The claims and statistics of this paper haven’t been checked yet.
Run the check — free, no account needed. It reads the open-access text and checks the sources it cites.
Integrity signals
Registry
Cites
Statistics
Figures
Verification
Claims the paper makes
The claims and statistics of this paper haven’t been checked yet.
Run the check — free, no account needed. It reads the open-access text and checks the sources it cites.
Claims other papers make about this one
Each is checked against this paper’s own text: does it say what the citing paper says it does?
In the citing paper
“Specifically, fluoxetine, a selective serotoine re-uptake inhibitor, and gefitinib, an inhibitor of epidermal growth factor receptor (EGFR) activity stimulated autophagy and reduced intra-macrophage survival of M. tuberculosis.”
From Macrophage defense mechanisms against intracellular bacteria (2015) · cites this paper as [80]
In the citing paper
“The effect of gefitinib could be traced back to blockade of EGFR mediated p38-MAPK activation, a known inhibitory pathway of autophagy (80).”
From Macrophage defense mechanisms against intracellular bacteria (2015) · cites this paper as [80]
Self-check
Percentages, sums and reported differences re-computed from the paper’s own numbers.
The self-check needs the paper’s full text.
Citations
Cites
CellProfiler: image analysis software for identifying and quantifying cell phenotypes
Carpenter, A. E., Jones, T. R., Lamprecht, M. R., Clarke, C., Kang, I. H., Friman, O., Guertin, D. A., Chang, J. H., Lindquist, R. A., Moffat, J., et al. (2006) · Genome biology · doi:10.1186/gb-2006-7-10-r100 · Cited by 5,212
Self-citationTuberculosis Associated with Infliximab, a Tumor Necrosis Factor α–Neutralizing Agent
Keane, J., Gershon, S. K., Wise, R. P., Mirabile‐Levens, E., Kasznica, J. M., Schwieterman, W. D., Siegel, J. N., & Braun, M. M. (2001) · New England Journal of Medicine · doi:10.1056/nejmoa011110 · Cited by 3,683
Mechanism of activation of protein kinase B by insulin and IGF‐1.
Alessi, D. R., Andjelković, M., Caudwell, B., Cron, P. D., MORRICE, N. A., Cohen, P., & Hemmings, B. A. (1996) · The EMBO Journal · doi:10.1002/j.1460-2075.1996.tb01045.x · Cited by 3,014
Peyron, P., Vaubourgeix, J., Poquet, Y., Levillain, F., Botanch, C., Bardou, F., Daffé, M., Emile, J.-F., Marchou, B., Cardona, P.-J., et al. (2008) · PLoS Pathogens · doi:10.1371/journal.ppat.1000204 · Cited by 751
Gardam, M. A., Keystone, E. C., Menzies, R., Manners, S., Skamene, E., Long, R., & Vinh, D. C. (2003) · The Lancet Infectious Diseases · doi:10.1016/s1473-3099(03)00545-0 · Cited by 742
Discovery of Q203, a potent clinical candidate for the treatment of tuberculosis
Pethe, K., Bifani, P. J., Jang, J., Kang, S., Park, S., Ahn, S., Jiřiček, J., Jung, J., Jeon, H. K., Cechetto, J. D., et al. (2013) · Nature Medicine · doi:10.1038/nm.3262 · Cited by 601
Roca, F. J., & Ramakrishnan, L. (2013) · Cell · doi:10.1016/j.cell.2013.03.022 · Cited by 592
Host Genotype-Specific Therapies Can Optimize the Inflammatory Response to Mycobacterial Infections
Tobin, D. M., Roca, F. J., Oh, S. F., McFarland, R., Vickery, T. W., Ray, J. P., Ko, D. C., Zou, Y., Bang, N. D., Chau, T. T. H., et al. (2012) · Cell · doi:10.1016/j.cell.2011.12.023 · Cited by 583
Linezolid for Treatment of Chronic Extensively Drug-Resistant Tuberculosis
Lee, M., Lee, J., Carroll, M. W., Choi, H., Min, S., Song, T., Via, L. E., Goldfeder, L. C., Kang, E., Jin, B., et al. (2012) · New England Journal of Medicine · doi:10.1056/nejmoa1201964 · Cited by 557
Drug Tolerance in Replicating Mycobacteria Mediated by a Macrophage-Induced Efflux Mechanism
Adams, K. N., Takaki, K. K., Connolly, L. E., Wiedenhoft, H., Winglee, K., Humbert, O., Edelstein, P. H., Cosma, C. L., & Ramakrishnan, L. (2011) · Cell · doi:10.1016/j.cell.2011.02.022 · Cited by 522
Mycobacterium tuberculosis Prevents Inflammasome Activation
Master, S. S., Rampini, S. K., Davis, A. S., Keller, C., Ehlers, S., Springer, B., Timmins, G. S., Sander, P., & Deretic, V. P. (2008) · Cell Host & Microbe · doi:10.1016/j.chom.2008.03.003 · Cited by 428
The BCR-ABL Story: Bench to Bedside and Back
Wong, S., & Witte, O. N. (2004) · Annual Review of Immunology · doi:10.1146/annurev.immunol.22.012703.104753 · Cited by 410
Barnett, S. F., Defeo-Jones, D., Fu, S., Hancock, P. J., Haskell, K., Jones, R. E., Kahana, J. A., Kral, A. M., Leander, K. R., LEE, L. L., et al. (2005) · Biochemical Journal · doi:10.1042/bj20041140 · Cited by 398
Chen, M., Divangahi, M., Gan, H., Shin, D. S., Hong, S., Lee, D. M., Serhan, C. N., Behar, S. M., & Remold, H. G. (2008) · The Journal of Experimental Medicine · doi:10.1084/jem.20080767 · Cited by 352
Kumar, D., Nath, L., Kamal, M. A., Varshney, A., Jain, A., Singh, S., & Rao, K. V. S. (2010) · Cell · doi:10.1016/j.cell.2010.02.012 · Cited by 347
Shin, D.-M., Jeon, B., Lee, H., Jin, H. S., Yuk, J., Song, C., Lee, S. H., Lee, Z.-W., Cho, S.-N., Kim, J., et al. (2010) · PLoS Pathogens · doi:10.1371/journal.ppat.1001230 · Cited by 345
Eierhoff, T., Hrincius, E. R., Rescher, U., Ludwig, S., & Ehrhardt, C. (2010) · PLoS Pathogens · doi:10.1371/journal.ppat.1001099 · Cited by 340
Christophe, T., Jackson, M., Jeon, H. K., Fenistein, D., Contreras-Domínguez, M., Kim, J. C., Genovesio, A., Carralot, J., Ewann, F., Kim, E. H., et al. (2009) · PLoS Pathogens · doi:10.1371/journal.ppat.1000645 · Cited by 325
Survival of Mycobacteria in Macrophages Is Mediated by Coronin 1-Dependent Activation of Calcineurin
Jayachandran, R., Sundaramurthy, V., Combaluzier, B., Mueller, P., Korf, H., Huygen, K., Miyazaki, T., Albrecht, I., Massner, J., & Pieters, J. (2007) · Cell · doi:10.1016/j.cell.2007.04.043 · Cited by 310
Deretic, V. P., Singh, S., Master, S. S., Harris, J., Roberts, E. A., Kyei, G. B., Davis, A., Haro, S. A. D., Naylor, J., Lee, H.-H., et al. (2006) · Cellular Microbiology · doi:10.1111/j.1462-5822.2006.00705.x · Cited by 310
Intracellular bacterial growth is controlled by a kinase network around PKB/AKT1
Kuijl, C. P., Savage, N. D. L., Marsman, M., Tuin, A. W., Janssen, L., Egan, D. A., Ketema, M., van den Nieuwendijk, R., van den Eeden, S. J. F., Geluk, A., et al. (2007) · Nature · doi:10.1038/nature06345 · Cited by 306
Singh, V., Jamwal, S., Jain, R., Verma, P., Gokhale, R., & Rao, K. V. S. (2012) · Cell Host & Microbe · doi:10.1016/j.chom.2012.09.012 · Cited by 295
How tumour necrosis factor blockers interfere with tuberculosis immunity
Harris, J., & Keane, J. (2010) · Clinical & Experimental Immunology · doi:10.1111/j.1365-2249.2010.04146.x · Cited by 293
Warner-Schmidt, J. L., Vanover, K. E., Chen, E. Y., Marshall, J. J., & Greengard, P. (2011) · Proceedings of the National Academy of Sciences · doi:10.1073/pnas.1104836108 · Cited by 291
Efferocytosis Is an Innate Antibacterial Mechanism
Martin, C. J., Booty, M. G., Rosebrock, T. R., Nunes-Alves, C., Desjardins, D. M., Keren, I., Fortune, S. M., Remold, H. G., & Behar, S. M. (2012) · Cell Host & Microbe · doi:10.1016/j.chom.2012.06.010 · Cited by 285
Serotonin Skews Human Macrophage Polarization through HTR2B and HTR7
Casas-Engel, M. D. L., Domínguez‐Soto, Á., Sierra‐Filardi, E., Bragado, R., Nieto, C., Puig‐Kröger, A., Samaniego, R., Loza, M. I., Corcuera, M. T., Gómez, F., et al. (2013) · The Journal of Immunology · doi:10.4049/jimmunol.1201133 · Cited by 253
Eicosanoid pathways regulate adaptive immunity to Mycobacterium tuberculosis
Divangahi, M., Desjardins, D., Nunes-Alves, C., Remold, H. G., & Behar, S. M. (2010) · Nature Immunology · doi:10.1038/ni.1904 · Cited by 253
Stanley, S. A., Grant, S. S., Kawate, T., Iwase, N., Shimizu, M., Wivagg, C. N., Silvis, M. R., Kazyanskaya, E., Aquadro, J. A., Golas, A. J., et al. (2012) · ACS Chemical Biology · doi:10.1021/cb300151m · Cited by 252
Self-citationCoordinated regulation of autophagy by p38α MAPK through mAtg9 and p38IP
Webber, J. L., & Tooze, S. A. (2009) · The EMBO Journal · doi:10.1038/emboj.2009.321 · Cited by 248
Lee, M. R., & Dominguez, C. (2005) · Current Medicinal Chemistry · doi:10.2174/092986705774462914 · Cited by 222
Napier, R. J., Rafi, W., Cheruvu, M., Powell, K. R., Zaunbrecher, M. A., Bornmann, W. G., Salgame, P., Shinnick, T. M., & Kalman, D. (2011) · Cell Host & Microbe · doi:10.1016/j.chom.2011.09.010 · Cited by 210
Critchley, J., Young, F., Orton, L., & Garner, P. (2013) · The Lancet Infectious Diseases · doi:10.1016/s1473-3099(12)70321-3 · Cited by 209
Tailleux, L., Waddell, S. J., Pelizzola, M., Mortellaro, A., Withers, M., Tanne, A. J., Castagnoli, P. R., Gicquel, B., Stoker, N. G., Butcher, P. D., et al. (2008) · PLoS ONE · doi:10.1371/journal.pone.0001403 · Cited by 206
Malik, Z. A., Iyer, S. S., & Kusner, D. J. (2001) · The Journal of Immunology · doi:10.4049/jimmunol.166.5.3392 · Cited by 186
Bekker, L., Freeman, S. L., Murray, P. J., Ryffel, B., & Kaplan, G. (2001) · The Journal of Immunology · doi:10.4049/jimmunol.166.11.6728 · Cited by 169
Acceleration of Tuberculosis Treatment by Adjunctive Therapy with Verapamil as an Efflux Inhibitor
Gupta, S., Tyagi, S. K., Almeida, D. V., Maiga, M. C., Ammerman, N. C., & Bishai, W. R. (2013) · American Journal of Respiratory and Critical Care Medicine · doi:10.1164/rccm.201304-0650oc · Cited by 168
Korf, H., Beken, S. V., Romano, M., Steffensen, K. R., Stijlemans, B., Gustafsson, J.-�., Grooten, J., & Huygen, K. (2009) · Journal of Clinical Investigation · doi:10.1172/jci35288 · Cited by 165
Cloëz-Tayarani, I. (2003) · International Immunology · doi:10.1093/intimm/dxg027 · Cited by 162
Spangler, J. B., Neil, J. R., Abramovitch, S., Yarden, Y., White, F. M., Lauffenburger, D. A., & Wittrup, K. D. (2010) · Proceedings of the National Academy of Sciences · doi:10.1073/pnas.0913476107 · Cited by 153
Discovery of 2,3,5-trisubstituted pyridine derivatives as potent Akt1 and Akt2 dual inhibitors
Zhao, Z., Leister, W., Robinson, R., Barnett, S. F., Defeo-Jones, D., Jones, R. E., Hartman, G. D., Huff, J. R., Huber, H. E., Duggan, M. E., et al. (2005) · Bioorganic & Medicinal Chemistry Letters · doi:10.1016/j.bmcl.2004.12.062 · Cited by 146
Host-Directed Drug Targeting of Factors Hijacked by Pathogens
Schwegmann, A., & Brombacher, F. (2008) · Science Signaling · doi:10.1126/scisignal.129re8 · Cited by 129
Gaskill, P. J., Carvallo, L., Eugenin, E. A., & Berman, J. W. (2012) · Journal of Neuroinflammation · doi:10.1186/1742-2094-9-203 · Cited by 122
Reconsidering Adjuvant Immunotherapy for Tuberculosis
Wallis, R. S. (2005) · Clinical Infectious Diseases · doi:10.1086/430914 · Cited by 121
Bruns, H., Stegelmann, F., Fabri, M., Döhner, K., van Zandbergen, G., Wagner, M., Skinner, M., Modlin, R. L., & Stenger, S. (2012) · The Journal of Immunology · doi:10.4049/jimmunol.1201538 · Cited by 112
Yan, F., Cao, H., Chaturvedi, R., Krishna, U. S., Hobbs, S. S., Dempsey, P. J., Peek, R. M., Cover, T. L., Washington, M. K., Wilson, K. T., et al. (2009) · Gastroenterology · doi:10.1053/j.gastro.2008.12.059 · Cited by 111
Sternberg, E. M., Trial, J., & Parker, C. W. (1986) · The Journal of Immunology · doi:10.4049/jimmunol.137.1.276 · Cited by 110
Participation of β-Adrenergic Receptors on Macrophages in Modulation of LPS-Induced Cytokine Release
Izeboud, C. A., Mocking, J. A. J., Monshouwer, M., van Miert, A. S. J. P. A. M., & Witkamp, R. F. (1999) · Journal of Receptors and Signal Transduction · doi:10.3109/10799899909036645 · Cited by 109
Jayaswal, S., Kamal, M. A., Dua, R., Gupta, S., Majumdar, T., Das, G., Kumar, D., & Rao, K. V. S. (2010) · PLoS Pathogens · doi:10.1371/journal.ppat.1000839 · Cited by 104
Liu, K., Gualano, R. C., Hibbs, M. L., Anderson, G. P., & Bozinovski, S. (2008) · Journal of Biological Chemistry · doi:10.1074/jbc.m710257200 · Cited by 96
Stanley, S. A., Kawate, T., Iwase, N., Shimizu, M., Clatworthy, A. E., Kazyanskaya, E., Sacchettini, J. C., Ioerger, T. R., Siddiqi, N., Minami, S., et al. (2013) · Proceedings of the National Academy of Sciences · doi:10.1073/pnas.1302114110 · Cited by 95
Self-citationSubbian, S., Tsenova, L., O’Brien, P. E., Yang, G., Koo, M.-S., Peixoto, B., Fallows, D. A., Dartois, V. A., Muller, G. W., & Kaplan, G. (2011) · PLoS Pathogens · doi:10.1371/journal.ppat.1002262 · Cited by 94
Sundaramurthy, V., Barsacchi, R., Samusik, N., Marsico, G., Gilleron, J., Kalaidzidis, I. V., Meyenhofer, F., Bickle, M., Kalaidzidis, Y. L., & Zerial, M. (2013) · Cell Host & Microbe · doi:10.1016/j.chom.2013.01.008 · Cited by 86
Koo, M.-S., Manca, C., Yang, G., O’Brien, P. E., Sung, N., Tsenova, L., Subbian, S., Fallows, D. A., Muller, G. W., Ehrt, S., et al. (2011) · PLoS ONE · doi:10.1371/journal.pone.0017091 · Cited by 75
Skerry, C. M., Harper, J. S., Klunk, M. H., Bishai, W. R., & Jain, S. K. (2012) · PLoS ONE · doi:10.1371/journal.pone.0039680 · Cited by 74
Wong, S., McLaughlin, J., Cheng, D., Zhang, C., Shokat, K. M., & Witte, O. N. (2004) · Proceedings of the National Academy of Sciences · doi:10.1073/pnas.0407061101 · Cited by 72
Maïga, M., Agarwal, N., Ammerman, N. C., Gupta, R., Guo, H., Maiga, M. C., Lun, S., & Bishai, W. R. (2012) · PLoS ONE · doi:10.1371/journal.pone.0030749 · Cited by 70
Voltage Gated Calcium Channels Negatively Regulate Protective Immunity to Mycobacterium tuberculosis
Gupta, S., Salam, N., Srivastava, V., Singla, R., Behera, D., Khayyam, K. U., Korde, R., Malhotra, P., Saxena, R. K., & Natarajan, K. (2009) · PLoS ONE · doi:10.1371/journal.pone.0005305 · Cited by 60
Glosli, H., Stray‐Pedersen, A., Brun, A. C., Holtmon, L. W., Tønjum, T., Chapgier, A. L. A., Casanova, J., & Abrahamsen, T. G. (2008) · Clinical Infectious Diseases · doi:10.1086/525855 · Cited by 32
Chemical Tools for Dissecting Bacterial Physiology and Virulence
Stanley, S. A., & Hung, D. T. (2009) · Biochemistry · doi:10.1021/bi9009083 · Cited by 16
Self-citationSTEROID THERAPY AND TUBERCULOSIS
Shubin, H. (1959) · JAMA · doi:10.1001/jama.1959.03010160001001 · Cited by 13
On the Prediction of Statistical Parameters in High-Throughput Screening Using Resampling Techniques
Ilouga, P. E., & Hesterkamp, T. (2012) · SLAS DISCOVERY · doi:10.1177/1087057112441623 · Cited by 12
Introducing Bayesian Thinking to High-Throughput Screening for False-Negative Rate Estimation
Wei, X. L., Gao, L., Zhang, X., Qian, H., Rowan, K., Mark, D., Peng, Z., & Huang, K. (2013) · SLAS DISCOVERY · doi:10.1177/1087057113491495 · Cited by 3
Clinical benefit in NSCLC: the evidence for gefitinib (‘Iressa’, ZD1839)
Lynch, T. J. (2003) · European Journal of Cancer Supplements · doi:10.1016/s1359-6349(03)80016-2 · Cited by 2
Cited by
Sorted by citations
CellProfiler 3.0: Next-generation image processing for biology
McQuin, C., Goodman, A., Chernyshev, V. S., Kamentsky, L. D., Cimini, B. A., Karhohs, K. W., Doan, M., Ding, L., Rafelski, S. M., Thirstrup, D. J., et al. (2018) · PLoS Biology · doi:10.1371/journal.pbio.2005970 · Cited by 1,809
Self-citationMacrophage defense mechanisms against intracellular bacteria
Weiss, G., & Schaible, U. E. (2015) · Immunological Reviews · doi:10.1111/imr.12266 · Cited by 989
Host-directed therapies for bacterial and viral infections
Kaufmann, S. H. E., Dorhoi, A., Hotchkiss, R. S., & Bartenschlager, R. F. W. (2017) · Nature Reviews Drug Discovery · doi:10.1038/nrd.2017.162 · Cited by 869
Interplay Between NLRP3 Inflammasome and Autophagy
Biasizzo, M., & Kopitar‐Jerala, N. (2020) · Frontiers in Immunology · doi:10.3389/fimmu.2020.591803 · Cited by 636
Mycobacterium tuberculosis induces the miR-33 locus to reprogram autophagy and host lipid metabolism
Ouimet, M. I., Köster, S., Sakowski, E. T., Ramkhelawon, B., Solingen, C. V., Oldebeken, S. R., Karunakaran, D., Portal‐Celhay, C., Sheedy, F. J., Ray, T. D., et al. (2016) · Nature Immunology · doi:10.1038/ni.3434 · Cited by 365
Metadata
- Authors
- Stanley, S. A., Barczak, A. K., Silvis, M. R., Luo, S. S., Sogi, K., Vokes, M., Bray, M.-A., Carpenter, A. E., Moore, C. B., Siddiqi, N., Rubin, E. J., & Hung, D. T.
- Affiliations
- Broad Institute (US)
- University of California, Berkeley (US)
- Harvard University (US)
- Corresponding author
- Hung, Deborah T.
- ORCID
- Venue
- PLoS Pathogens
- Publisher
- Public Library of Science (PLoS)
- Published
- 2014-02-20
- Volume
- 10
- Issue
- 2
- Pages
- e1003946
- ISSN
- 1553-7366 (ISSN-L)
- 1553-7374
- PMC
- PMC3930586
- OpenAlex
- W2009324985
- Cited by
- 251
- References
- 63
- Citations by year
- 2026: 15 · 2025: 10 · 2024: 14 · 2023: 8 · 2022: 19 · 2021: 35 · 2020: 24 · 2019: 18 · 2018: 19 · 2017: 21 · 2016: 32 · 2015: 30 · 2014: 6
- FWCI
- 20.78
- Type
- journal article
- Language
- en
- Open access
- gold
- doi.org
- Locations
- PLoS Pathogens (publishedVersion, cc-by)
- Europe PMC (PubMed Central) (publishedVersion, cc-by)
- PubMed Central (publishedVersion, cc-by)
- PubMed (publishedVersion)
- Digital Access to Scholarship at Harvard (DASH) (Harvard University) (submittedVersion, cc-by)
- DOAJ (DOAJ: Directory of Open Access Journals) (submittedVersion, cc-by-sa)
- Figshare (submittedVersion, cc-by)
- Funders
- Helen Hay Whitney Foundation
- Broad Institute
- National Institutes of Health (NIH-R01)
- National Institute of General Medical Sciences (R01GM089652)
- National Institute of Allergy and Infectious Diseases (K08AI080944, T32AI007061)
- Topics
- Health Sciences › Medicine › Infectious Diseases › Tuberculosis Research and Epidemiology
- Health Sciences › Medicine › Infectious Diseases › Infectious Diseases and Tuberculosis
- Life Sciences › Immunology and Microbiology › Immunology › Immune responses and vaccinations
- Keywords
- Mycobacterium tuberculosis, host-pathogen interaction, macrophages, intracellular bacterial growth, autophagy, TNF-alpha secretion, gefitinib, EGFR signaling, p38 MAPK signaling, fluoxetine, tuberculosis drug discovery, ion channel inhibitors
- MeSH terms
- Animals, Antitubercular Agents, Disease Models, Animal, Macrophages, Male, Mice, Inbred BALB C, Mice, Inbred C57BL, Mycobacterium tuberculosis, Tuberculosis, Signal Transduction, Mice, Host-Pathogen Interactions, High-Throughput Screening Assays
About these checks
Registry, retraction, Cites and statistics results are computed, not judged, with one exception: a printed reference that no index lists is read once by a model before it counts as a citation error. Claims are extracted by a model and kept only when their quote appears verbatim in the text; each cited source is then checked, with a model’s help, for whether it says what the claim relies on. Those verdicts can be wrong — read the claim’s quote and the cited source before relying on one.
Statistics and arithmetic are recomputed, not judged.
Confidence bands are shown only for fields calibrated on our annotated test set. None is calibrated yet, so no band is shown.
What counts as a claim ›How we measure confidence ›How we check this ›
Are you an author, or do you see a problem with this page? Request a review
