

The DOI matches its Crossref record; 63 of the 63 references it cites were found in a registry or an index.
TIGIT Marks Exhausted T Cells, Correlates with Disease Progression, and Serves as a Target for Immune Restoration in HIV and SIV Infection
Open accessAbstract
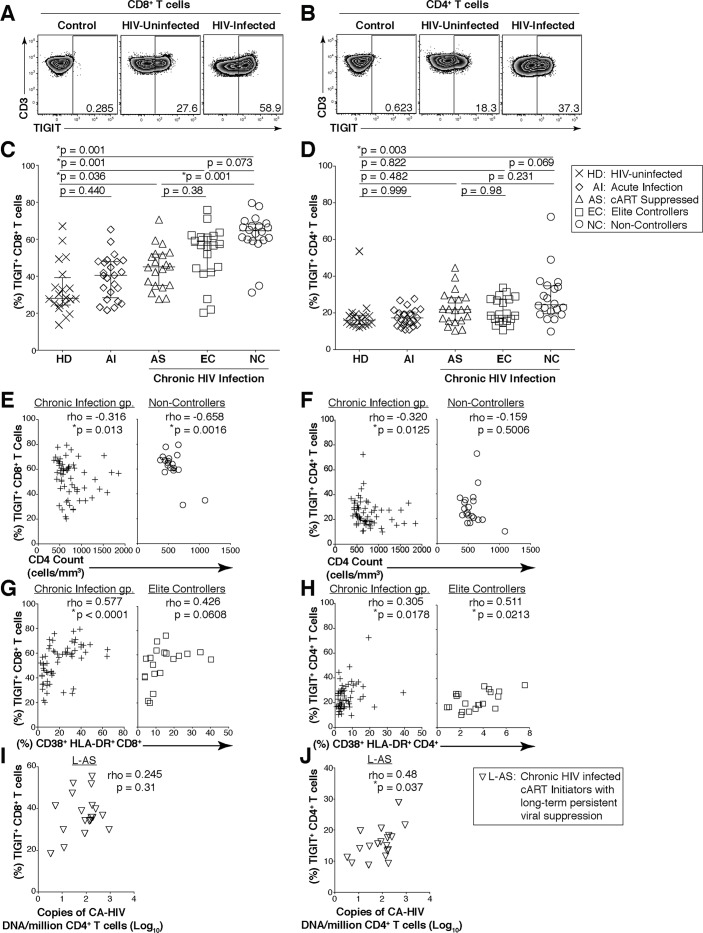
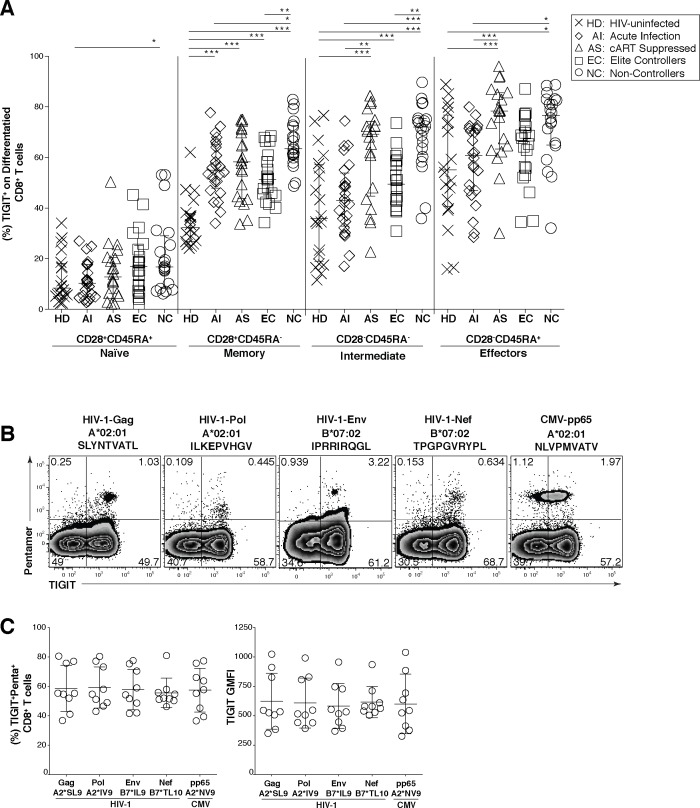
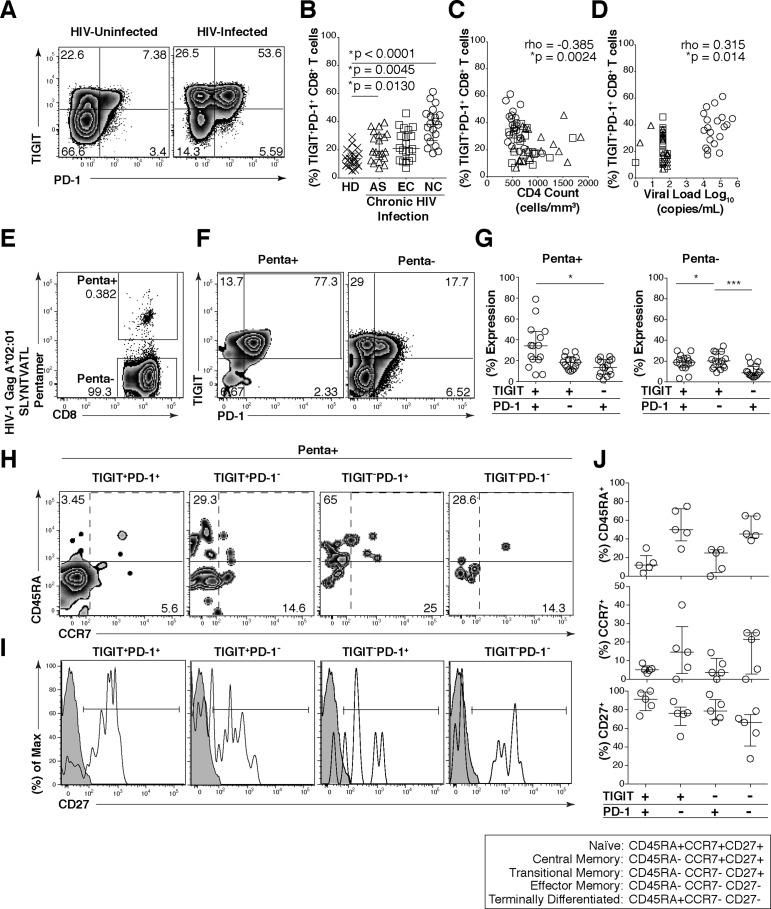
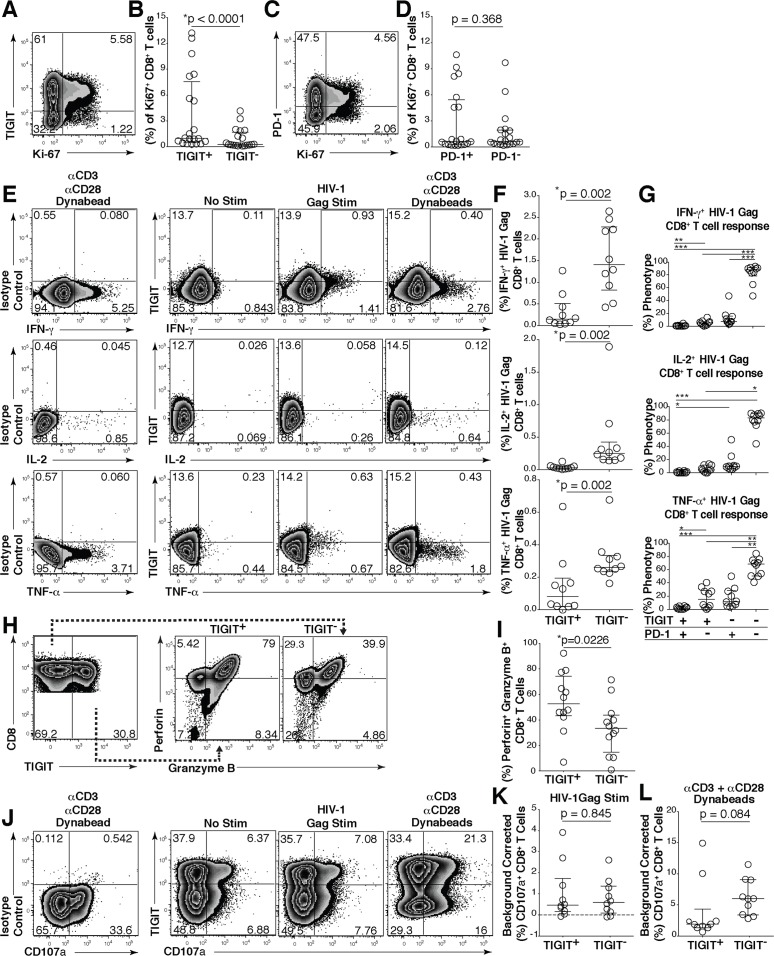
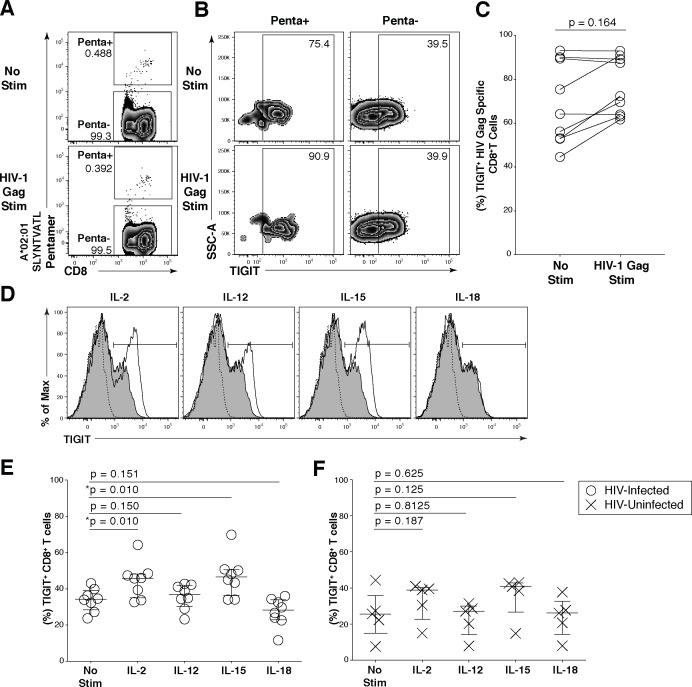
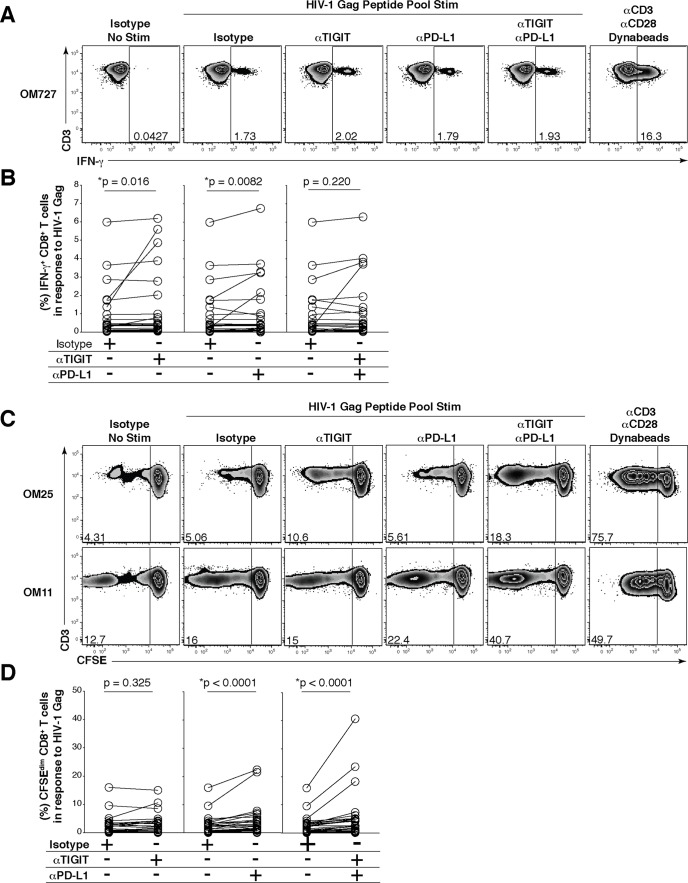
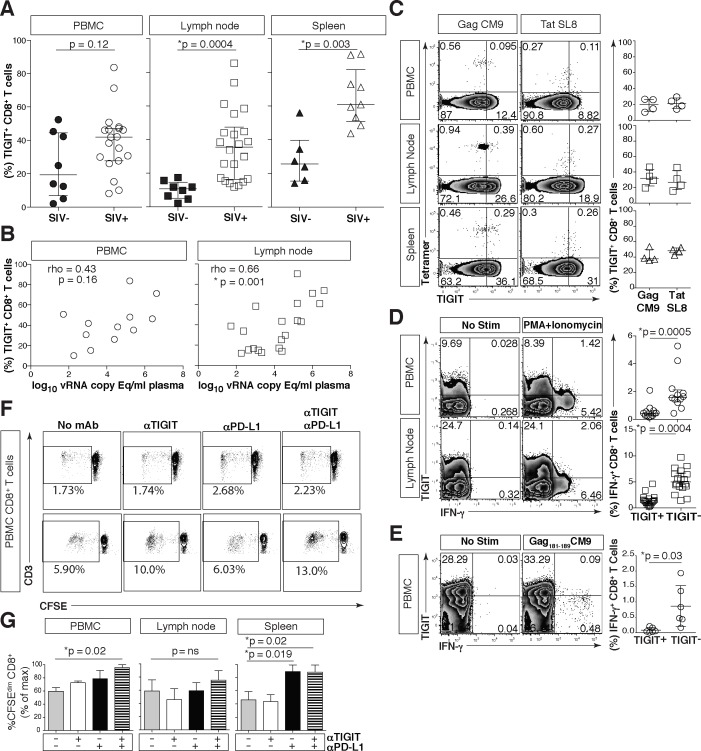
HIV infection induces phenotypic and functional changes to CD8+ T cells defined by the coordinated upregulation of a series of negative checkpoint receptors that eventually result in T cell exhaustion and failure to control viral replication. We report that effector CD8+ T cells during HIV infection in blood and SIV infection in lymphoid tissue exhibit higher levels of the negative checkpoint receptor TIGIT. Increased frequencies of TIGIT+ and TIGIT+ PD-1+ CD8+ T cells correlated with parameters of HIV and SIV disease progression. TIGIT remained elevated despite viral suppression in those with either pharmacological antiretroviral control or immunologically in elite controllers. HIV and SIV-specific CD8+ T cells were dysfunctional and expressed high levels of TIGIT and PD-1. Ex-vivo single or combinational antibody blockade of TIGIT and/or PD-L1 restored viral-specific CD8+ T cell effector responses. The frequency of TIGIT+ CD4+ T cells correlated with the CD4+ T cell total HIV DNA. These findings identify TIGIT as a novel marker of dysfunctional HIV-specific T cells and suggest TIGIT along with other checkpoint receptors may be novel curative HIV targets to reverse T cell exhaustion.
Overview
The claims and statistics of this paper haven’t been checked yet.
Run the check — free, no account needed. It reads the open-access text and checks the sources it cites.
Integrity signals
Registry
Cites
Statistics
Figures
Verification
Claims the paper makes
The claims and statistics of this paper haven’t been checked yet.
Run the check — free, no account needed. It reads the open-access text and checks the sources it cites.
Claims other papers make about this one
Each is checked against this paper’s own text: does it say what the citing paper says it does?
In the citing paper
“These include the TIM-3, LAG-3, TIGIT, and B- And T-Lymphocyte-Associated Protein (BTLA) receptors associated with T cell exhaustion as well as VISTA, a receptor found on tumor-infiltrating myeloid cells, whose inhibition promoted anti-tumor immune responses in murine models, and CD96, which has been shown to inhibit NK cell activity in murine cancer models (115–117).”
From Anti-PD-1 and Anti-CTLA-4 Therapies in Cancer: Mechanisms of Action, Efficacy, and Limitations (2018) · cites this paper as [117]
In the citing paper
“These include the TIM-3, LAG-3, TIGIT, and B- And T-Lymphocyte-Associated Protein (BTLA) receptors associated with T cell exhaustion as well as VISTA, a receptor found on tumor-infiltrating myeloid cells, whose inhibition promoted anti-tumor immune responses in murine models, and CD96, which has been shown to inhibit NK cell activity in murine cancer models (115–117).”
From Anti-PD-1 and Anti-CTLA-4 Therapies in Cancer: Mechanisms of Action, Efficacy, and Limitations (2018) · cites this paper as [117]
Self-check
Percentages, sums and reported differences re-computed from the paper’s own numbers.
The self-check needs the paper’s full text.
Citations
Cites
Safety, activity, and immune correlates of anti–PD-1 antibody in cancer
Topalian, S. L., Hodi, F. S., Brahmer, J. R., Gettinger, S. N., Smith, D. C., McDermott, D. F., Powderly, J. D., Carvajal, R. D., Sosman, J. A., Atkins, M. B., et al. (2012) · New England Journal of Medicine · doi:10.1056/nejmoa1200690 · Cited by 12,628
Self-citationOncology meets immunology: the cancer-immunity cycle.
Chen, D. S., & Mellman, I. (2013) · Immunity · doi:10.1016/j.immuni.2013.07.012 · Cited by 6,929
Wherry, E. J. (2011) · Nature Immunology · doi:10.1038/ni.2035 · Cited by 4,062 · cited 1×
“During chronic viral infections, high antigenic loads continually stimulate T cells leading to progressive loss of function termed “T cell exhaustion” [1].”
BackgroundThe interaction of TIGIT with PVR and PVRL2 inhibits human NK cell cytotoxicity
Stanietsky, N., Simic, H., Arapovic, J., Toporik, A., Levy, O., Novik, A., Levine, Z., Beiman, M., Dassa, L., Achdout, H., et al. (2009) · Proceedings of the National Academy of Sciences · doi:10.1073/pnas.0903474106 · Cited by 3,524
Safety and Tumor Responses with Lambrolizumab (Anti–PD-1) in Melanoma
Hamid, O., Robert, C., DAUD, A. I., Hodi, F. S., Hwu, W., Kefford, R. F., Wolchok, J. D., Hersey, P., Joseph, R. W., Weber, J. S., et al. (2013) · New England Journal of Medicine · doi:10.1056/nejmoa1305133 · Cited by 3,427
PD-1 expression on HIV-specific T cells is associated with T-cell exhaustion and disease progression
Day, C. L., Kaufmann, D. E., Kiepiela, P., Brown, J. A., Moodley, E. S., Reddy, S., Mackey, E. W., Miller, J. D., Leslie, A. J., DePierres, C., et al. (2006) · Nature · doi:10.1038/nature05115 · Cited by 2,680
MPDL3280A (anti-PD-L1) treatment leads to clinical activity in metastatic bladder cancer
Powles, T. B., Eder, J. P., Fine, G. D., Braiteh, F. S., Loriot, Y., Cruz, C., Joaquim Bellmunt, B., Burris, H. A., Petrylak, D. P., Teng, S.-L. M., et al. (2014) · Nature · doi:10.1038/nature13904 · Cited by 2,410
Blackburn, S. D., Shin, H., Haining, W. N., Zou, T., Workman, C. J., Polley, A., Betts, M. R., Freeman, G. J., Vignali, D. A. A., & Wherry, E. J. (2009) · Nature Immunology · doi:10.1038/ni.1679 · Cited by 2,062
Upregulation of PD-1 expression on HIV-specific CD8+ T cells leads to reversible immune dysfunction
Trautmann, L., Janbazian, L., Chomont, N., Said, E. A., Gimmig, S., Bessette, B., Boulassel, M.-R., Delwart, E., Sepulveda, H., Balderas, R. S., et al. (2006) · Nature Medicine · doi:10.1038/nm1482 · Cited by 1,565
Memory CD8+ T cells vary in differentiation phenotype in different persistent virus infections
Appay, V., Dunbar, P. R., Callan, M. F. C., Klenerman, P., Gillespie, G. M. A., Papagno, L., Ogg, G. S., King, A., Lechner, F., Spina, C. A., et al. (2002) · Nature Medicine · doi:10.1038/nm0402-379 · Cited by 1,556
Yu, X., Harden, K., Gonzalez, L. C., Francesco, M. R., Chiang, E. Y., Irving, B. A., Tom, I., Ivelja, S., Refino, C. J., Clark, H. F., et al. (2008) · Nature Immunology · doi:10.1038/ni.1674 · Cited by 1,536
The Immunoreceptor TIGIT Regulates Antitumor and Antiviral CD8 + T Cell Effector Function
Johnston, R. J., Comps‐Agrar, L., Hackney, J. A., Yu, X., Huseni, M. A., Yang, Y., Park, S., Javinal, V., Chiu, H. H., Irving, B. A., et al. (2014) · Cancer Cell · doi:10.1016/j.ccell.2014.10.018 · Cited by 1,226
Predicting immunogenic tumour mutations by combining mass spectrometry and exome sequencing
Yadav, M., Jhunjhunwala, S., Phung, Q. T., Lupardus, P., Tanguay, J., Bumbaca, S., Franci, C., Cheung, T. K., Fritsche, J., Weinschenk, T., et al. (2014) · Nature · doi:10.1038/nature14001 · Cited by 1,186
Administration of vorinostat disrupts HIV-1 latency in patients on antiretroviral therapy
Archin, N. M., Liberty, A. L., Kashuba, A. D. M., Choudhary, S. K., Kuruc, J. D., Crooks, A. M., Parker, D., Anderson, E. M., Kearney, M. F., Strain, M. C., et al. (2012) · Nature · doi:10.1038/nature11286 · Cited by 1,149
Joller, N., Lozano, E., Burkett, P. R., Patel, B., Xiao, S., Zhu, C. Y., Xia, J., Tan, T. G., Sefik, E., Yajnik, V., et al. (2014) · Immunity · doi:10.1016/j.immuni.2014.02.012 · Cited by 976
TIGIT and PD-1 impair tumor antigen–specific CD8+ T cells in melanoma patients
Chauvin, J.-M., Pagliano, O., Fourcade, J. J., Sun, Z., Wang, H., Sander, C., Kirkwood, J. M., Chen, T.-H. T., Maurer, M. F., Korman, A. J., et al. (2015) · Journal of Clinical Investigation · doi:10.1172/jci80445 · Cited by 805
Self-citationJones, R. B., Ndhlovu, L. C., Barbour, J. D., Sheth, P. M., Jha, A. R., Long, B. R., Wong, J. C. Y., Satkunarajah, M., Schweneker, M., Chapman, J. M., et al. (2008) · The Journal of Experimental Medicine · doi:10.1084/jem.20081398 · Cited by 768
Self-citationEnhancing SIV-specific immunity in vivo by PD-1 blockade
Velu, V., Titanji, K., Zhu, B., Husain, S., Pladevega, A., Lai, L., Vanderford, T. H., Chennareddi, L. S., Silvestri, G., Freeman, G. J., et al. (2008) · Nature · doi:10.1038/nature07662 · Cited by 765
Duraiswamy, J., Kaluza, K. M., Freeman, G. J., & Coukos, G. (2013) · Cancer Research · doi:10.1158/0008-5472.can-12-4100 · Cited by 750
Shan, L., Deng, K., Shroff, N. S., Durand, C. M., Rabi, S. A., Yang, H., Zhang, H., Margolick, J. B., Blankson, J. N., & Siliciano, R. F. (2012) · Immunity · doi:10.1016/j.immuni.2012.01.014 · Cited by 707
Hunt, P. W., Brenchley, J. M., Sinclair, E., McCune, J. M., Roland, M. E., Page, K. A., Hsue, P. Y., Emu, B., Krone, M., Lampiris, H. W., et al. (2007) · The Journal of Infectious Diseases · doi:10.1086/524143 · Cited by 634
Self-citationTACI-Ig Neutralizes Molecules Critical for B Cell Development and Autoimmune Disease
Gross, J. A., Dillon, S. R., Mudri, S., Johnston, J. V., Littau, A., Roque, R., Rixon, M. W., Schou, O., Foley, K. P., Haugen, H. S., et al. (2001) · Immunity · doi:10.1016/s1074-7613(01)00183-2 · Cited by 625
Deeks, S. G. (2012) · Nature · doi:10.1038/487439a · Cited by 606
Self-citationCutting Edge: TIGIT Has T Cell-Intrinsic Inhibitory Functions
Joller, N., Hafler, J. P., Brynedal, B., Kassam, N., Spoerl, S., Levin, S. D., Sharpe, A. H., & Kuchroo, V. K. (2011) · The Journal of Immunology · doi:10.4049/jimmunol.1003081 · Cited by 595
Kinter, A. L., Godbout, E. J., McNally, J. P., Sereti, I., Roby, G. A., O’Shea, M. A., & Fauci, A. S. (2008) · The Journal of Immunology · doi:10.4049/jimmunol.181.10.6738 · Cited by 513
Broad CTL response is required to clear latent HIV-1 due to dominance of escape mutations
Deng, K., Pertea, M., Rongvaux, A., Wang, L., Durand, C. M., Ghiaur, G., Lai, J., McHugh, H., Hao, H., Zhang, H., et al. (2015) · Nature · doi:10.1038/nature14053 · Cited by 499
Self-citationBalancing natural killer cell activation through paired receptors
Martinet, L., & Smyth, M. J. (2015) · Nature reviews. Immunology · doi:10.1038/nri3799 · Cited by 493
The TIGIT/CD226 Axis Regulates Human T Cell Function
Lozano, E., Dominguez‐Villar, M., Kuchroo, V. K., & Hafler, D. A. (2012) · The Journal of Immunology · doi:10.4049/jimmunol.1103627 · Cited by 488
Immune Activation and CD8+ T-Cell Differentiation towards Senescence in HIV-1 Infection
Papagno, L., Spina, C. A., Marchant, A., Salio, M., Rufer, N., Little, S., Dong, T., Chesney, G., Waters, A., Easterbrook, P., et al. (2004) · PLoS Biology · doi:10.1371/journal.pbio.0020020 · Cited by 478
Younes, S., Yassine‐Diab, B., Dumont, A. R., Boulassel, M., Grossman, Z., Routy, J., & Sékaly, R. (2003) · The Journal of Experimental Medicine · doi:10.1084/jem.20031598 · Cited by 459
Lambotte, O., Boufassa, F., Madec, Y., Nguyen, A., Goujard, C., Meyer, L., Rouzioux, C., Venet, A., Delfraissy, J., & SEROCO-HEMOCO Study Group (2005) · Clinical Infectious Diseases · doi:10.1086/433188 · Cited by 407
Antigen-specific human antibodies from mice comprising four distinct genetic modifications
Lönberg, N., Taylor, L. D., Harding, F., Trounstine, M. L., Higgins, K. M., Schramm, S. R., Kuo, C.-C., Mashayekh, R., Wymore, K., McCabe, J. G., et al. (1994) · Nature · doi:10.1038/368856a0 · Cited by 399
Wei, D. G., Chiang, V., Fyne, E., Balakrishnan, M., Barnes, T. L., Graupe, M., Hesselgesser, J., Irrinki, A., Murry, J. P., Stepan, G. J., et al. (2014) · PLoS Pathogens · doi:10.1371/journal.ppat.1004071 · Cited by 272
High-avidity human IgGκ monoclonal antibodies from a novel strain of minilocus transgenic mice
Fishwild, D. M., O'Donnell, S. L., Bengoechea, T. G., Hudson, D., Harding, F., Bernhard, S. L., Jones, D., Kay, R. M., Higgins, K. M., Schramm, S. R., et al. (1996) · Nature Biotechnology · doi:10.1038/nbt0796-845 · Cited by 271
A novel molecular interaction for the adhesion of follicular CD4 T cells to follicular DC
Boles, K. S., Vermi, W., Facchetti, F., Fuchs, A. G., Wilson, T. J., Diacovo, T. G., Cella, M., & Colonna, M. (2009) · European Journal of Immunology · doi:10.1002/eji.200839116 · Cited by 269
Gardiner, D., Lalezari, J. P., Lawitz, E., DiMicco, M., Ghalib, R., Reddy, K. R., Chang, K., Sulkowski, M., Marro, S. O., Anderson, J., et al. (2013) · PLoS ONE · doi:10.1371/journal.pone.0063818 · Cited by 235
Self-citationKaufmann, D., & Walker, B. D. (2009) · The Journal of Immunology · doi:10.4049/jimmunol.0803771 · Cited by 229
Stengel, K. F., Bowles, K. H., Yu, X., Rougé, L., Yin, J., Comps‐Agrar, L., Wiesmann, C., Bazán, J. F., Eaton, D., & Grogan, J. L. (2012) · Proceedings of the National Academy of Sciences · doi:10.1073/pnas.1120606109 · Cited by 216
Hatano, H., Delwart, E., Norris, P. J., Lee, T., Dunn-Williams, J., Hunt, P. W., Hoh, R., Stramer, S. L., Linnen, J. M., McCune, J. M., et al. (2008) · Journal of Virology · doi:10.1128/jvi.01763-08 · Cited by 208
Self-citationPersistent Low‐Level Viremia in HIV‐1 Elite Controllers and Relationship to Immunologic Parameters
Pereyra, F., Palmer, S., Miura, T., Block, B. L., Wiegand, A. P., Rothchild, A. C., Baker, B. M., Rosenberg, R., Cutrell, E., Seaman, M. S., et al. (2009) · The Journal of Infectious Diseases · doi:10.1086/605446 · Cited by 204
Yamamoto, T., Price, D. A., Casazza, J. P., Ferrari, G., Nason, M., Chattopadhyay, P. K., Roederer, M., Emma Gostick, D., Katsikis, P. D., Douek, D. C., et al. (2011) · Blood · doi:10.1182/blood-2010-11-317297 · Cited by 193
Comparison of HDAC inhibitors in clinical development
Rasmussen, T. A., Søgaard, O. S., Brinkmann, C. R., Wightman, F., Lewin, S. R., Melchjorsen, J., Dinarello, C. A., Østergaard, L. J., & Tolstrup, M. (2013) · Human Vaccines & Immunotherapeutics · doi:10.4161/hv.23800 · Cited by 191
Epidemiology and clinical characteristics of elite controllers
Okulicz, J. F., & Lambotte, O. (2011) · Current Opinion in HIV and AIDS · doi:10.1097/coh.0b013e328344f35e · Cited by 182
Petrovas, C., Price, D. A., Mattapallil, J. J., Ambrozak, D. R., Geldmacher, C., Cecchinato, V., Vaccari, M., Tryniszewska, E. A., Emma Gostick, D., Roederer, M., et al. (2007) · Blood · doi:10.1182/blood-2007-01-069112 · Cited by 172
Shetty, R. D., Velu, V., Titanji, K., Bosinger, S. E., Freeman, G. J., Silvestri, G., & Amara, R. R. (2012) · Journal of Clinical Investigation · doi:10.1172/jci60612 · Cited by 156
Evidence for Innate Immune System Activation in HIV Type 1–Infected Elite Controllers
Krishnan, S., Wilson, E. M. P., Sheikh, V., Rupert, A. W., Mendoza, D., Yang, J., Lempicki, R. A., Migueles, S. A., & Sereti, I. (2013) · The Journal of Infectious Diseases · doi:10.1093/infdis/jit581 · Cited by 146
Tian, X., Zhang, A., Qiu, C., Wang, W., Yang, Y. Z., Qiu, C., Liu, A., Zhu, L., Yuan, S., Hu, H., et al. (2015) · The Journal of Immunology · doi:10.4049/jimmunol.1402176 · Cited by 145
Cell-associated HIV RNA: a dynamic biomarker of viral persistence
Pasternak, A. O., Lukashov, V. V., & Berkhout, B. (2013) · Retrovirology · doi:10.1186/1742-4690-10-41 · Cited by 138
Role of PD-1 in HIV Pathogenesis and as Target for Therapy
Porichis, F., & Kaufmann, D. (2011) · Current HIV/AIDS Reports · doi:10.1007/s11904-011-0106-4 · Cited by 137
Crowell, T. A., Gebo, K. A., Blankson, J. N., Korthuis, P. T., Yehia, B. R., Rutstein, R. M., Moore, R. D., Sharp, V., Nijhawan, A. E., Mathews, W. C., et al. (2014) · The Journal of Infectious Diseases · doi:10.1093/infdis/jiu809 · Cited by 129
Kumar, A. M., Borodowsky, I., Fernandez, B., Gonzalez, L. E., & Kumar, M. (2007) · Journal of NeuroVirology · doi:10.1080/13550280701327038 · Cited by 123
Mujib, S., Jones, R. B., Lo, C. C., Aidarus, N., Clayton, K., Sakhdari, A., Benko, E., Kovacs, C. M., & Ostrowski, M. (2012) · The Journal of Immunology · doi:10.4049/jimmunol.1102609 · Cited by 105
Self-citationVali, B., Jones, R. B., Sakhdari, A., Sheth, P. M., Clayton, K., Yue, F., Gyenes, G. T., Wong, D., Klein, M. B., Saeed, S., et al. (2010) · European Journal of Immunology · doi:10.1002/eji.201040340 · Cited by 101
Self-citationClayton, K., Douglas-Vail, M. B., Rahman, A. K. M. N.-U., Medcalf, K. E., Xie, I. Y., Chew, G. M., Tandon, R., Lanteri, M. C., Norris, P. J., Deeks, S. G., et al. (2015) · Journal of Virology · doi:10.1128/jvi.00006-15 · Cited by 92
Self-citationCD160-Associated CD8 T-Cell Functional Impairment Is Independent of PD-1 Expression
Viganó, S., Banga, R., Bellanger, F., Pellaton, C., Farina, A., Comte, D., Harari, A., & Perreau, M. (2014) · PLoS Pathogens · doi:10.1371/journal.ppat.1004380 · Cited by 76
Symptomatic distal sensory polyneuropathy in HIV after age 50
Watters, M. R., Poff, P., Shiramizu, B. T., Holck, P. S., Fast, K. M. S., Shikuma, C. M., & Valcour, V. (2004) · Neurology · doi:10.1212/01.wnl.0000120622.91018.ea · Cited by 51
Self-citationPD-1 induction through TCR activation is partially regulated by endogenous TGF-β
Rekik, R., Hmida, N. B., Hmid, A. B., Zamali, I., Kammoun, N., & Ahmed, M. B. (2014) · Cellular and Molecular Immunology · doi:10.1038/cmi.2014.104 · Cited by 45
Sun, Y., Schmitz, J. E., Acierno, P. M., Santra, S., Subbramanian, R. A., Barouch, D. H., Gorgone, D. A., Lifton, M. A., Beaudry, K. R., Manson, K. H., et al. (2005) · The Journal of Immunology · doi:10.4049/jimmunol.174.8.4753 · Cited by 30
Fujita, T., Burwitz, B. J., Chew, G. M., Reed, J. S., Pathak, R., Seger, E., Clayton, K., Rini, J. M., Ostrowski, M., Ishii, N., et al. (2014) · The Journal of Immunology · doi:10.4049/jimmunol.1400961 · Cited by 30
Self-citationBarbour, J. D., Ndhlovu, L. C., Tan, Q. X., Ho, T. N., Epling, L., Bredt, B. M., Levy, J. A., Hecht, F. M., & Sinclair, E. (2009) · PLoS ONE · doi:10.1371/journal.pone.0004408 · Cited by 27
Self-citationLópez, M., Soriano, V., Peris-Pertusa, A., Rallón, N. I., Restrepo, C., & Benito, J. M. (2010) · AIDS Research and Human Retroviruses · doi:10.1089/aid.2010.0107 · Cited by 27
CD8+ Memory T Cells Appear Exhausted within Hours of Acute Virus Infection
Hosking, M., Flynn, C. T., Botten, J., & Whitton, J. L. (2013) · The Journal of Immunology · doi:10.4049/jimmunol.1300920 · Cited by 22
Foks, A. C., Ran, I. A., Frodermann, V., Bot, I., van Santbrink, P. J., Kuiper, J., & van Puijvelde, G. H. M. (2013) · PLoS ONE · doi:10.1371/journal.pone.0083134 · Cited by 15
Cited by
Sorted by citations
Anti-PD-1 and Anti-CTLA-4 Therapies in Cancer: Mechanisms of Action, Efficacy, and Limitations
Seidel, J. A., Otsuka, A., & Kabashima, K. (2018) · Frontiers in Oncology · doi:10.3389/fonc.2018.00086 · Cited by 1,360
Immune checkpoint blockade in infectious diseases
Wykes, M., & Lewin, S. R. (2017) · Nature reviews. Immunology · doi:10.1038/nri.2017.112 · Cited by 585
TIGIT as an emerging immune checkpoint
Harjunpää, H., & Guillerey, C. (2020) · Clinical and Experimental Immunology · doi:10.1111/cei.13407 · Cited by 552
Immune checkpoints and their inhibition in cancer and infectious diseases
Dyck, L., & Mills, K. H. G. (2017) · European Journal of Immunology · doi:10.1002/eji.201646875 · Cited by 553
CD4+ T Cells Expressing PD-1, TIGIT and LAG-3 Contribute to HIV Persistence during ART
Fromentin, R., Bakeman, W., Lawani, M. B., Khoury, G., Hartogensis, W., DaFonseca, S., Killian, M. L., Epling, L., Hoh, R., Sinclair, E., et al. (2016) · PLoS Pathogens · doi:10.1371/journal.ppat.1005761 · Cited by 418
Self-citation
Metadata
- Authors
- Chew, G. M., Fujita, T., Webb, G. M., Burwitz, B. J., Wu, H. L., Reed, J. S., Hammond, K. B., Clayton, K. L., Ishii, N., Abdel-Mohsen, M., Liegler, T., Mitchell, B. I., Hecht, F. M., Ostrowski, M., Shikuma, C. M., Hansen, S. G., Maurer, M., Korman, A. J., Deeks, S. G., Sacha, J. B., & Ndhlovu, L. C.
- Affiliations
- University of Hawaiʻi at Mānoa (US)
- Oregon National Primate Research Center (US)
- University of Toronto (CA)
- Tohoku University (JP)
- San Francisco General Hospital (US)
- Bristol-Myers Squibb (United States) (US)
- Corresponding author
- Ndhlovu, Lishomwa C.
- ORCID
- Venue
- PLoS Pathogens
- Publisher
- Public Library of Science (PLoS)
- Published
- 2016-01-07
- Volume
- 12
- Issue
- 1
- Pages
- e1005349
- ISSN
- 1553-7366 (ISSN-L)
- 1553-7374
- PMC
- PMC4704737
- OpenAlex
- W2225639217
- Cited by
- 323
- References
- 63
- Citations by year
- 2026: 10 · 2025: 25 · 2024: 30 · 2023: 33 · 2022: 33 · 2021: 47 · 2020: 44 · 2019: 36 · 2018: 32 · 2017: 18 · 2016: 12
- FWCI
- 22.59
- Type
- journal article
- Language
- en
- Open access
- gold
- doi.org
- Licence
- Locations
- PLoS Pathogens (publishedVersion, cc-by)
- Europe PMC (PubMed Central) (publishedVersion, cc-by)
- PubMed Central (publishedVersion, cc-by)
- PubMed (publishedVersion)
- eScholarship (California Digital Library) (submittedVersion, cc-by)
- DOAJ (DOAJ: Directory of Open Access Journals) (submittedVersion, cc-by-sa)
- eScholarship (California Digital Library) (submittedVersion)
- Figshare (submittedVersion, cc-by)
- Funders
- Bristol-Myers Squibb
- Oregon Health and Science University (OD011092)
- International AIDS Society
- National Institutes of Health (n01ai085341-004, OD-011092, RR024131, AI027763, NOI-AI-85341, P51OD011092)
- University of California, San Francisco (P30AI027763, UL1RR024131)
- Japan Society for the Promotion of Science (15H04742)
- National Institute of General Medical Sciences (P30GM103341)
- National Institute of Allergy and Infectious Diseases (N01 AI085341, K24AI069994, OD011092, RO1 AI087145, AI027763, RR024131, AI067039, AI069994, AI087145, NOI-AI-85341, HIV-1, R01AI087145, N0I-AI-85341, R24AI067039, P30AI027763)
- National Center for Research Resources (UL1RR024131, RR 024131)
- Office of AIDS Research
- National Institute on Minority Health and Health Disparities (U54MD007584)
- Topics
- Life Sciences › Immunology and Microbiology › Virology › HIV Research and Treatment
- Life Sciences › Immunology and Microbiology › Immunology › T-cell and B-cell Immunology
- Health Sciences › Medicine › Oncology › Cancer Immunotherapy and Biomarkers
- Keywords
- TIGIT, T cell exhaustion, HIV infection, SIV infection, CD8+ T cells, PD-1, PD-L1, immune checkpoint receptors, disease progression, elite controllers, viral suppression, T cell dysfunction, immune restoration, antibody blocking
- MeSH terms
- Animals, Cell Separation, DNA, Viral, Flow Cytometry, Humans, Lymphocyte Activation, Macaca mulatta, Receptors, Immunologic, RNA, Viral, CD4-Positive T-Lymphocytes, HIV Infections, Simian Acquired Immunodeficiency Syndrome, CD8-Positive T-Lymphocytes, Disease Progression, B7-H1 Antigen
About these checks
Registry, retraction, Cites and statistics results are computed, not judged, with one exception: a printed reference that no index lists is read once by a model before it counts as a citation error. Claims are extracted by a model and kept only when their quote appears verbatim in the text; each cited source is then checked, with a model’s help, for whether it says what the claim relies on. Those verdicts can be wrong — read the claim’s quote and the cited source before relying on one.
Statistics and arithmetic are recomputed, not judged.
Confidence bands are shown only for fields calibrated on our annotated test set. None is calibrated yet, so no band is shown.
What counts as a claim ›How we measure confidence ›How we check this ›
Are you an author, or do you see a problem with this page? Request a review
