Cited by 22

The DOI matches its Crossref record; 7 of the 7 references it cites were found in a registry or an index.

Suppression of inflammatory arthritis by the parasitic worm product ES-62 is associated with epigenetic changes in synovial fibroblasts

Corbet, Marlene, Pineda, Miguel A., Yang, Kun, Tarafdar, Anuradha, McGrath, Sarah, Nakagawa, Rinako, Lumb, Felicity E., Suckling, Colin J., Harnett, William, Harnett, Margaret M.·2021·PLOS Pathogens

Abstract

ES-62 is the major secreted protein of the parasitic filarial nematode, Acanthocheilonema viteae. The molecule exists as a large tetramer (MW, ~240kD), which possesses immunomodulatory properties by virtue of multiple phosphorylcholine (PC) moieties attached to N-type glycans. By suppressing inflammatory immune responses, ES-62 can prevent disease development in certain mouse models of allergic and autoimmune conditions, including joint pathology in collagen-induced arthritis (CIA), a model of rheumatoid arthritis (RA). Such protection is associated with functional suppression of “pathogenic” hyper-responsive synovial fibroblasts (SFs), which exhibit an aggressive inflammatory and bone-damaging phenotype induced by their epigenetic rewiring in response to the inflammatory microenvironment of the arthritic joint. Critically, exposure to ES-62 in vivo induces a stably-imprinted CIA-SF phenotype that exhibits functional responses more typical of healthy, Naïve-SFs. Consistent with this, ES-62 “rewiring” of SFs away from the hyper-responsive phenotype is associated with suppression of ERK activation, STAT3 activation and miR-155 upregulation, signals widely associated with SF pathogenesis. Surprisingly however, DNA methylome analysis of Naïve-, CIA- and ES-62-CIA-SF cohorts reveals that rather than simply preventing pathogenic rewiring of SFs, ES-62 induces further changes in DNA methylation under the inflammatory conditions pertaining in the inflamed joint, including targeting genes associated with ciliogenesis, to programme a novel “resolving” CIA-SF phenotype. In addition to introducing a previously unsuspected aspect of ES-62’s mechanism of action, such unique behaviour signposts the potential for developing DNA methylation signatures predictive of pathogenesis and its resolution and hence, candidate mechanisms by which novel therapeutic interventions could prevent SFs from perpetuating joint inflammation and destruction in RA. Pertinent to these translational aspects of ES-62-behavior, small molecule analogues (SMAs) based on ES-62’s active PC-moieties mimic the rewiring of SFs as well as the protection against joint disease in CIA afforded by the parasitic worm product.

Overview

The claims and statistics of this paper haven’t been checked yet.

Run the check — free, no account needed. It reads the open-access text and checks the sources it cites.

A few free checks a day · papers already verified open instantly · results are public

Integrity signals

Registry

Crossref · 10.1371/journal.ppat.1010069

Cites

7 of 7 references verified0 citation errors · 0 not checkable

Statistics

Figures

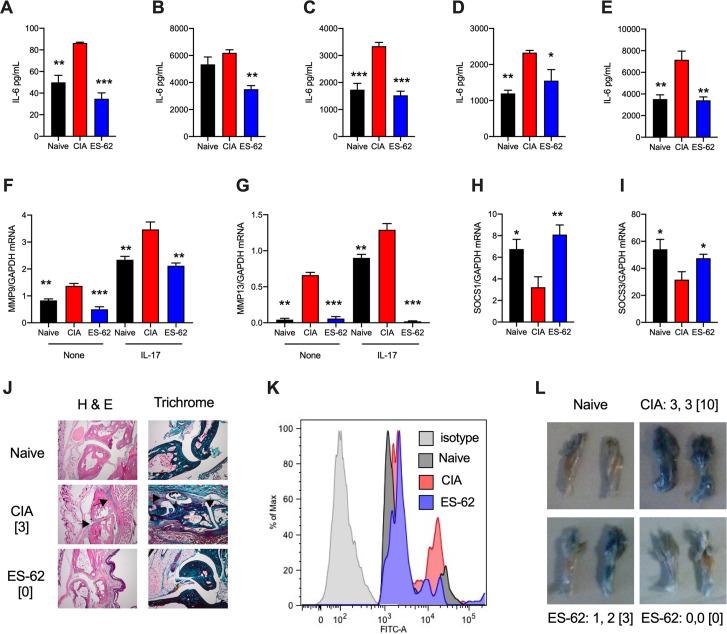
Fig 1 CIA induces a “hyper-responsive” SF phenotype that is counteracted by ES-62. SFs from Naïve, CIA and ES-62-CIA (ES-62) mice were incubated overnight in (A) medium or medium containing (B) IL-17, (C) IL-1β, (D) LPS or (E) BLP, and IL-6 release measured. Data are mean (of means of triplicates) values ± SEM of n = 3 cultures representative of 3–7 cultures. The pooled data revealed that CIA-SFs showed 1.486 ± 0.180-fold (n = 7, p<0.05) and ES-62-SFs, 0.873 ± 0.099-fold (n = 4) basal IL-6 release relative to Naïve-SFs and IL-17-stimulated CIA-SFs exhibited x2.29 ± 0.57-fold (n = 3, p<0.05) release compared to Naïve-IL-17 controls, whilst treatment with ES-62 reduced this hyper-production (x 1.87 ± 0.62-fold, n = 3). SFs were analysed for mRNA levels of MMP9 and MMP13 (F and G) or for SOCS1 and SOCS3 (H and I), following incubation overnight in medium (None) or where indicated, medium containing IL-17. Data are from single experiments representative of at least two and presented as mean (of means of triplicates) values ± SEM of n = 3 cultures, assayed by qRT-PCR. (J) Joint pathology showing representative sections from mice, with articular scores of the joint examined [indicated]. Arrows show the cartilage erosion and cellular infiltration in CIA sections. (K) Flow cytometric analysis of the hypoxic status of joint SFs determined by pimonidazole in vivo. (L) Representative images of joint vascular leakage (Evan’s Blue), where articular score for individual paws and [total mouse score] are from one experiment representative of two independent models. Throughout, SFs were pooled from individual mice to generate representative explant cohorts with articular scores: (A-E, and I) CIA, 3.17 ± 1.38, n = 6; ES-62, 0.5 ± 0.22, n = 6; (F-H) CIA, 3.66 ± 1.5, n = 6; ES-62, 1.5 ± 1.15, n = 6; (K) CIA, 4.667 ±1.99, n = 6; ES-62, 0.8 ± 0.8, n = 5. In all panels, *p<0.05; **p<0.01; ***p<0.001 relative to CIA SFs.
Fig 1 CIA induces a “hyper-responsive” SF phenotype that is counteracted by ES-62. SFs from Naïve, CIA and ES-62-CIA (ES-62) mice were incubated overnight in (A) medium or medium containing (B) IL-17, (C) IL-1β, (D) LPS or (E) BLP, and IL-6 release measured. Data are mean (of means of triplicates) values ± SEM of n = 3 cultures representative of 3–7 cultures. The pooled data revealed that CIA-SFs showed 1.486 ± 0.180-fold (n = 7, p<0.05) and ES-62-SFs, 0.873 ± 0.099-fold (n = 4) basal IL-6 release relative to Naïve-SFs and IL-17-stimulated CIA-SFs exhibited x2.29 ± 0.57-fold (n = 3, p<0.05) release compared to Naïve-IL-17 controls, whilst treatment with ES-62 reduced this hyper-production (x 1.87 ± 0.62-fold, n = 3). SFs were analysed for mRNA levels of MMP9 and MMP13 (F and G) or for SOCS1 and SOCS3 (H and I), following incubation overnight in medium (None) or where indicated, medium containing IL-17. Data are from single experiments representative of at least two and presented as mean (of means of triplicates) values ± SEM of n = 3 cultures, assayed by qRT-PCR. (J) Joint pathology showing representative sections from mice, with articular scores of the joint examined [indicated]. Arrows show the cartilage erosion and cellular infiltration in CIA sections. (K) Flow cytometric analysis of the hypoxic status of joint SFs determined by pimonidazole in vivo. (L) Representative images of joint vascular leakage (Evan’s Blue), where articular score for individual paws and [total mouse score] are from one experiment representative of two independent models. Throughout, SFs were pooled from individual mice to generate representative explant cohorts with articular scores: (A-E, and I) CIA, 3.17 ± 1.38, n = 6; ES-62, 0.5 ± 0.22, n = 6; (F-H) CIA, 3.66 ± 1.5, n = 6; ES-62, 1.5 ± 1.15, n = 6; (K) CIA, 4.667 ±1.99, n = 6; ES-62, 0.8 ± 0.8, n = 5. In all panels, *p<0.05; **p<0.01; ***p<0.001 relative to CIA SFs.CC BY · PubMed Central
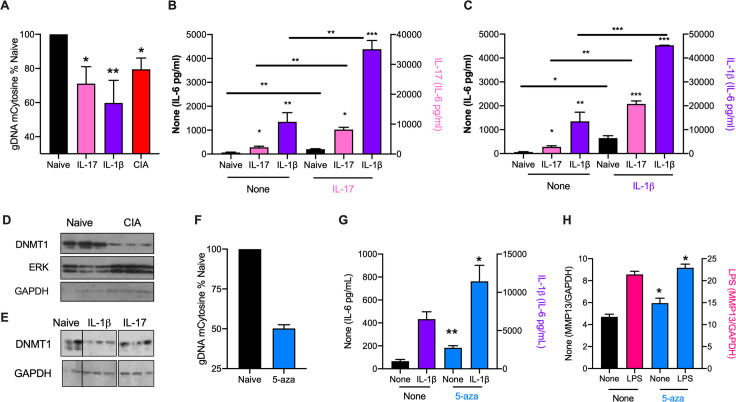
Fig 2 IL-1β and IL-17 rewire naïve SFs to a CIA-like phenotype. (A) Global methylation status of Naïve-SFs incubated in medium alone (Naïve) or chronically treated with IL-17 or IL-1β, compared to that of CIA-SFs. Data (means ± SEM) are from 3–5 independent experiments, normalized to “Naïve” controls. *p<0.05 and **p<0.01 are relative to Naïve-SFs. The CIA-SFs were from 3 independent models (articular scores: 3.6 ± 1.5, n = 6; 4.5 ± 1.3, n = 10 and 2.5 ± 0.8, n = 12). (B and C) Naïve-SFs incubated in medium alone (Naïve) or chronically treated with IL-17 or IL-1β were re-challenged with medium (None; B and C), or medium containing IL-17 (B) or IL-1β (C) and levels of IL-6 release determined. Data are means ± SEM of n = 3 independent cultures, where *p<0.05, **p<0.01 or ***p<0.001 are relative to the relevant Naïve-SF group (same control “None” data for B and C). Data in B are representative of 2 independent experiments. (D) Western blot analysis of DNMT1 expression in Naïve- and CIA- (articular score 3.6 ± 1.5, n = 6) SFs: each lane represents independent cultures and data (means ± SEM) were quantitated (DNMT1/GAPDH ratios normalized to Naïve controls) by ImageJ as Naïve, 1 ± 0.262 and CIA, 0.063 ± 0.004, **p<0.01. (E) Western blot analysis of DNMT1 expression in Naïve-SFs chronically treated with medium alone (Naïve) or containing IL-1β or IL-17, where lanes represent individual cultures. The data were quantitated (DNMT1/GAPDH ratios normalized to Naïve controls) by ImageJ as Naïve, 1 ± 0.22; IL-1β, 0.12 ± 0.02 and IL-17, 0.40 ± 0.14. (F-H) Naïve-SFs were chronically incubated in medium alone (None) or containing 5-aza and then assessed for (F) global DNA methylation status, (G) IL-6 release in response to IL-1β challenge and (H) MMP13 mRNA levels in response to LPS-stimulation. Data are presented as means ± SEM, where n = 3 independent cultures (F and G) or means ± SD, n = 3 triplicate analyses (H) and *p<0.05 or **p<0.01 relative to the appropriate sample lacking 5-aza (“None”).
Fig 2 IL-1β and IL-17 rewire naïve SFs to a CIA-like phenotype. (A) Global methylation status of Naïve-SFs incubated in medium alone (Naïve) or chronically treated with IL-17 or IL-1β, compared to that of CIA-SFs. Data (means ± SEM) are from 3–5 independent experiments, normalized to “Naïve” controls. *p<0.05 and **p<0.01 are relative to Naïve-SFs. The CIA-SFs were from 3 independent models (articular scores: 3.6 ± 1.5, n = 6; 4.5 ± 1.3, n = 10 and 2.5 ± 0.8, n = 12). (B and C) Naïve-SFs incubated in medium alone (Naïve) or chronically treated with IL-17 or IL-1β were re-challenged with medium (None; B and C), or medium containing IL-17 (B) or IL-1β (C) and levels of IL-6 release determined. Data are means ± SEM of n = 3 independent cultures, where *p<0.05, **p<0.01 or ***p<0.001 are relative to the relevant Naïve-SF group (same control “None” data for B and C). Data in B are representative of 2 independent experiments. (D) Western blot analysis of DNMT1 expression in Naïve- and CIA- (articular score 3.6 ± 1.5, n = 6) SFs: each lane represents independent cultures and data (means ± SEM) were quantitated (DNMT1/GAPDH ratios normalized to Naïve controls) by ImageJ as Naïve, 1 ± 0.262 and CIA, 0.063 ± 0.004, **p<0.01. (E) Western blot analysis of DNMT1 expression in Naïve-SFs chronically treated with medium alone (Naïve) or containing IL-1β or IL-17, where lanes represent individual cultures. The data were quantitated (DNMT1/GAPDH ratios normalized to Naïve controls) by ImageJ as Naïve, 1 ± 0.22; IL-1β, 0.12 ± 0.02 and IL-17, 0.40 ± 0.14. (F-H) Naïve-SFs were chronically incubated in medium alone (None) or containing 5-aza and then assessed for (F) global DNA methylation status, (G) IL-6 release in response to IL-1β challenge and (H) MMP13 mRNA levels in response to LPS-stimulation. Data are presented as means ± SEM, where n = 3 independent cultures (F and G) or means ± SD, n = 3 triplicate analyses (H) and *p<0.05 or **p<0.01 relative to the appropriate sample lacking 5-aza (“None”).CC BY · PubMed Central
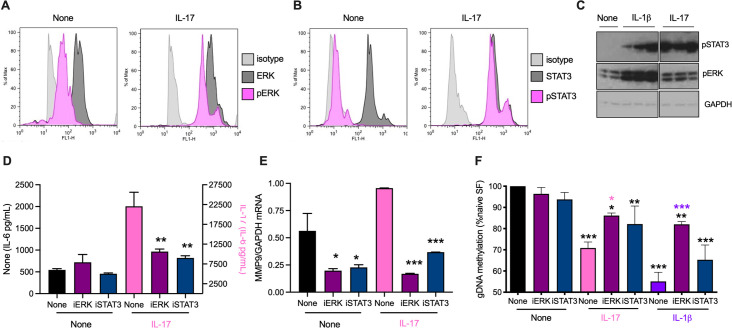
Fig 3 IL-17 and IL-1β stimulate ERK and STAT3 in SFs. Flow cytometric analysis of (A) ERK and (B) STAT3 activation, determining the relative expression of dually phosphorylated versus total ERK or phosphorylated STAT3 versus total STAT3 expression, following incubation of Naïve-SFs in medium alone or containing IL-17 for 20 min. (C) Naïve-SFs chronically incubated in medium alone (None) or containing IL-1β or IL-17 were analysed for pSTAT3, pERK and GAPDH expression by Western blot: individual lanes represent independent SF cultures. The data were quantitated (pSTAT3 or pERK/GAPDH ratios normalized to “None” controls) by ImageJ (Mean ± range, n = 2 for Naïve-SFs and Mean ± SEM, n = 3 for CIA- and ES-62-CIA SFs). For pSTAT3: None, 1 ± 0.51; IL-1β, 11.53 ± 5.06 and IL-17, 22.09 ± 5.14 and pERK: None, 1 ± 0.24; IL-1β, 2.65 ± 0.29 and IL-17, 1.14 ± 0.13. Naïve-SFs, pretreated with iERK or iSTAT3 for two hours, were incubated in medium alone (None) or with IL-17 overnight and levels of IL-6 release (D) or MMP9 mRNA (E) measured. (F) Naïve-SFs pretreated with iERK and iSTAT3 for two hours were chronically incubated in medium alone (None) or containing IL-17 or IL-1β and then their global DNA methylation assessed. Data are mean values ± SEM, n = 3 independent cultures and where *p<0.05, **p<0.01 and ***p<0.001 relative to appropriate None control (D and E) and None/None control (F) and where for iERK, *p <0.05 (pink) is relative to its IL-17 control and ***p<0.001 (purple) is relative to its IL-1β control (F).
Fig 3 IL-17 and IL-1β stimulate ERK and STAT3 in SFs. Flow cytometric analysis of (A) ERK and (B) STAT3 activation, determining the relative expression of dually phosphorylated versus total ERK or phosphorylated STAT3 versus total STAT3 expression, following incubation of Naïve-SFs in medium alone or containing IL-17 for 20 min. (C) Naïve-SFs chronically incubated in medium alone (None) or containing IL-1β or IL-17 were analysed for pSTAT3, pERK and GAPDH expression by Western blot: individual lanes represent independent SF cultures. The data were quantitated (pSTAT3 or pERK/GAPDH ratios normalized to “None” controls) by ImageJ (Mean ± range, n = 2 for Naïve-SFs and Mean ± SEM, n = 3 for CIA- and ES-62-CIA SFs). For pSTAT3: None, 1 ± 0.51; IL-1β, 11.53 ± 5.06 and IL-17, 22.09 ± 5.14 and pERK: None, 1 ± 0.24; IL-1β, 2.65 ± 0.29 and IL-17, 1.14 ± 0.13. Naïve-SFs, pretreated with iERK or iSTAT3 for two hours, were incubated in medium alone (None) or with IL-17 overnight and levels of IL-6 release (D) or MMP9 mRNA (E) measured. (F) Naïve-SFs pretreated with iERK and iSTAT3 for two hours were chronically incubated in medium alone (None) or containing IL-17 or IL-1β and then their global DNA methylation assessed. Data are mean values ± SEM, n = 3 independent cultures and where *p<0.05, **p<0.01 and ***p<0.001 relative to appropriate None control (D and E) and None/None control (F) and where for iERK, *p <0.05 (pink) is relative to its IL-17 control and ***p<0.001 (purple) is relative to its IL-1β control (F).CC BY · PubMed Central
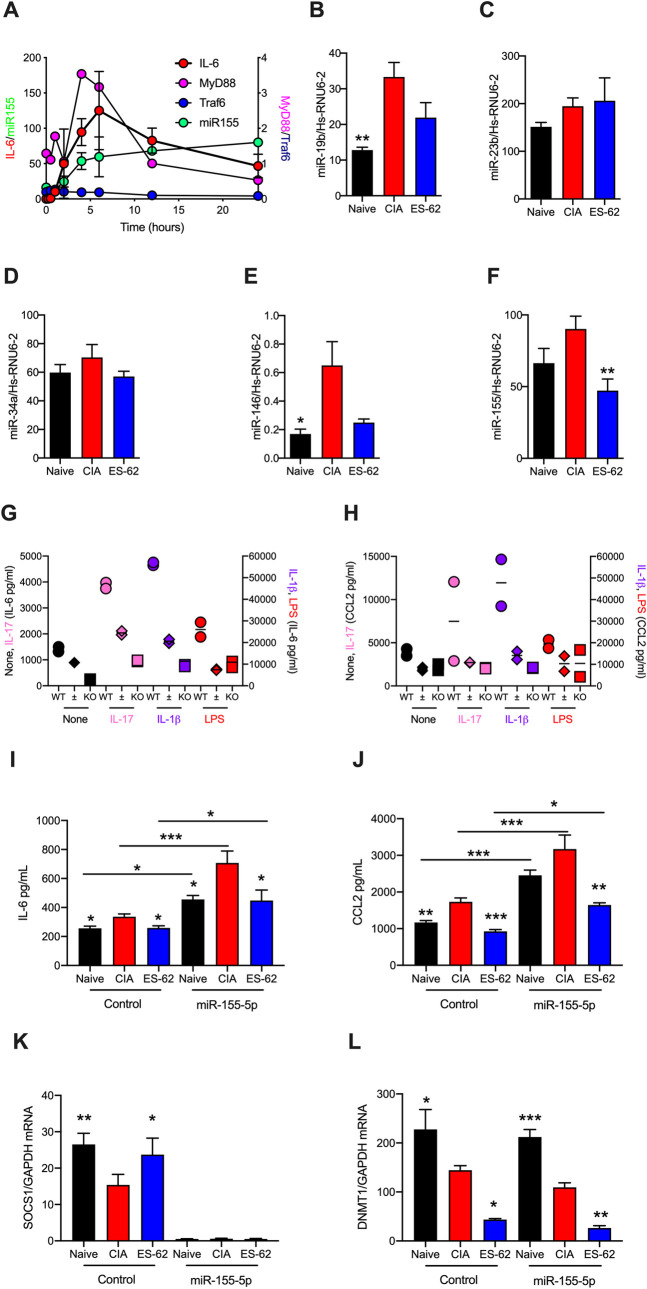
Fig 4 miR-146 and -155 are potential targets of ES-62 in suppressing the hyper-responsive CIA-SF phenotype. (A) Naïve-SFs were stimulated with LPS for the indicated times and miR-155, MyD88, Traf6 and IL-6 mRNA levels measured. Data are presented as mean values ± SEM, n = 4 for miR-155, mean ± range, n = 2 for IL-6 and single experiments for the other mediators. (B-F) Expression levels of the indicated miRs were determined for SFs from Naïve, CIA (articular score: 4.67 ± 2, n = 6) and ES-62-CIA (0.8 ± 0.8, n = 6) mice stimulated with LPS for 6 h and data presented as mean values ± SEM, n = 4–6 independent cultures and where *p<0.05 and **p< 0.01 relative to the CIA group. Although miR-19b or- 146 expression in ES-62-CIA-SFs was not significantly reduced (p = 0.06 and 0.07, respectively) when compared to that of CIA-SFs, it was not significantly elevated relative to that in the Naïve-SF controls. (G and H) SFs from wild type and miR-155 heterozygous (±) and homozygous (KO) C57BL/6 mice were incubated with the indicated stimuli and IL-6 (G) and CCL2 (H) release measured. Data shown represent the mean values (of triplicates) for two mice of each phenotype. (I-L) SFs from Naïve, CIA- (articular score 3.17 ± 1.38, n = 6) and ES-62-CIA- (articular score 0.5 ± 0.22, n = 6) mice were transfected for 24 hours with miR-155-5p mimic (50 nM) or control miR and then IL-6 and CCL2 release (I and J) and SOCS1 and DNMT1 mRNA levels (L and L) assessed. Data are from a single experiment and are expressed as the mean values (of triplicates) ± SEM, n = three independent cultures and where *p<0.05, **p<0.01, *** p<0.001. The IL-6 and CCL2 data were validated in an independent set of three cultures and further DNMT1 mRNA data are shown in Fig 5.
Fig 4 miR-146 and -155 are potential targets of ES-62 in suppressing the hyper-responsive CIA-SF phenotype. (A) Naïve-SFs were stimulated with LPS for the indicated times and miR-155, MyD88, Traf6 and IL-6 mRNA levels measured. Data are presented as mean values ± SEM, n = 4 for miR-155, mean ± range, n = 2 for IL-6 and single experiments for the other mediators. (B-F) Expression levels of the indicated miRs were determined for SFs from Naïve, CIA (articular score: 4.67 ± 2, n = 6) and ES-62-CIA (0.8 ± 0.8, n = 6) mice stimulated with LPS for 6 h and data presented as mean values ± SEM, n = 4–6 independent cultures and where *p<0.05 and **p< 0.01 relative to the CIA group. Although miR-19b or- 146 expression in ES-62-CIA-SFs was not significantly reduced (p = 0.06 and 0.07, respectively) when compared to that of CIA-SFs, it was not significantly elevated relative to that in the Naïve-SF controls. (G and H) SFs from wild type and miR-155 heterozygous (±) and homozygous (KO) C57BL/6 mice were incubated with the indicated stimuli and IL-6 (G) and CCL2 (H) release measured. Data shown represent the mean values (of triplicates) for two mice of each phenotype. (I-L) SFs from Naïve, CIA- (articular score 3.17 ± 1.38, n = 6) and ES-62-CIA- (articular score 0.5 ± 0.22, n = 6) mice were transfected for 24 hours with miR-155-5p mimic (50 nM) or control miR and then IL-6 and CCL2 release (I and J) and SOCS1 and DNMT1 mRNA levels (L and L) assessed. Data are from a single experiment and are expressed as the mean values (of triplicates) ± SEM, n = three independent cultures and where *p<0.05, **p<0.01, *** p<0.001. The IL-6 and CCL2 data were validated in an independent set of three cultures and further DNMT1 mRNA data are shown in Fig 5.CC BY · PubMed Central
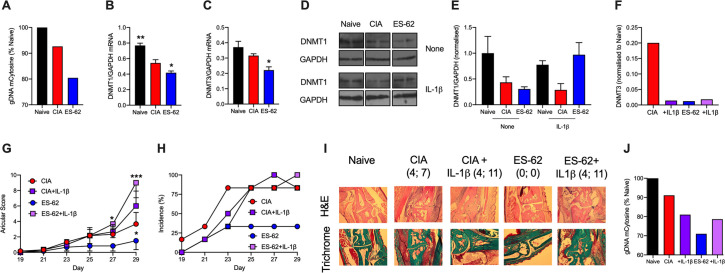
Fig 5 ES-62 induces a CIA-SF phenotype distinct from Naïve-SFs. SFs from Naïve, CIA and ES-62-CIA mice were assessed for their levels of (A) global DNA methylation and DNMT1 (B) and DNMT3 (C) mRNA expression, where data are mean values ± SEM, n = 3 independent cultures and *p<0.05 and **p<0.01 are relative to CIA-SFs. (D) Western blot analysis of DNMT1 expression in independent cultures incubated in medium alone or containing IL-1β for 24 h and the data (means ± range) quantitated by ImageJ software presented (E) as DNMT1/GAPDH ratios normalized to the “Naïve-None” controls. Pooled data from 6 independent cultures (normalized to Naïve controls) showed relative DNMT1 expression to be: Naïve, 1 ± 0.18; CIA, 0.24 ± 0.10 and ES-62, 0.26 ± 0.06, where ***p<0.001 for Naïve versus CIA or ES-62. (F) SFs from CIA- and ES-62-CIA mice were treated with medium or medium containing IL-1β for 24 h and the levels of DNMT3 mRNA determined and normalized to Naïve controls. Throughout, SFs were pooled from individual mice to generate representative cohorts with articular scores: (A and F) CIA, 4.75 ± 1.31, n = 8 and ES-62-CIA, 0, n = 6; (B-E) CIA, 3.66 ± 1.5, n = 6 and ES-62-CIA, 1.5 ± 1.15 n = 6. (G-J) CIA was induced in mice treated with PBS (CIA) or ES-62 on days -2, 0 and 21 and then with PBS or IL-1β (1 μg/dose) twice-weekly from day 21 and articular scores (G) and incidence of pathology (H) monitored. The experiment was terminated prior to full pathology being established in the CIA control cohort due to the severity of joint disease in the IL-1β treatment groups. (G) Articular scores are presented as mean values ± SEM with n = 6 mice/group where *p<0.05 or ***p<0.001 are relative to the CIA group and (H) incidence represents the % mice displaying scores >1. (I) Representative sections of joint pathology displaying both the score of the joint shown and total articular score of the mouse presented. (J) global methylation status of SFs from the indicated cohorts of this CIA ± IL-1β model.
Fig 5 ES-62 induces a CIA-SF phenotype distinct from Naïve-SFs. SFs from Naïve, CIA and ES-62-CIA mice were assessed for their levels of (A) global DNA methylation and DNMT1 (B) and DNMT3 (C) mRNA expression, where data are mean values ± SEM, n = 3 independent cultures and *p<0.05 and **p<0.01 are relative to CIA-SFs. (D) Western blot analysis of DNMT1 expression in independent cultures incubated in medium alone or containing IL-1β for 24 h and the data (means ± range) quantitated by ImageJ software presented (E) as DNMT1/GAPDH ratios normalized to the “Naïve-None” controls. Pooled data from 6 independent cultures (normalized to Naïve controls) showed relative DNMT1 expression to be: Naïve, 1 ± 0.18; CIA, 0.24 ± 0.10 and ES-62, 0.26 ± 0.06, where ***p<0.001 for Naïve versus CIA or ES-62. (F) SFs from CIA- and ES-62-CIA mice were treated with medium or medium containing IL-1β for 24 h and the levels of DNMT3 mRNA determined and normalized to Naïve controls. Throughout, SFs were pooled from individual mice to generate representative cohorts with articular scores: (A and F) CIA, 4.75 ± 1.31, n = 8 and ES-62-CIA, 0, n = 6; (B-E) CIA, 3.66 ± 1.5, n = 6 and ES-62-CIA, 1.5 ± 1.15 n = 6. (G-J) CIA was induced in mice treated with PBS (CIA) or ES-62 on days -2, 0 and 21 and then with PBS or IL-1β (1 μg/dose) twice-weekly from day 21 and articular scores (G) and incidence of pathology (H) monitored. The experiment was terminated prior to full pathology being established in the CIA control cohort due to the severity of joint disease in the IL-1β treatment groups. (G) Articular scores are presented as mean values ± SEM with n = 6 mice/group where *p<0.05 or ***p<0.001 are relative to the CIA group and (H) incidence represents the % mice displaying scores >1. (I) Representative sections of joint pathology displaying both the score of the joint shown and total articular score of the mouse presented. (J) global methylation status of SFs from the indicated cohorts of this CIA ± IL-1β model.CC BY · PubMed Central
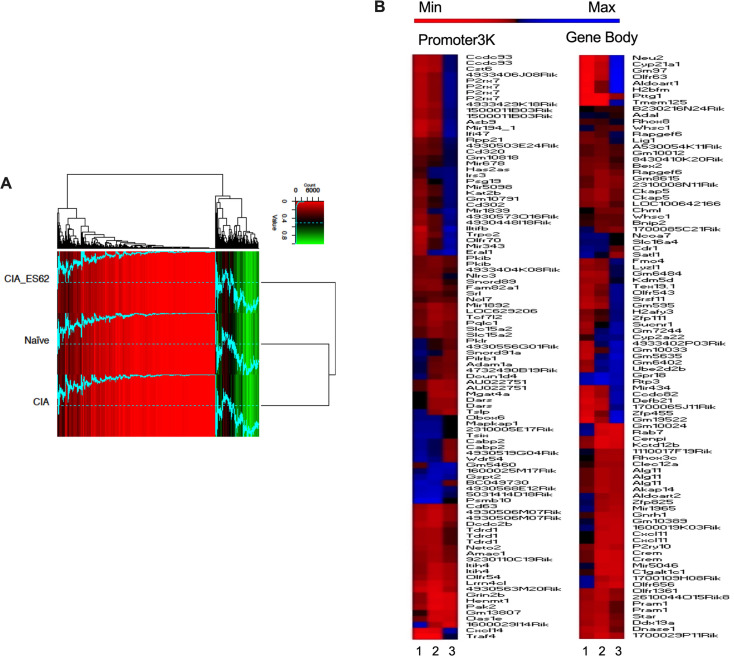
Fig 6 ES-62 induces a DNA methylation phenotype distinct from that of both Naïve- and CIA-SFs. RRBS DNA methylome analysis was performed on SFs from joints representative of the Naïve, CIA (articular score each 3 or 4) and ES-62-CIA (articular score each 0 or 1) cohorts. (A) A heatmap of methylation percentages of “Promoter2K” regions (0–2,000bp upstream of TSS) for all cohorts, hierarchically clustered using the Euclidean distance metric. Bright red indicates 0% methylation, black indicates 50% methylation, and bright green indicates 100% methylation. The blue line corresponds to the methylation percentage of the respective regions, thus facilitating visual comparison of methylation percentages across samples (the dotted line represents 50% methylation for reference). (B) Methylome analysis of SFs from Naive, CIA- and ES-62-CIA mice showing Heat Map analysis of the top 100 differentially methylated loci in the Promoter3K (left panel) and Gene Body (right panel) regions of total genomic DNA. In each case, hypo (red) or hyper (blue) methylation in SFs from PBS- or ES-62-treated CIA-mice relative to SFs from healthy, naïve mice is shown in lanes 1 and 2 respectively, whilst that of SFs from ES-62- relative to PBS-treated CIA-mice is shown in lane 3.
Fig 6 ES-62 induces a DNA methylation phenotype distinct from that of both Naïve- and CIA-SFs. RRBS DNA methylome analysis was performed on SFs from joints representative of the Naïve, CIA (articular score each 3 or 4) and ES-62-CIA (articular score each 0 or 1) cohorts. (A) A heatmap of methylation percentages of “Promoter2K” regions (0–2,000bp upstream of TSS) for all cohorts, hierarchically clustered using the Euclidean distance metric. Bright red indicates 0% methylation, black indicates 50% methylation, and bright green indicates 100% methylation. The blue line corresponds to the methylation percentage of the respective regions, thus facilitating visual comparison of methylation percentages across samples (the dotted line represents 50% methylation for reference). (B) Methylome analysis of SFs from Naive, CIA- and ES-62-CIA mice showing Heat Map analysis of the top 100 differentially methylated loci in the Promoter3K (left panel) and Gene Body (right panel) regions of total genomic DNA. In each case, hypo (red) or hyper (blue) methylation in SFs from PBS- or ES-62-treated CIA-mice relative to SFs from healthy, naïve mice is shown in lanes 1 and 2 respectively, whilst that of SFs from ES-62- relative to PBS-treated CIA-mice is shown in lane 3.CC BY · PubMed Central
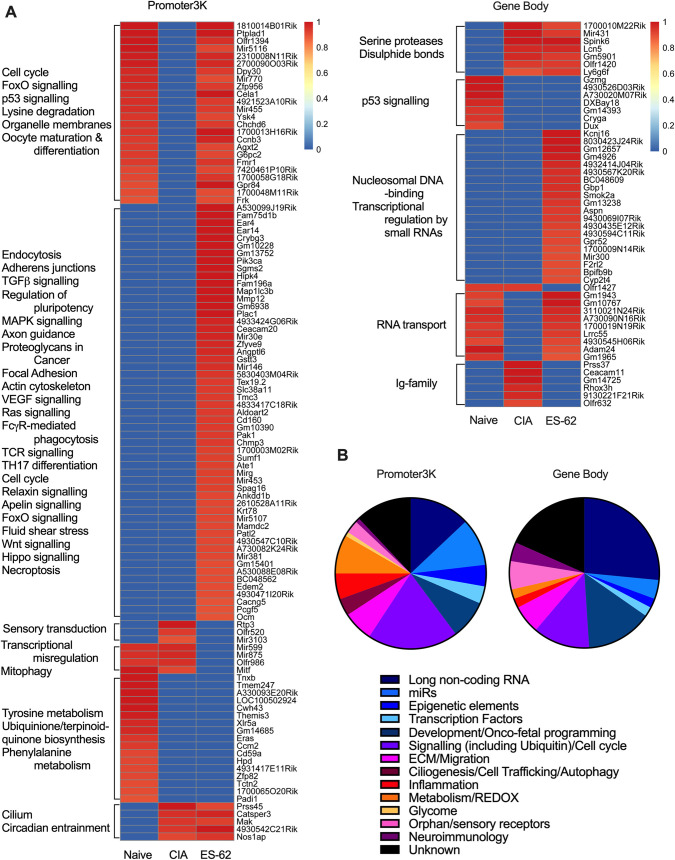
Fig 7 Binary analysis of the DNA methylome indicates differential silencing and activation of genes in SFs from Naïve, CIA and ES-62-CIA mice. Hierarchical clustering heatmaps (A) were constructed for the Promoter3K and Gene Body regions analysing genes which were either essentially fully methylated (>0.9) or demethylated (0) at these sites in one or more of the treatment groups. The heatmap clusters are annotated with predicted KEGG pathway interactions and the functional classification of genes constituting these binary DNA methylation signatures differentially targeted in pathogenic (CIA) and protective (ES-62) rewiring of SFs are summarized in the pie-charts according to the accompanying colour code (B).
Fig 7 Binary analysis of the DNA methylome indicates differential silencing and activation of genes in SFs from Naïve, CIA and ES-62-CIA mice. Hierarchical clustering heatmaps (A) were constructed for the Promoter3K and Gene Body regions analysing genes which were either essentially fully methylated (>0.9) or demethylated (0) at these sites in one or more of the treatment groups. The heatmap clusters are annotated with predicted KEGG pathway interactions and the functional classification of genes constituting these binary DNA methylation signatures differentially targeted in pathogenic (CIA) and protective (ES-62) rewiring of SFs are summarized in the pie-charts according to the accompanying colour code (B).CC BY · PubMed Central
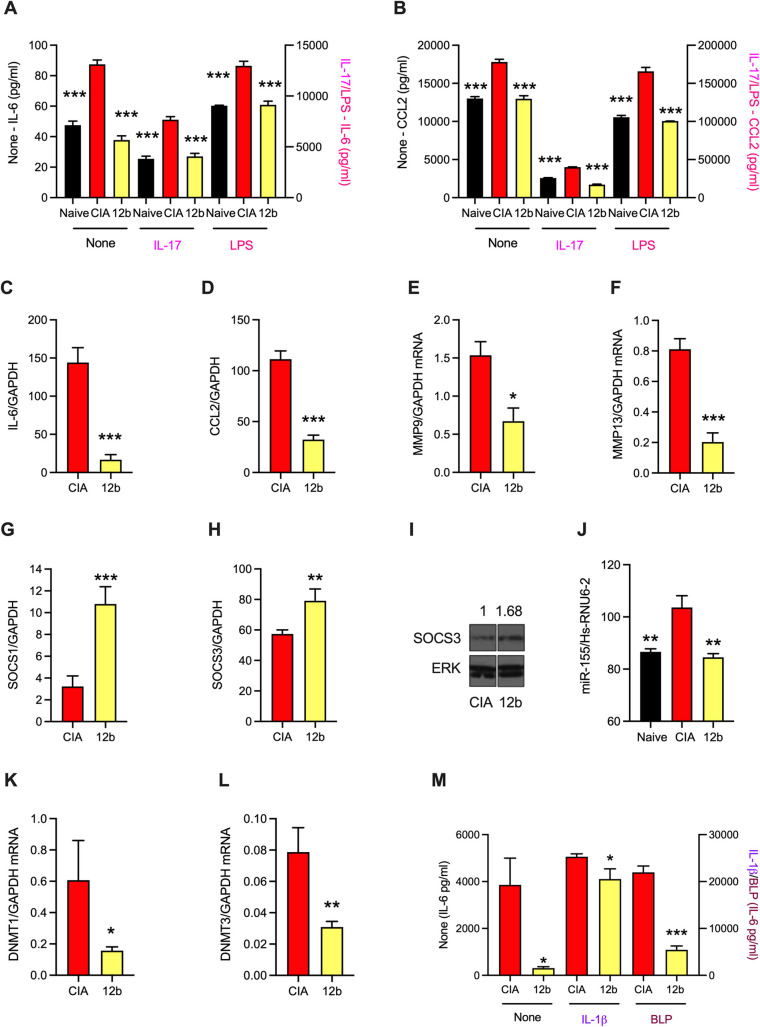
Fig 8 Exposure of CIA-mice to SMA 12b in vivo results in SF hypo-responsiveness ex vivo. Mice were treated with PBS or 12b (1 μg/dose s/c) at days -2, 0 and 21 of the CIA protocol. Naïve-, CIA- and 12b-CIA SFs (12b) were incubated in medium (None), or medium containing either IL-17 (25 ng/ml) or LPS (1 μg/ml) as indicated for 24 h and IL-6 (A) or CCL2 (B) release measured. Levels of mRNA (normalised to GAPDH) in the indicated groups of SFs were determined for IL-6 (C), CCL2 (D), MMP9 (E), MMP13 (F), SOCS1 (G) and SOCS3 (H). For SOCS1 (G), the CIA control data are the same as those presented in Fig 1H. Data are presented as means ± SEM values of 3 independent cultures except for MMP9 and MMP13, where data are means ± SD, n = 3 from a single culture. (I) Western blot determination of SOCS3 expression in CIA and 12b SFs is normalised to that of ERK by Image J analysis. (J) Naïve-, CIA- and 12b-CIA SFs (12b) were treated with LPS for 6h and levels of miR-155 determined and the data presented as mean ± SEM values for three independent cultures. Levels of DNMT1 (K) and DNMT3 (L) mRNA (normalised to GAPDH) in CIA and 12b SFs are presented as means ± SD, n = 3 from a single culture. (M) From the first appearance of clinical articular score following challenge with collagen II (CII) at d21, mice were randomly allocated to blinded treatments (PBS or 12b, 1 μg/dose s/c) every 3 days until cull. CIA- and 12b-SFs were incubated in medium (None), or medium + either IL-1β (10 ng/ml) or BLP (0.5 μg/ml) for 24 h and IL-6 release measured. Data are mean ± SEM values of 3 independent cultures (each assayed in triplicate). Throughout, SFs were pooled from individual mice to generate representative explant cohorts with articular scores: (A-L) CIA, 3.66 ± 1.50, n = 6; 12b, 0.71 ± 0.36, n = 6 and (M) CIA, 5.50 ± 0.96, n = 4; 12b, 2.33 ± 0.33, n = 3. For statistical analysis, *p<0.05, **p<0.01 and ***p<0.001 are for the indicated responses relative to the CIA group.
Fig 8 Exposure of CIA-mice to SMA 12b in vivo results in SF hypo-responsiveness ex vivo. Mice were treated with PBS or 12b (1 μg/dose s/c) at days -2, 0 and 21 of the CIA protocol. Naïve-, CIA- and 12b-CIA SFs (12b) were incubated in medium (None), or medium containing either IL-17 (25 ng/ml) or LPS (1 μg/ml) as indicated for 24 h and IL-6 (A) or CCL2 (B) release measured. Levels of mRNA (normalised to GAPDH) in the indicated groups of SFs were determined for IL-6 (C), CCL2 (D), MMP9 (E), MMP13 (F), SOCS1 (G) and SOCS3 (H). For SOCS1 (G), the CIA control data are the same as those presented in Fig 1H. Data are presented as means ± SEM values of 3 independent cultures except for MMP9 and MMP13, where data are means ± SD, n = 3 from a single culture. (I) Western blot determination of SOCS3 expression in CIA and 12b SFs is normalised to that of ERK by Image J analysis. (J) Naïve-, CIA- and 12b-CIA SFs (12b) were treated with LPS for 6h and levels of miR-155 determined and the data presented as mean ± SEM values for three independent cultures. Levels of DNMT1 (K) and DNMT3 (L) mRNA (normalised to GAPDH) in CIA and 12b SFs are presented as means ± SD, n = 3 from a single culture. (M) From the first appearance of clinical articular score following challenge with collagen II (CII) at d21, mice were randomly allocated to blinded treatments (PBS or 12b, 1 μg/dose s/c) every 3 days until cull. CIA- and 12b-SFs were incubated in medium (None), or medium + either IL-1β (10 ng/ml) or BLP (0.5 μg/ml) for 24 h and IL-6 release measured. Data are mean ± SEM values of 3 independent cultures (each assayed in triplicate). Throughout, SFs were pooled from individual mice to generate representative explant cohorts with articular scores: (A-L) CIA, 3.66 ± 1.50, n = 6; 12b, 0.71 ± 0.36, n = 6 and (M) CIA, 5.50 ± 0.96, n = 4; 12b, 2.33 ± 0.33, n = 3. For statistical analysis, *p<0.05, **p<0.01 and ***p<0.001 are for the indicated responses relative to the CIA group.CC BY · PubMed Central
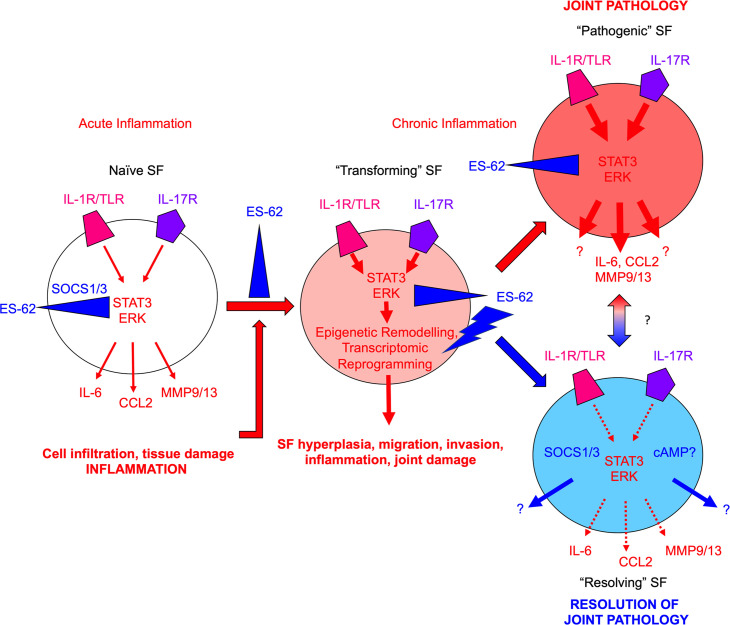
Fig 9 Model of ES-62 action in SFs during CIA. Healthy SFs (Naïve) respond to acute pro-inflammatory signals (e.g., IL-1β/IL-17) in the joint microenvironment resulting in release of pathological mediators such as IL-6, CCL2 and MMP9/13, which cause cell (neutrophils, macrophages, lymphocytes) infiltration and tissue damage, resulting in chronic inflammation. In addition to perpetuating joint inflammation and damage, chronic inflammation drives rewiring of the epigenetic landscape and consequently, reprogramming of the SFs to a “pathogenic” aggressive hyperplastic, migrating and invasive phenotype that, via its hyper-responsiveness to environmental cues, plays a key role in joint pathology and destruction (all pathogenic signals denoted by red arrows with imprinted hyper-responsiveness represented by increased arrow size and redness of SF). ES-62 can disrupt this process at multiple points: thus, it can inhibit (blue blocking symbol) the (i) initial pro-inflammatory signalling to suppress acute inflammation; (ii) inflammatory signals generated by infiltrating cells and tissue damage to suppress induction of chronic inflammation; (iii) signalling associated with chronic inflammation to suppress transformation of SFs to an aggressive hyper-responsive phenotype and (iv) pathogenic signals in aggressive SFs during established disease. Consistent with our findings that ES-62 does not simply maintain/restore the Naïve-SF phenotype, it also exhibits positive actions (blue lightning bolt symbol), specifically inducing epigenetic remodelling (perhaps of an intermediate anti-inflammatory SF phenotype, generated by inhibition of pathogenic ERK and STAT3 signalling) that reprograms the cell to an inflammation-resolving and tissue repair phenotype. The potential ability of the “resolving” ES-62-CIA-SFs to also directly influence the behavior of “pathogenic” SFs in the joint during established disease is represented by the red-blue gradient arrow.
Fig 9 Model of ES-62 action in SFs during CIA. Healthy SFs (Naïve) respond to acute pro-inflammatory signals (e.g., IL-1β/IL-17) in the joint microenvironment resulting in release of pathological mediators such as IL-6, CCL2 and MMP9/13, which cause cell (neutrophils, macrophages, lymphocytes) infiltration and tissue damage, resulting in chronic inflammation. In addition to perpetuating joint inflammation and damage, chronic inflammation drives rewiring of the epigenetic landscape and consequently, reprogramming of the SFs to a “pathogenic” aggressive hyperplastic, migrating and invasive phenotype that, via its hyper-responsiveness to environmental cues, plays a key role in joint pathology and destruction (all pathogenic signals denoted by red arrows with imprinted hyper-responsiveness represented by increased arrow size and redness of SF). ES-62 can disrupt this process at multiple points: thus, it can inhibit (blue blocking symbol) the (i) initial pro-inflammatory signalling to suppress acute inflammation; (ii) inflammatory signals generated by infiltrating cells and tissue damage to suppress induction of chronic inflammation; (iii) signalling associated with chronic inflammation to suppress transformation of SFs to an aggressive hyper-responsive phenotype and (iv) pathogenic signals in aggressive SFs during established disease. Consistent with our findings that ES-62 does not simply maintain/restore the Naïve-SF phenotype, it also exhibits positive actions (blue lightning bolt symbol), specifically inducing epigenetic remodelling (perhaps of an intermediate anti-inflammatory SF phenotype, generated by inhibition of pathogenic ERK and STAT3 signalling) that reprograms the cell to an inflammation-resolving and tissue repair phenotype. The potential ability of the “resolving” ES-62-CIA-SFs to also directly influence the behavior of “pathogenic” SFs in the joint during established disease is represented by the red-blue gradient arrow.CC BY · PubMed Central

Verification

Claims the paper makes

The claims and statistics of this paper haven’t been checked yet.

Run the check — free, no account needed. It reads the open-access text and checks the sources it cites.

A few free checks a day · papers already verified open instantly · results are public

Claims other papers make about this one

Each is checked against this paper’s own text: does it say what the citing paper says it does?

Self-check

Percentages, sums and reported differences re-computed from the paper’s own numbers.

The self-check needs the paper’s full text.

Citations

Cites

Show all 7 references

Research works printed but not linked: 92

  1. G Nygaard, 2020, Restoring synovial homeostasis in rheumatoid arthritis by targeting fibroblast-like synoviocytes., Nat Rev Rheumatol, 16, 316, 10.1038/s41584-020-0413-5 · DOI
  2. IB McInnes, 2017, Pathogenetic insights from the treatment of rheumatoid arthritis, Lancet, 389, 2328, 10.1016/S0140-6736(17)31472-1 · DOI
  3. MM Steenvoorden, 2006, Transition of healthy to diseased synovial tissue in rheumatoid arthritis is associated with gain of mesenchymal/fibrotic characteristics., Arthritis Research & Therapy, 8, R165, 10.1186/ar2073 · DOI
  4. MV Nemtsova, 2019, Epigenetic Changes in the Pathogenesis of Rheumatoid Arthritis., Frontiers in Genetics, 10, 570, 10.3389/fgene.2019.00570 · DOI
  5. U Fearon, 2016, Hypoxia, mitochondrial dysfunction and synovial invasiveness in rheumatoid arthritis., Nat Rev Rheumatol, 12, 385, 10.1038/nrrheum.2016.69 · DOI
  6. E Karouzakis, 2009, DNA hypomethylation in rheumatoid arthritis synovial fibroblasts, Arthritis and Rheumatism, 60, 3613, 10.1002/art.25018 · DOI
  7. E Karouzakis, 2018, Analysis of early changes in DNA methylation in synovial fibroblasts of RA patients before diagnosis, Scientific Reports, 8, 7370, 10.1038/s41598-018-24240-2 · DOI
  8. K Nakano, 2013, DNA methylome signature in rheumatoid arthritis, Ann Rheum Dis, 72, 110, 10.1136/annrheumdis-2012-201526 · DOI
  9. J Doonan, 2019, The parasitic worm product ES-62 normalises the gut microbiota bone marrow axis in inflammatory arthritis, Nature Communications, 10, 1554, 10.1038/s41467-019-09361-0 · DOI
  10. MA Pineda, 2012, The parasitic helminth product ES-62 suppresses pathogenesis in collagen-induced arthritis by targeting the interleukin-17-producing cellular network at multiple sites, Arthritis and Rheumatism, 64, 3168, 10.1002/art.34581 · DOI
  11. MA Pineda, 2014, ES-62 protects against collagen-induced arthritis by resetting interleukin-22 toward resolution of inflammation in the joints, Arthritis Rheumatol, 66, 1492, 10.1002/art.38392 · DOI
  12. DT Rodgers, 2014, Protection against collagen-induced arthritis in mice afforded by the parasitic worm product, ES-62, is associated with restoration of the levels of interleukin-10-producing B cells and reduced plasma cell infiltration of the joints, Immunology, 141, 457, 10.1111/imm.12208 · DOI
  13. J Sharma, 2019, 3rd. Therapeutic Implication of SOCS1 Modulation in the Treatment of Autoimmunity and Cancer., Frontiers in Pharmacology, 10, 324, 10.3389/fphar.2019.00324 · DOI
  14. CJ Malemud, 2017, Negative Regulators of JAK/STAT Signaling in Rheumatoid Arthritis and Osteoarthritis, International Journal of Molecular Sciences, 18, 10.3390/ijms18030484 · DOI
  15. Y Zhang, 2013, Synergistic effects of interleukin-1beta and interleukin-17A antibodies on collagen-induced arthritis mouse model, Int Immunopharmacol, 15, 199, 10.1016/j.intimp.2012.12.010 · DOI
  16. T Oike, 2017, Stat3 as a potential therapeutic target for rheumatoid arthritis., Scientific Reports, 7, 10965, 10.1038/s41598-017-11233-w · DOI
  17. V Paunovic, 2013, Mitogen-activated protein kinases as therapeutic targets for rheumatoid arthritis., Drugs, 73, 101, 10.1007/s40265-013-0014-6 · DOI · Paper page
  18. M Gadina, 2017, Small molecules to the rescue: Inhibition of cytokine signaling in immune-mediated diseases, Journal of Autoimmunity
  19. R Ganesan, 2017, Interleukin 17 regulates SHP-2 and IL-17RA/STAT-3 dependent Cyr61, IL-23 and GM-CSF expression and RANKL mediated osteoclastogenesis by fibroblast-like synoviocytes in rheumatoid arthritis, Molecular Immunology, 91, 134, 10.1016/j.molimm.2017.09.003 · DOI
  20. G Evangelatos, 2019, MicroRNAs in rheumatoid arthritis: From pathogenesis to clinical impact, Autoimmunity Reviews, 18, 102391, 10.1016/j.autrev.2019.102391 · DOI
  21. W Hong, 2018, The Effects of MicroRNAs on Key Signalling Pathways and Epigenetic Modification in Fibroblast-Like Synoviocytes of Rheumatoid Arthritis., Mediators Inflamm, 2018, 9013124, 10.1155/2018/9013124 · DOI
  22. AR Sharma, 2016, miRNA-Regulated Key Components of Cytokine Signaling Pathways and Inflammation in Rheumatoid Arthritis., Med Res Rev, 36, 425, 10.1002/med.21384 · DOI
  23. LC Su, 2017, Role of microRNA-155 in rheumatoid arthritis, International Journal of Rheumatic Diseases, 20, 1631, 10.1111/1756-185X.13202 · DOI
  24. J Stanczyk, 2008, Altered expression of MicroRNA in synovial fibroblasts and synovial tissue in rheumatoid arthritis, Arthritis and Rheumatism, 58, 1001, 10.1002/art.23386 · DOI
  25. S Abdollahi-Roodsaz, 2011, Trapped in a vicious loop: Toll-like receptors sustain the spontaneous cytokine production by rheumatoid synovium. Arthritis Research &, Therapy, 13, 105
  26. MI Arleevskaya, 2020, Toll-Like Receptors, Infections, and Rheumatoid Arthritis. Clinical Reviews in Allergy &, Immunology, 58, 172
  27. S Alivernini, 2017, MicroRNA-155-at the Critical Interface of Innate and Adaptive Immunity in Arthritis., Frontiers in Immunology, 8, 1932, 10.3389/fimmu.2017.01932 · DOI
  28. S Bluml, 2011, Essential role of microRNA-155 in the pathogenesis of autoimmune arthritis in mice, Arthritis and Rheumatism, 63, 1281, 10.1002/art.30281 · DOI
  29. M Kurowska-Stolarska, 2011, MicroRNA-155 as a proinflammatory regulator in clinical and experimental arthritis, Proceedings of the National Academy of Sciences of the United States of America, 108, 11193, 10.1073/pnas.1019536108 · DOI
  30. J Stanczyk, 2011, Altered expression of microRNA-203 in rheumatoid arthritis synovial fibroblasts and its role in fibroblast activation, Arthritis and Rheumatism, 63, 373, 10.1002/art.30115 · DOI
  31. L Long, 2013, Upregulated microRNA-155 expression in peripheral blood mononuclear cells and fibroblast-like synoviocytes in rheumatoid arthritis. Clinical &, Developmental Immunology, 2013, 296139
  32. N Liu, 2017, Paeonol protects against TNF-alpha-induced proliferation and cytokine release of rheumatoid arthritis fibroblast-like synoviocytes by upregulating FOXO3 through inhibition of miR-155 expression, Inflamm Res, 66, 603, 10.1007/s00011-017-1041-7 · DOI
  33. Z Xie, 2018, PU.1 attenuates TNFalphainduced proliferation and cytokine release of rheumatoid arthritis fibroblastlike synoviocytes by regulating miR155 activity, Molecular Medicine Reports, 17, 8349
  34. Y Wang, 2020, miR-155 promotes fibroblast-like synoviocyte proliferation and inflammatory cytokine secretion in rheumatoid arthritis by targeting FOXO3a., Experimental and Therapeutic Medicine, 19, 1288
  35. B Brandstetter, 2019, FOXO3 is involved in the tumor necrosis factor-driven inflammatory response in fibroblast-like synoviocytes, Lab Invest, 99, 648, 10.1038/s41374-018-0184-7 · DOI
  36. R Nakagawa, 2016, MicroRNA-155 controls affinity-based selection by protecting c-MYC+ B cells from apoptosis, The Journal of Clinical Investigation, 126, 377, 10.1172/JCI82914 · DOI
  37. TH Thai, 2007, Regulation of the germinal center response by microRNA-155., Science (New York, NY, 316, 604, 10.1126/science.1141229 · DOI
  38. X Li, 2013, Rheumatoid arthritis-associated microRNA-155 targets SOCS1 and upregulates TNF-alpha and IL-1beta in PBMCs, International Journal of Molecular Sciences, 14, 23910, 10.3390/ijms141223910 · DOI
  39. H Gujar, 2019, The Roles of Human DNA Methyltransferases and Their Isoforms in Shaping the Epigenome., Genes, 10, 10.3390/genes10020172 · DOI
  40. K Nakano, 2013, Regulation of DNA methylation in rheumatoid arthritis synoviocytes, J Immunol, 190, 1297, 10.4049/jimmunol.1202572 · DOI
  41. JW Whitaker, 2013, An imprinted rheumatoid arthritis methylome signature reflects pathogenic phenotype, Genome Med, 5, 40, 10.1186/gm444 · DOI
  42. F Brenet, 2011, DNA methylation of the first exon is tightly linked to transcriptional silencing, PLoS ONE, 6, e14524, 10.1371/journal.pone.0014524 · DOI
  43. A Jeltsch, 2014, New concepts in DNA methylation, Trends in Biochemical Sciences, 39, 310, 10.1016/j.tibs.2014.05.002 · DOI
  44. G Lev Maor, 2015, The alternative role of DNA methylation in splicing regulation, Trends Genet, 31, 274, 10.1016/j.tig.2015.03.002 · DOI
  45. R Tirado-Magallanes, 2017, Whole genome DNA methylation: beyond genes silencing, Oncotarget, 8, 5629, 10.18632/oncotarget.13562 · DOI
  46. D Kopinke, 2020, Developmental and regenerative paradigms of cilia regulated hedgehog signaling, Semin Cell Dev Biol
  47. GJ Yoshida, 2020, Regulation of heterogeneous cancer-associated fibroblasts: the molecular pathology of activated signaling pathways, J Exp Clin Cancer Res, 39, 112, 10.1186/s13046-020-01611-0 · DOI
  48. MM Harnett, 2008, The phosphorycholine moiety of the filarial nematode immunomodulator ES-62 is responsible for its anti-inflammatory action in arthritis, Ann Rheum Dis, 67, 518, 10.1136/ard.2007.073502 · DOI
  49. J Rzepecka, 2015, Prophylactic and therapeutic treatment with a synthetic analogue of a parasitic worm product prevents experimental arthritis and inhibits IL-1beta production via NRF2-mediated counter-regulation of the inflammasome, Journal of Autoimmunity, 60, 59, 10.1016/j.jaut.2015.04.005 · DOI
  50. CJ Suckling, 2018, Small Molecule Analogues of the parasitic worm product ES-62 interact with the TIR domain of MyD88 to inhibit pro-inflammatory signalling., Scientific Reports, 8, 2123, 10.1038/s41598-018-20388-z · DOI
  51. MM Harnett, 2017, Can Parasitic Worms Cure the Modern World’s Ills?, Trends in Parasitology, 33, 694, 10.1016/j.pt.2017.05.007 · DOI
  52. DT Rodgers, 2015, The Parasitic Worm Product ES-62 Targets Myeloid Differentiation Factor 88-Dependent Effector Mechanisms to Suppress Antinuclear Antibody Production and Proteinuria in MRL/lpr Mice., Arthritis Rheumatol, 67, 1023, 10.1002/art.39004 · DOI
  53. HS Goodridge, 2004, In vivo exposure of murine dendritic cell and macrophage bone marrow progenitors to the phosphorylcholine-containing filarial nematode glycoprotein ES-62 polarizes their differentiation to an anti-inflammatory phenotype, Immunology, 113, 491, 10.1111/j.1365-2567.2004.01993.x · DOI
  54. XF Mei, 2019, DNA methylation and hydroxymethylation profiles reveal possible role of highly methylated TLR signaling on Fasciola gigantica excretory/secretory products (FgESPs) modulation of buffalo dendritic cells., Parasites & Vectors, 12, 358, 10.1186/s13071-019-3615-4 · DOI
  55. PC Cook, 2015, A dominant role for the methyl-CpG-binding protein Mbd2 in controlling Th2 induction by dendritic cells, Nature Communications, 6, 6920, 10.1038/ncomms7920 · DOI
  56. GR Jones, 2020, The Methyl-CpG-Binding Protein Mbd2 Regulates Susceptibility to Experimental Colitis via Control of CD11c(+) Cells and Colonic Epithelium., Frontiers in Immunology, 11, 183, 10.3389/fimmu.2020.00183 · DOI
  57. EA Mota, 2020, Epigenetic and parasitological parameters are modulated in EBi3-/- mice infected with Schistosoma mansoni., PLoS Neglected Tropical Diseases, 14, e0008080, 10.1371/journal.pntd.0008080 · DOI
  58. AR DiNardo, 2018, Schistosomiasis Induces Persistent DNA Methylation and Tuberculosis-Specific Immune Changes, J Immunol
  59. K Klar, 2017, Chronic schistosomiasis during pregnancy epigenetically reprograms T-cell differentiation in offspring of infected mothers, European Journal of Immunology, 47, 841, 10.1002/eji.201646836 · DOI
  60. BG Dewals, 2019, Maternal helminth infections and the shaping of offspring immunity, Parasite Immunology, 41, e12599, 10.1111/pim.12599 · DOI
  61. DM Roeleveld, 2015, The role of the Th17 cytokines IL-17 and IL-22 in Rheumatoid Arthritis pathogenesis and developments in cytokine immunotherapy, Cytokine, 74, 101, 10.1016/j.cyto.2014.10.006 · DOI
  62. S Nakae, 2003, Nambu, A., Sudo, K. & Iwakura, Y. Suppression of immune induction of collagen-induced arthritis in IL-17-deficient mice, Journal of Immunology, 171, 6173, 10.4049/jimmunol.171.11.6173 · DOI
  63. HS Goodridge, 2005, Immunomodulation via novel use of TLR4 by the filarial nematode phosphorylcholine-containing secreted product, ES-62, J Immunol, 174, 284, 10.4049/jimmunol.174.1.284 · DOI
  64. MA Pineda, 2015, From the worm to the pill, the parasitic worm product ES-62 raises new horizons in the treatment of rheumatoid arthritis, Lupus, 24, 400, 10.1177/0961203314560004 · DOI
  65. DH Ball, 2013, Mast Cell subsets and their functional modulation by the Acanthocheilonmea viteae product, ES-62, Journal of Parasitology Research, 2013, 13
  66. IB McInnes, 2003, A novel therapeutic approach targeting articular inflammation using the filarial nematode-derived phosphorylcholine-containing glycoprotein ES-62, J Immunol, 171, 2127, 10.4049/jimmunol.171.4.2127 · DOI
  67. MM Harnett, 2010, The therapeutic potential of the filarial nematode-derived immunodulator, ES-62 in inflammatory disease, Clinical and Experimental Immunology, 159, 256, 10.1111/j.1365-2249.2009.04064.x · DOI
  68. D Fu, 2012, Role of p21-activated kinase 1 in regulating the migration and invasion of fibroblast-like synoviocytes from rheumatoid arthritis patients., Rheumatology (Oxford), 51, 1170, 10.1093/rheumatology/kes031 · DOI
  69. MA Pineda, 2014, ES-62, a therapeutic anti-inflammatory agent evolved by the filarial nematode Acanthocheilonema viteae, Molecular and Biochemical Parasitology, 194, 1, 10.1016/j.molbiopara.2014.03.003 · DOI · Paper page
  70. WS Alexander, 1999, SOCS1 is a critical inhibitor of interferon gamma signaling and prevents the potentially fatal neonatal actions of this cytokine, Cell, 98, 597, 10.1016/S0092-8674(00)80047-1 · DOI · Paper page
  71. Y Liang, 2014, SOCS signaling in autoimmune diseases: molecular mechanisms and therapeutic implications, European Journal of Immunology, 44, 1265, 10.1002/eji.201344369 · DOI
  72. RJ Dolhain, 1996, Increased expression of interferon (IFN)-gamma together with IFN-gamma receptor in the rheumatoid synovial membrane compared with synovium of patients with osteoarthritis., Br J Rheumatol, 35, 24, 10.1093/rheumatology/35.1.24 · DOI
  73. R T Karonitsch KD, 2010, Byrne, B Niedereiter, E Cetin, A Wanivenhaus, C Scheinecker, J S Smolen, H P Kiener. IFN-gamma promotes fibroblast-like synoviocytes motility, Ann Rheum Dis, 69
  74. M Lao, 2016, Protein Inhibitor of Activated STAT3 Regulates Migration, Invasion, and Activation of Fibroblast-like Synoviocytes in Rheumatoid Arthritis, J Immunol, 196, 596, 10.4049/jimmunol.1403254 · DOI
  75. JH Duarte, 2016, Rheumatoid arthritis: PIAS3 inhibition blocks FLS activity., Nat Rev Rheumatol, 12, 70, 10.1038/nrrheum.2015.182 · DOI
  76. B Comertpay, 2020, Identification of key biomolecules in rheumatoid arthritis through the reconstruction of comprehensive disease-specific biological networks, Autoimmunity, 53, 156, 10.1080/08916934.2020.1722107 · DOI
  77. D Beckmann, 2021, Lasp1 regulates adherens junction dynamics and fibroblast transformation in destructive arthritis, Nature Communications, 12, 3624, 10.1038/s41467-021-23706-8 · DOI
  78. V Toulis, 2020, By the Tips of Your Cilia: Ciliogenesis in the Retina and the Ubiquitin-Proteasome System, Advances in Experimental Medicine and Biology, 1233, 303, 10.1007/978-3-030-38266-7_13 · DOI
  79. Y Nishimura, 2019, Primary Cilia as Signaling Hubs in Health and Disease., Adv Sci (Weinh), 6, 1801138, 10.1002/advs.201801138 · DOI
  80. EG Estell, 2017, Fibroblast-like synoviocyte mechanosensitivity to fluid shear is modulated by interleukin-1alpha, J Biomech, 60, 91, 10.1016/j.jbiomech.2017.06.011 · DOI
  81. J Crowe, 2020, The parasitic worm product ES-62 promotes health- and life-span in a high calorie diet-accelerated mouse model of ageing., PLoS Pathogens, 16, e1008391, 10.1371/journal.ppat.1008391 · DOI
  82. VG Maria Armaka, 2009, A standardized protocol for the isolation and culture of normal and arthritogenic murine synovial fibroblasts., Protocol Exchange, 102
  83. K Gelse, 2008, Role of hypoxia-inducible factor 1 alpha in the integrity of articular cartilage in murine knee joints., Arthritis Research & Therapy, 10, R111, 10.1186/ar2508 · DOI
  84. M Radu, 2013, An in vivo assay to test blood vessel permeability, J Vis Exp, e50062
  85. EH Wilson, 2003, Hyporesponsiveness of murine B lymphocytes exposed to the filarial nematode secreted product ES-62 in vivo, Immunol, 109, 238, 10.1046/j.1365-2567.2003.01661.x · DOI
  86. FE Lumb, 2017, Dendritic cells provide a therapeutic target for synthetic small molecule analogues of the parasitic worm product, ES-62., Scientific Reports, 7, 1704, 10.1038/s41598-017-01651-1 · DOI
  87. RJ Eason, 2016, The helminth product, ES-62 modulates dendritic cell responses by inducing the selective autophagolysosomal degradation of TLR-transducers, as exemplified by PKCdelta., Scientific Reports., 6, 37276, 10.1038/srep37276 · DOI
  88. F. Marzi MJaN, Flexible, efficient miRNA detection using the miScript PCR System, Qiagen
  89. Y Xi, 2012, RRBSMAP: a fast, accurate and user-friendly alignment tool for reduced representation bisulfite sequencing, Bioinformatics, 28, 430, 10.1093/bioinformatics/btr668 · DOI
  90. T Benoukraf, 2013, GBSA: a comprehensive software for analysing whole genome bisulfite sequencing data, Nucleic Acids Res, 41, e55, 10.1093/nar/gks1281 · DOI
  91. PA Stockwell, 2014, DMAP: differential methylation analysis package for RRBS and WGBS data, Bioinformatics, 30, 1814, 10.1093/bioinformatics/btu126 · DOI
  92. S Heinz, 2010, Simple combinations of lineage-determining transcription factors prime cis-regulatory elements required for macrophage and B cell identities, Mol Cell, 38, 576, 10.1016/j.molcel.2010.05.004 · DOI · Paper page

Cited by

Sorted by citations

Metadata

Authors
Corbet, M., Pineda, M. A., Yang, K., Tarafdar, A., McGrath, S., Nakagawa, R., Lumb, F. E., Suckling, C. J., Harnett, W., & Harnett, M. M.
Venue
PLOS Pathogens
Published
2021-11-08
Volume
17
Issue
11
Pages
e1010069
ISSN
1553-7374
Cited by
22
References
7
Language
en
Funders
  • Wellcome Trust (086852, Phd studentship)
  • Versus Arthritis (21133, 21221)

About these checks

Registry, retraction, Cites and statistics results are computed, not judged, with one exception: a printed reference that no index lists is read once by a model before it counts as a citation error. Claims are extracted by a model and kept only when their quote appears verbatim in the text; each cited source is then checked, with a model’s help, for whether it says what the claim relies on. Those verdicts can be wrong — read the claim’s quote and the cited source before relying on one.

Statistics and arithmetic are recomputed, not judged.

Confidence bands are shown only for fields calibrated on our annotated test set. None is calibrated yet, so no band is shown.

What counts as a claim ›How we measure confidence ›How we check this ›

Are you an author, or do you see a problem with this page? Request a review