

The DOI matches its Crossref record.
Comparison of the yield and purity of plasma exosomes extracted by ultracentrifugation, precipitation, and membrane-based approaches
Abstract
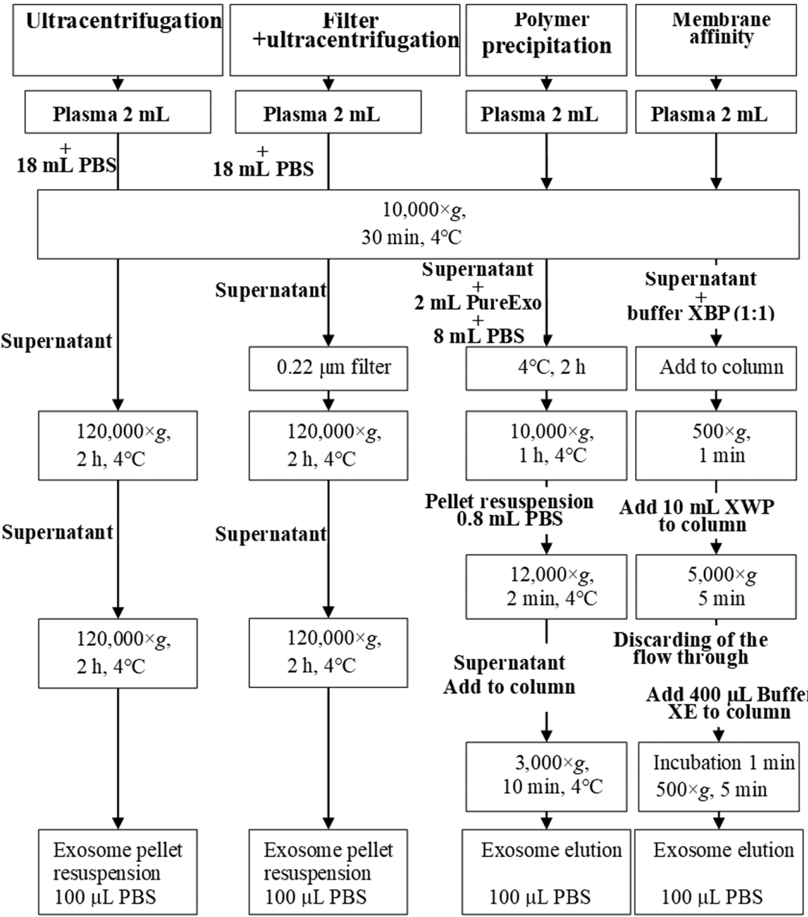
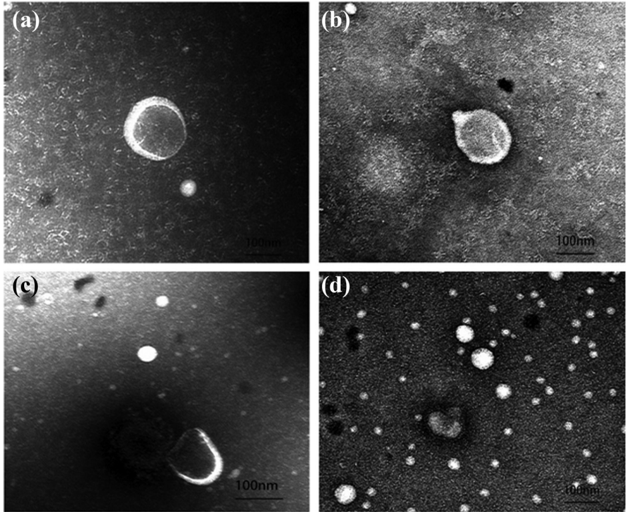
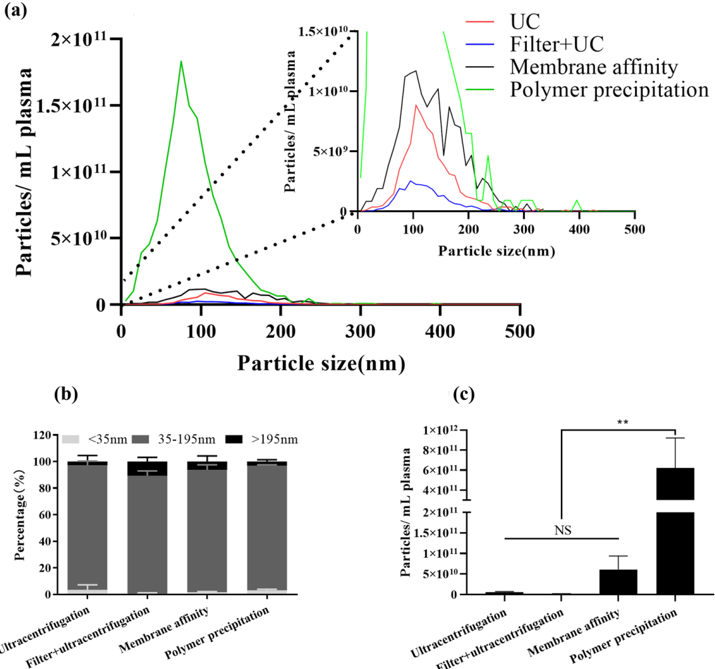
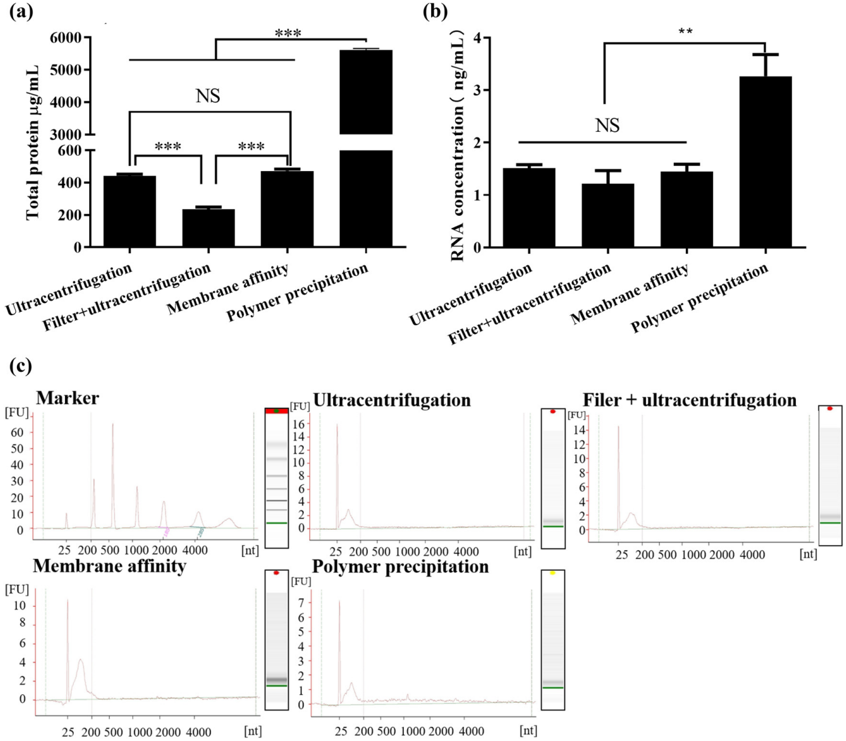
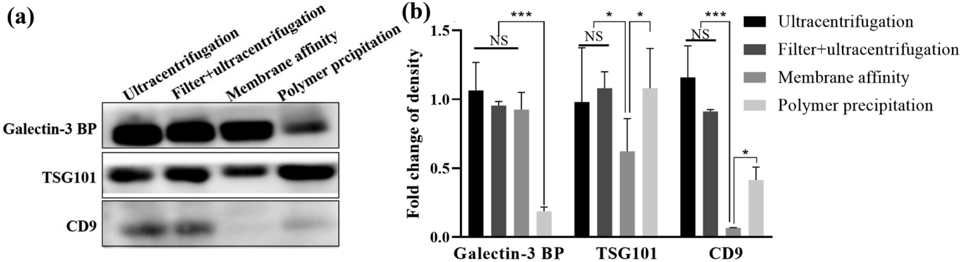
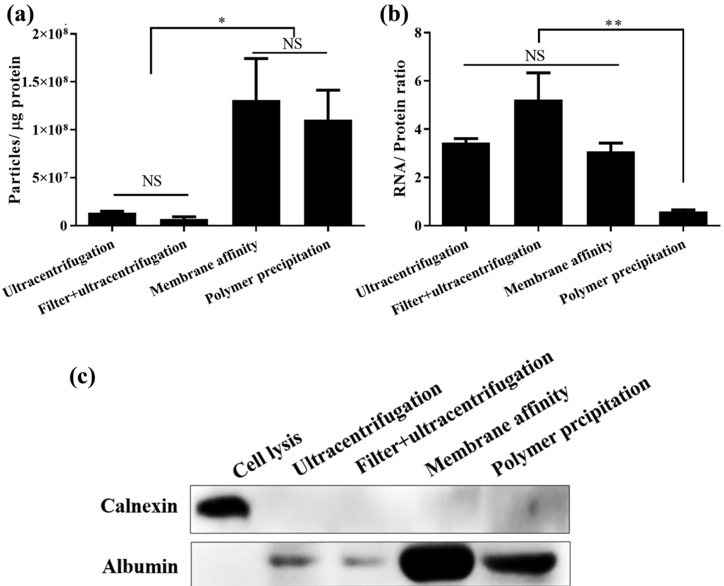
Exosomes were enriched from plasma by ultracentrifugation, precipitation, and membrane-based approaches for yield and purity. Using the four isolation approaches, particles with mode sizes within the expected range (50–200 nm) can be isolated. By protein estimation, polymer precipitation resulted in a maximum yield (5610.59 ± 51.189 µg/mL), followed by membrane affinity (471.57 ± 12.16 µg/mL), ultracentrifugation (440.22 ± 11.71 µg/mL) and filter + ultracentrifugation (235.47 ± 13.27 µg/mL). By total RNA estimation, the yield of polymer precipitation (3.26 ± 0.42 ng/mL) was higher than that of ultracentrifugation (1.52 ± 0.06 ng/mL), filter + ultracentrifugation (1.21 ± 0.25 ng/mL) and membrane affinity (1.44 ± 0.14 ng/mL). The purity of exosomal preparations was determined as the ratio of the particle number to protein and of protein to RNA. According to the ratio of the particle number to protein concentration, the “purity” of the polymer precipitation method was similar to that of the membrane affinity method and higher than that of ultracentrifugation and filter + ultracentrifugation. When the ratio of RNA to protein was used, the “purity” of the polymer precipitation method was lower than that of the membrane affinity method. Differential methods can be employed to enrich specific exosome subpopulations. The steps of the methods affect the particle number, protein content, and even exosomal purity. The best extraction and evaluation methods for exosomes need to be selected in the laboratory according to their experimental needs.
Overview
The claims and statistics of this paper haven’t been checked yet.
Run the check — free, no account needed. It reads the open-access text and checks the sources it cites.
Integrity signals
Registry
Cites
Statistics
Figures
Verification
Claims the paper makes
The claims and statistics of this paper haven’t been checked yet.
Run the check — free, no account needed. It reads the open-access text and checks the sources it cites.
Claims other papers make about this one
Each is checked against this paper’s own text: does it say what the citing paper says it does?
In the citing paper
“Natural exosomes typically have lower yields due to the complexity of their isolation. For example, traditional methods like ultracentrifugation can yield around 440.22 ± 11.71 µg/mL [46].”
From Emerging role of exosomes in cancer therapy: progress and challenges (2025) · cites this paper as [46]
Self-check
Percentages, sums and reported differences re-computed from the paper’s own numbers.
The self-check needs the paper’s full text.
Citations
Cites
No references could be resolved yet.
Research works printed but not linked: 18
- Hoshino A, Han SK, Bojmar L, Gyan KE, Lyden D. Extracellular vesicle and particle biomarkers define multiple human cancers. Cell. 2020;182(4):1–37. · DOI
- Contreras-Naranjo JC, Wu HJ, Ugaz VM. Microfluidics for exosome isolation and analysis: enabling liquid biopsy for personalized medicine. Lab Chip. 2017;17(21):3558–77. · DOI
- Stranska R, Gysbrechts L, Wouters J, Vermeersch P, Bloch K, Dierickx D, et al. Comparison of membrane affinity-based method with size-exclusion chromatography for isolation of exosome-like vesicles from human plasma. J Transl Med. 2018;16(1):1–10. · DOI
- Gonzalez-Cao M, Alegre E, Luis P-G, Jose G, Alvaro Z. Circulating melanoma exosomes as diagnostic and prognosis biomarkers. Clin Chim Acta. 2016;454:28–32. · DOI
- Nath Neerukonda S, Egan NA, Patria J, Assakhi I, Tavlarides-Hontz P, Modla S, et al. Comparison of exosomes purified via ultracentrifugation (UC) and total exosome isolation (TEI) reagent from the serum of Marek's disease virus (MDV)-vaccinated and tumor-bearing chickens. J Virol Methods. 2019;263:1–9. · DOI
- Al Zoubi W, Ko YG. Freestanding anticorrosion hybrid materials based on coordination interaction between metal-quinoline compounds and TiO2-MgO film. J Colloid Interface Sci. 2020;565:86–95. · DOI
- Al Zoubi W, Kamil MP, Fatimah S, Nashrah N, Ko YG. Recent advances in hybrid organic–inorganic materials with spatial architecture for state-of-the-art applications. Prog Mater Sci. 2020;112:1–10. · DOI
- Al Zoubi W, Kim MJ, Kim YG, Ko YG. Dual-functional crosslinked polymer-inorganic materials for robust electrochemical performance and antibacterial activity. Chem Eng J. 2020;392:1–10. · DOI
- Moon S, Shin DW, Kim S, Lee YS, Mankhong S, Yang SW, et al. Enrichment of exosome-like extracellular vesicles from plasma suitable for clinical vesicular miRNA biomarker research. J Clin Med. 2019;8(11):1–16. · DOI
- Lunavat TR, Cheng L, Kim DK, Bhadury J, Jang SC, Lässer C, et al. Small RNA deep sequencing discriminates subsets of extracellular vesicles released by melanoma cells – evidence of unique microRNA cargos. Rna Biol. 2015;S12:810–23. · DOI
- Pan S, Pei L, Zhang A, Zhang Y, Zhang C, Huang M, et al. Passion fruit-like exosome-PMA/Au-BSA@Ce6 nanovehicles for real-time fluorescence imaging and enhanced targeted photodynamic therapy with deep penetration and superior retention behavior in tumor. Biomaterials. 2020;230:119606. · DOI
- Patel GK, Khan MA, Zubair H, Srivastava SK, Khushman M, Singh S, et al. Comparative analysis of exosome isolation methods using culture supernatant for optimum yield, purity and downstream applications. Sci Rep. 2019;9(1):5335. · DOI
- Rea AW, Zufall MJ, Williams RW, Sheldon L, Howard-Reed C. The influence of human activity patterns on personal PM exposure: a comparative analysis of filter-based and continuous particle measurements. Air Repair. 2001;51(9):1271–9. · DOI
- Lobb RJ, Becker M, Wen SW, Wong CS, Wiegmans AP, Leimgruber A, et al. Optimized exosome isolation protocol for cell culture supernatant and human plasma. J Extracell Vesicles. 2015;4:27031. · DOI
- Webber J, Clayton A. How pure are your vesicles? J Extracell Vesicles. 2013;2(1):1–10. · DOI · Paper page
- Millioni R, Tolin S, Puricelli L, Sbrignadello S, Arrigoni G. High abundance proteins depletion vs low abundance proteins enrichment: comparison of methods to reduce the plasma proteome complexity. PLoS One. 2011;6(5):e19603. · DOI
- Kalra H, Adda CG, Liem M, Ang CS, Mechler A, Simpson RJ, et al. Comparative proteomics evaluation of plasma exosome isolation techniques and assessment of the stability of exosomes in normal human blood plasma. Proteomics. 2013;13(22):3354–64. · DOI
- Helwa I, Cai J, Drewry MD, Zimmerman A, Dinkins MB, Khaled ML, et al. A comparative study of serum exosome isolation using differential ultracentrifugation and three commercial reagents. PLoS One. 2017;12(1):e0170628. · DOI
Cited by
Sorted by citations
Emerging role of exosomes in cancer therapy: progress and challenges
Li, J., Wang, J., & Chen, Z. (2025) · Molecular Cancer · doi:10.1186/s12943-024-02215-4 · Cited by 297
Metadata
- Authors
- Li, W.-J., Chen, H., Tong, M.-L., Niu, J.-J., Zhu, X.-Z., & Lin, L.-R.
- Venue
- Open Chemistry
- Publisher
- Walter de Gruyter GmbH
- Published
- 2022-01-01
- Volume
- 20
- Issue
- 1
- Pages
- 182-191
- ISSN
- 2391-5420
- Cited by
- 60
- References
- 0
- Language
- en
About these checks
Registry, retraction, Cites and statistics results are computed, not judged, with one exception: a printed reference that no index lists is read once by a model before it counts as a citation error. Claims are extracted by a model and kept only when their quote appears verbatim in the text; each cited source is then checked, with a model’s help, for whether it says what the claim relies on. Those verdicts can be wrong — read the claim’s quote and the cited source before relying on one.
Statistics and arithmetic are recomputed, not judged.
Confidence bands are shown only for fields calibrated on our annotated test set. None is calibrated yet, so no band is shown.
What counts as a claim ›How we measure confidence ›How we check this ›
Are you an author, or do you see a problem with this page? Request a review
How to cite
Cite CoChat for the checks on this page, and the paper for its own findings.
- This page
- CoChat. (2026). Citation check: Comparison of the yield and purity of plasma exosomes extracted by ultracentrifugation, precipitation, and membrane-based approaches. https://app.cochat.ai/papers/10.1515/chem-2022-0139
- The paper
- Li, W.-J., Chen, H., Tong, M.-L., Niu, J.-J., Zhu, X.-Z., & Lin, L.-R. (2022). Comparison of the yield and purity of plasma exosomes extracted by ultracentrifugation, precipitation, and membrane-based approaches. Open Chemistry. https://doi.org/10.1515/chem-2022-0139
