

The DOI matches its Crossref record; 94 of the 94 references it cites were found in a registry or an index; none of the 93 sources its claims cite is checked for support yet.
Molecular crowding and RNA synergize to promote phase separation, microtubule interaction, and seeding of Tau condensates
Open accessAbstract
Biomolecular condensation of the neuronal microtubule‐associated protein Tau (MAPT) can be induced by coacervation with polyanions like RNA, or by molecular crowding. Tau condensates have been linked to both functional microtubule binding and pathological aggregation in neurodegenerative diseases. We find that molecular crowding and coacervation with RNA, two conditions likely coexisting in the cytosol, synergize to enable Tau condensation at physiological buffer conditions and to produce condensates with a strong affinity to charged surfaces. During condensate‐mediated microtubule polymerization, their synergy enhances bundling and spatial arrangement of microtubules. We further show that different Tau condensates efficiently induce pathological Tau aggregates in cells, including accumulations at the nuclear envelope that correlate with nucleocytoplasmic transport deficits. Fluorescent lifetime imaging reveals different molecular packing densities of Tau in cellular accumulations and a condensate‐like density for nuclear‐envelope Tau. These findings suggest that a complex interplay between interaction partners, post‐translational modifications, and molecular crowding regulates the formation and function of Tau condensates. Conditions leading to prolonged existence of Tau condensates may induce the formation of seeding‐competent Tau and lead to distinct cellular Tau accumulations. Condensation of the microtubule‐associated protein Tau is induced by the presence of polyanions like RNA or by molecular crowding. Here we show that these conditions have synergistic effects on Tau condensation and Tau‐dependent microtubule bundling in vitro, and on the seeding of Tau aggregates in cells. Conditions that induce liquid‐liquid phase separation have distinct effects on Tau condensation and subcellular localization, including formation of Tau‐positive inclusions along the nuclear envelope that correlate with nucleocytoplasmic transport deficits.
Overview
CoChat Summary
TL;DR
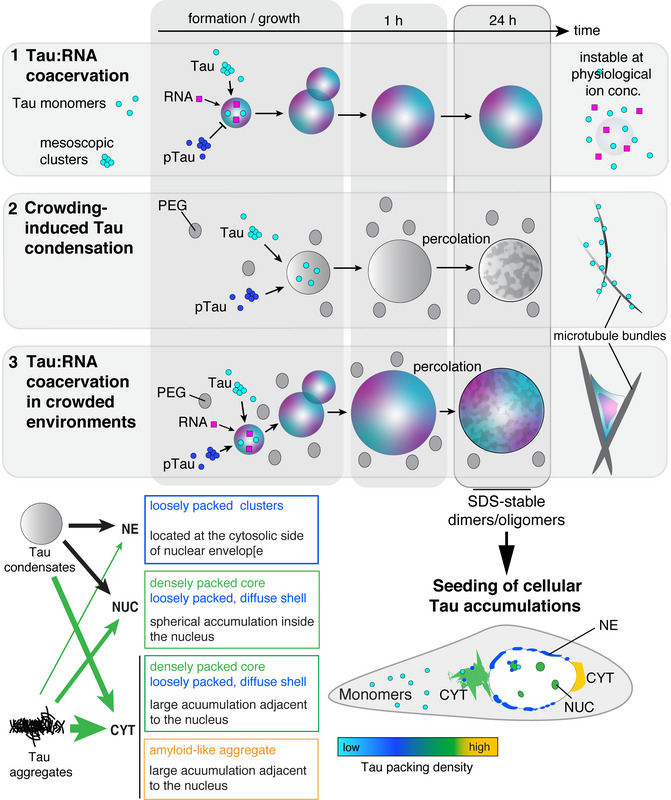
Molecular crowding and RNA synergize to enable Tau condensation at physiological ion conditions and produce condensates with strong affinity to charged surfaces. Aged Tau condensates, including non-percolating Tau:RNA coacervates, seed pathological Tau accumulations in cells, including nuclear-envelope Tau linked to nucleocytoplasmic transport deficits.
Key findings
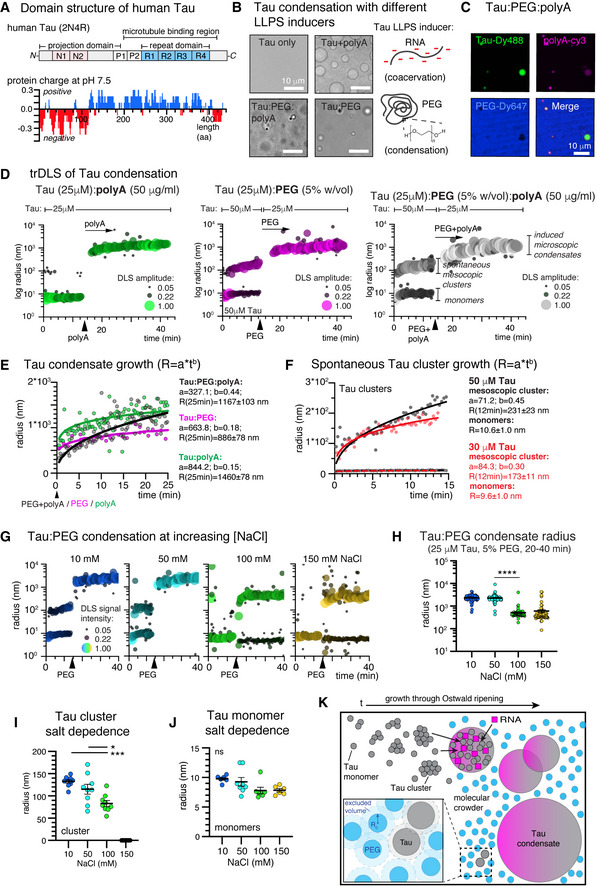
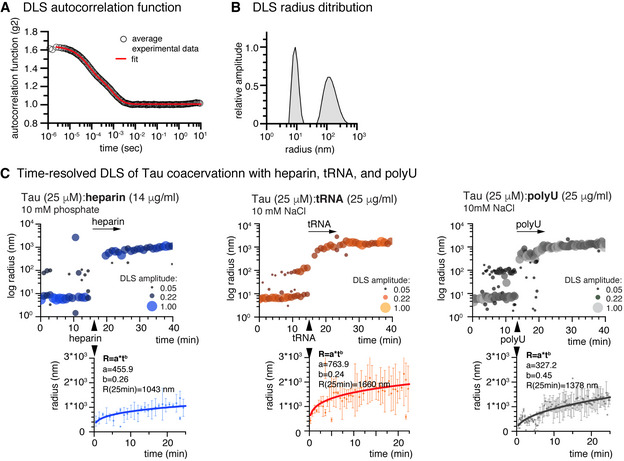
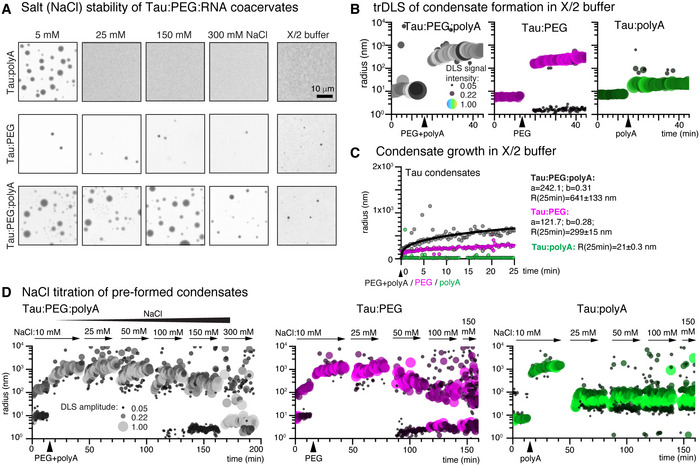
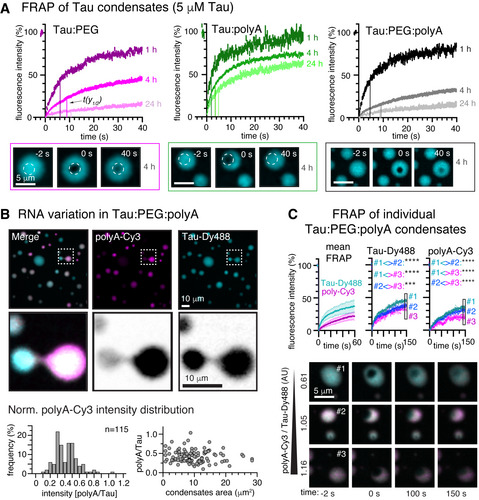
- Crowding plus RNA stabilized Tau condensates against salt: Tau:RNA coacervates disappeared at 25 mM NaCl, Tau:PEG condensates destabilized at 100 mM NaCl, but Tau:PEG:RNA condensates did not change between 5 and 150 mM NaCl and still formed at 300 mM NaCl. In axoplasm-like X/2 buffer, Tau:PEG formed condensates and Tau:PEG:RNA formed more robustly, while Tau:RNA coacervation was inhibited. Growth kinetics gave coarsening exponents b = 0.44 for Tau:PEG:RNA, b = 0.15 for Tau:RNA, and b = 0.18 for Tau:PEG.
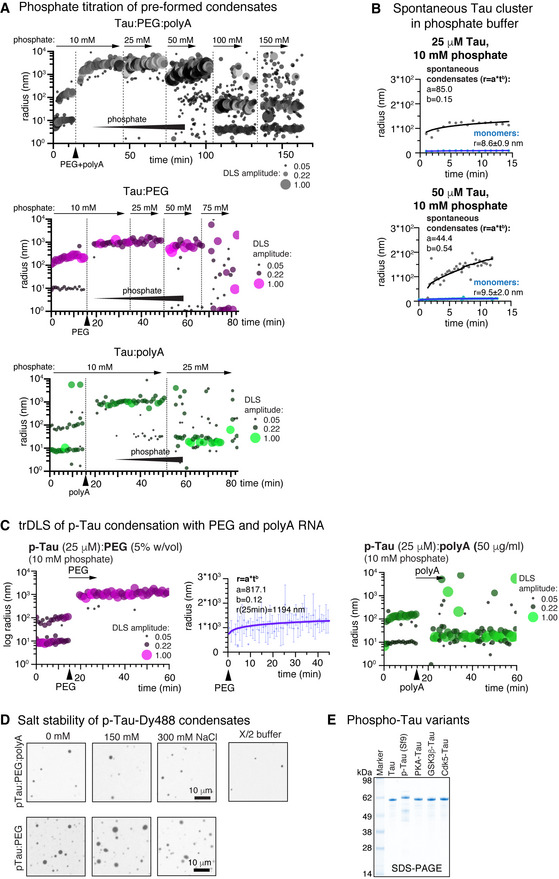
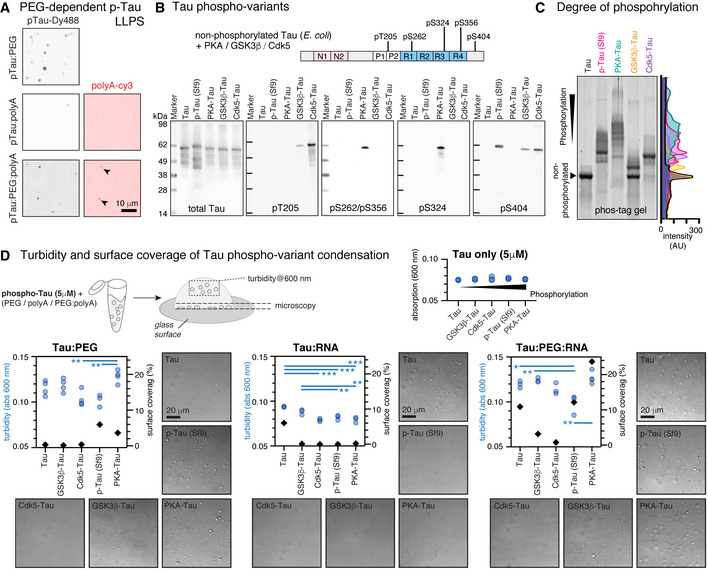
- Phosphorylated Tau failed to coacervate with RNA alone but condensed with PEG; in p-Tau:PEG:RNA systems RNA co-partitioned into condensates and condensates formed at elevated NaCl. PKA-phosphorylated Tau showed the highest in-solution LLPS and surface wetting in Tau:PEG:RNA, while pT205 and pS404 had little effect or inhibited condensation and pS262/pS356/pS324 appeared to favor LLPS.
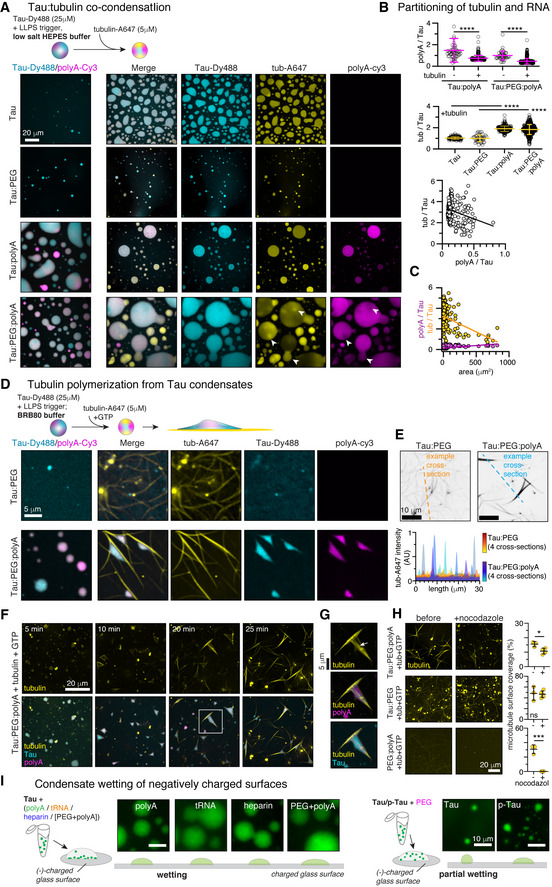
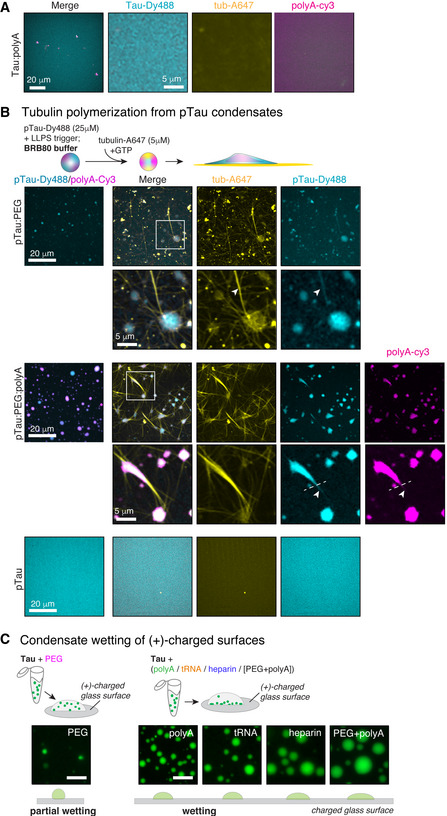
- Tubulin co-partitioned into Tau:PEG, Tau:RNA, and Tau:PEG:RNA condensates, with RNA and tubulin competing for co-condensation. Tau:PEG:RNA produced thick MT bundles arranged around persisting condensates, whereas Tau:PEG produced thin, partly curved bundles; nocodazole stability was higher for Tau:PEG than Tau:PEG:RNA MTs.
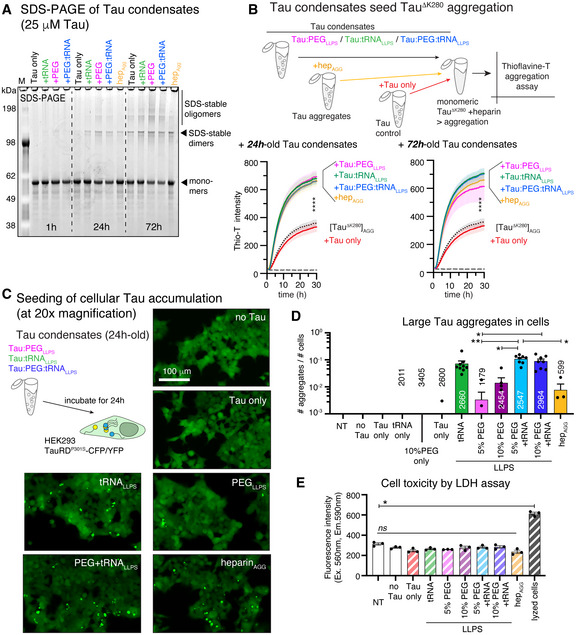
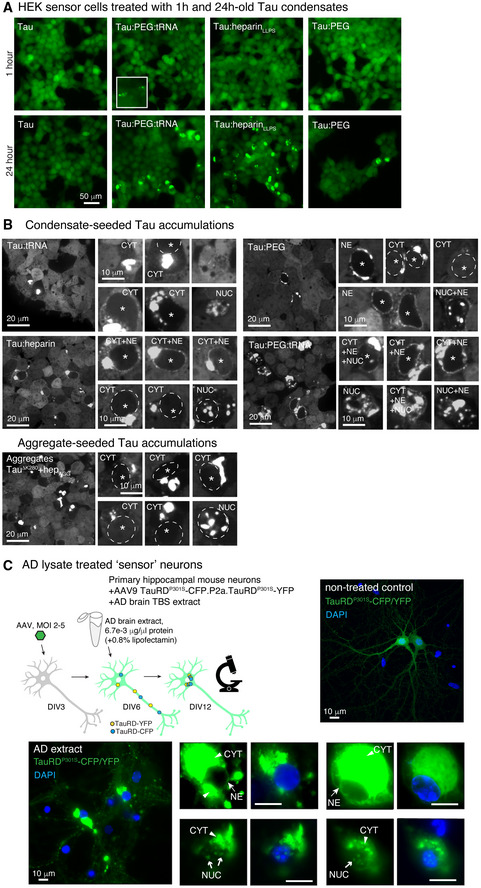
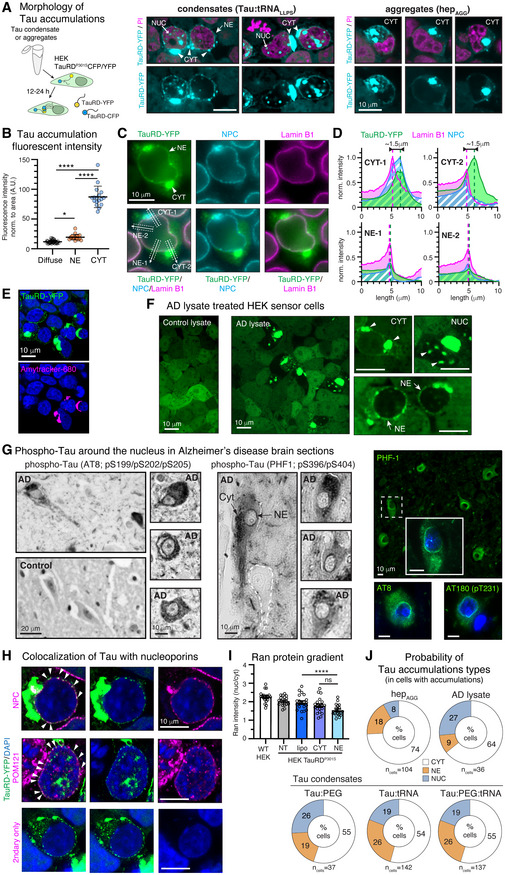
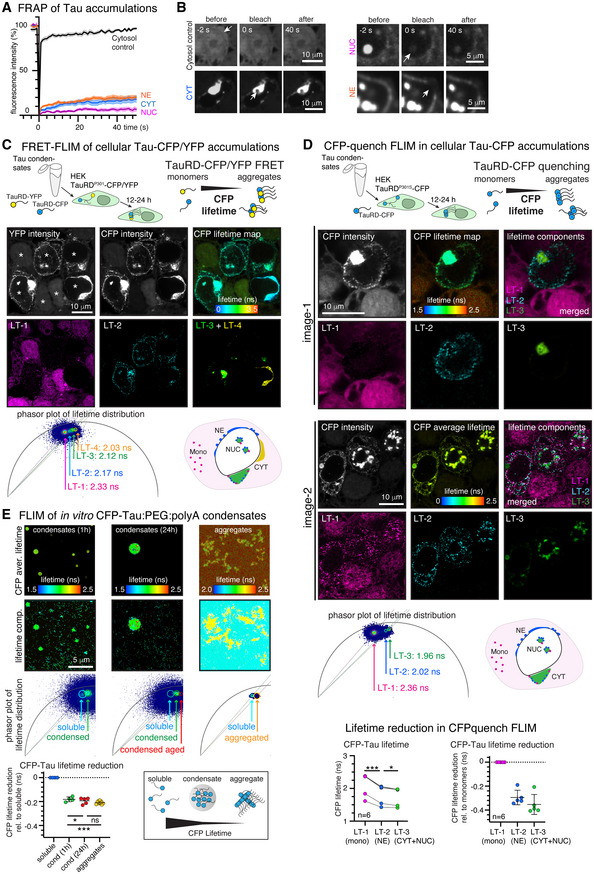
- 24 h-old Tau:PEG, Tau:RNA, and Tau:PEG:RNA condensates formed SDS-stable Tau dimers/oligomers and increased TauΔK280 aggregation in Thioflavin-T assays. Tau:RNA coacervates induced Tau aggregation in HEK sensor cells more efficiently than PEG-induced condensates and similar to Tau:PEG:RNA; RNA-containing condensates induced nuclear-envelope Tau with the highest frequency (26%), while heparin-induced aggregates mostly seeded cytoplasmic accumulations (74% CYT, 18% NE, 8% NUC). NE Tau had faster FRAP (t1/2 ≈ 2.5 s) than CYT Tau (t1/2 ≈ 7 s), and FLIM distinguished soluble Tau (LT-1 ~2.3 ns), NE Tau (LT-2 ~2.2 ns), CYT/NUC Tau (LT-3 ~2.1 ns), and a subset of CYT Tau (LT-4 ~2.0 ns).
Methods
- In vitro LLPS used recombinant human full-length Tau (2N4R, 5 µM), p-Tau from Sf9 cells, TauΔK280, and in vitro phosphorylated Tau variants; condensation was induced with polyA, tRNA, heparin, PEG8000, or combinations. Main techniques included time-resolved dynamic light scattering, light/confocal microscopy, turbidity, FRAP, FLIM, sedimentation assays, SDS–PAGE, semi-native PAGE, dot blots, and Thioflavin-T aggregation assays.
- Cellular and tissue work used HEK293 TauRDP301S-CFP/YFP sensor cells treated with 24 h-old Tau condensates or AD brain lysate, primary mouse hippocampal neurons expressing TauRDP301S-CFP/YFP, and human AD/control brain sections. Analyses included confocal imaging, FRAP, FLIM, immunofluorescence, and statistics by Student’s t-test or one-way ANOVA with Tukey/Holmes–Sidak correction.
Limitations
- The paper states that effects of individual or grouped Tau post-translational modifications need further investigation due to their complexity, and that preferential induction of certain Tau accumulation types by different seeds is not conclusive at this point. It also notes that NE Tau fusion was not observed, possibly due to time/spatial resolution limits or progressed percolation, and that in vitro versus cellular differences (crowding, ion composition, pH, other biomolecules; TauRD versus full-length Tau) may affect FLIM comparisons.
- Evident from the text: many mechanistic conclusions rely on in vitro reconstitution with purified proteins and on HEK sensor cells, with 5% PEG8000 used to induce LLPS at physiological Tau concentrations; the work does not directly demonstrate endogenous Tau condensates in neurons, and cellular seeding assays use lipofectamine and tagged TauRD constructs.
Model-written summary. Check it against the paper before relying on it.
Integrity signals
Registry
Cites
Statistics
Figures
Verification
Claims the paper makes
0 Valid · 0 Not valid · 54 Not checked · 252 Own results and interpretations
A result the paper reports from its own data — it cites no other source for it, so there is none to check. The quote shows it is in the paper.
In the paper
“We find that molecular crowding and coacervation with RNA, two conditions likely coexisting in the cytosol, synergize to enable Tau condensation at physiological buffer conditions and to produce condensates with a strong affinity to charged surfaces.”
§ Molecular crowding and RNA synergize to promote phase separation, microtubule interaction, and seeding of Tau condensates > Abstract
boostedstates an association- Asserted: passes — The authors put it forward as true.
- Checkable: passes — It can be checked against evidence.
- Load-bearing: passes — The paper’s conclusions depend on it.
- Based: passes — The paper gives a reason why it holds.
A result the paper reports from its own data — it cites no other source for it, so there is none to check. The quote shows it is in the paper.
In the paper
“We further show that different Tau condensates efficiently induce pathological Tau aggregates in cells, including accumulations at the nuclear envelope that correlate with nucleocytoplasmic transport deficits.”
§ Molecular crowding and RNA synergize to promote phase separation, microtubule interaction, and seeding of Tau condensates > Abstract
plainstates a cause- Asserted: passes — The authors put it forward as true.
- Checkable: passes — It can be checked against evidence.
- Load-bearing: passes — The paper’s conclusions depend on it.
- Based: passes — The paper gives a reason why it holds.
A result the paper reports from its own data — it cites no other source for it, so there is none to check. The quote shows it is in the paper.
In the paper
“Fluorescent lifetime imaging reveals different molecular packing densities of Tau in cellular accumulations and a condensate‐like density for nuclear‐envelope Tau.”
§ Molecular crowding and RNA synergize to promote phase separation, microtubule interaction, and seeding of Tau condensates > Abstract
plainstates an association- Asserted: passes — The authors put it forward as true.
- Checkable: passes — It can be checked against evidence.
- Load-bearing: passes — The paper’s conclusions depend on it.
- Based: passes — The paper gives a reason why it holds.
A result the paper reports from its own data — it cites no other source for it, so there is none to check. The quote shows it is in the paper.
In the paper
“We find that molecular crowding and coacervation with RNA, two conditions likely coexisting in the cytosol, synergize to enable Tau condensation at physiological buffer conditions and to produce condensates with a strong affinity to charged surfaces.”
- Also stated in: § RNA and crowding synergize during Tau condensation · plain
“In summary, we found that polyanions and crowding synergize during Tau condensation producing Tau condensates that exhibit growth kinetics indicative of Ostwald ripening (= growth through fusion of condensates) as previously reported for other biomolecular condensates (Van Lindt et al, 2021).”
§ Molecular crowding and RNA synergize to promote phase separation, microtubule interaction, and seeding of Tau condensates > Abstract
plainstates a cause- Asserted: passes — The authors put it forward as true.
- Checkable: passes — It can be checked against evidence.
- Load-bearing: passes — The paper’s conclusions depend on it.
- Based: passes — The paper gives a reason why it holds.
- Rests on an assumption not shown here.
- Also stated in: § RNA and crowding synergize during Tau condensation · plain
A result the paper reports from its own data — it cites no other source for it, so there is none to check. The quote shows it is in the paper.
In the paper
“During condensate‐mediated microtubule polymerization, their synergy enhances bundling and spatial arrangement of microtubules.”
§ Molecular crowding and RNA synergize to promote phase separation, microtubule interaction, and seeding of Tau condensates > Abstract
plainstates a cause- Asserted: passes — The authors put it forward as true.
- Checkable: passes — It can be checked against evidence.
- Load-bearing: passes — The paper’s conclusions depend on it.
- Based: passes — The paper gives a reason why it holds.
146 more claims
Create a free account to see all 306 claims and to verify the 68 references still open.
- It may state two separate claims as one. 117
- Probably not a substantial claim. 51
- The quote only partly states this claim. 2
Self-check
Percentages, sums and reported differences re-computed from the paper’s own numbers.
Each contradiction between two passages listed here was confirmed by an independent check.
Rated minor: it would not touch a result — a value no result rests on, a p-value that stays on the same side of the significance level, or a conflict that is clerical, resolved elsewhere in the paper, or outside its own findings.
In the paper
§ Molecular crowding and RNA synergize to promote phase separation, microtubule interaction, and seeding of Tau condensates > Results > Nuclear envelope Tau is loosely packed compared to cytosolic Tau aggregates
“High‐resolution CFP FLIM of HEK sensor cells expressing TauRDP301L‐CFP/YFP and treated with Tau condensates.”
§ Molecular crowding and RNA synergize to promote phase separation, microtubule interaction, and seeding of Tau condensates > Results > Nuclear envelope Tau is loosely packed compared to cytosolic Tau aggregates
“FRET‐FLIM imaging of HEK sensor cells expressing TauRDP301S‐CFP/YFP revealed reduced CFP lifetimes in all Tau accumulations compared to cytosolic soluble TauRD‐CFP (Fig 8C).”
Rated minor: it would not touch a result — a value no result rests on, a p-value that stays on the same side of the significance level, or a conflict that is clerical, resolved elsewhere in the paper, or outside its own findings.
In the paper
§ Molecular crowding and RNA synergize to promote phase separation, microtubule interaction, and seeding of Tau condensates > Results > Decoupling of Tau seeding potential and percolation in Tau coacervates
“tRNALLPS: P = 0.0403 compared to Tau only; Fig EV4G”
§ Molecular crowding and RNA synergize to promote phase separation, microtubule interaction, and seeding of Tau condensates > Results > Crowding, but not polyanions, induce gelation of Tau condensates
“P = 0.043 for tRNALLPS”
Rated minor: it would not touch a result — a value no result rests on, a p-value that stays on the same side of the significance level, or a conflict that is clerical, resolved elsewhere in the paper, or outside its own findings.
In the paper
§ Molecular crowding and RNA synergize to promote phase separation, microtubule interaction, and seeding of Tau condensates > Results > Nuclear envelope Tau is loosely packed compared to cytosolic Tau aggregates
“Similar results were obtained upon full bleach of 4 h‐old Tau:PEG:RNA condensates (Fig EV4A).”
§ Molecular crowding and RNA synergize to promote phase separation, microtubule interaction, and seeding of Tau condensates > Results > Crowding, but not polyanions, induce gelation of Tau condensates
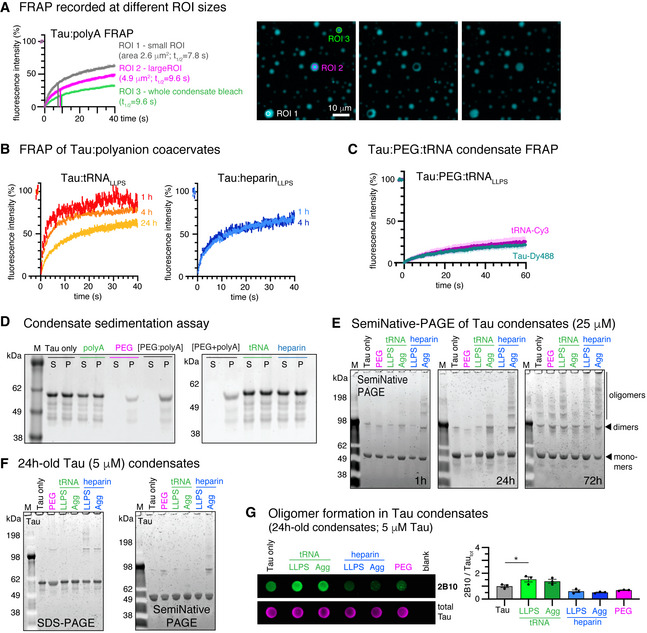
“FRAP of 4 h‐old Tau:polyA condensates comparing different FRAP ROI sizes at similar condensate size (ROI1 versus ROI2) and full condensate bleach (ROI3).”
Rated minor: it would not touch a result — a value no result rests on, a p-value that stays on the same side of the significance level, or a conflict that is clerical, resolved elsewhere in the paper, or outside its own findings.
In the paper
§ Molecular crowding and RNA synergize to promote phase separation, microtubule interaction, and seeding of Tau condensates > Results > Decoupling of Tau seeding potential and percolation in Tau coacervates
“1.2 µM Tau in culture medium including 1% lipofectamine for 2 h”
§ Molecular crowding and RNA synergize to promote phase separation, microtubule interaction, and seeding of Tau condensates > Materials and Methods > Cellular Tau seeding assay
“Tau condensates were mixed with 0.8% lipofectamine 2000 (Invitrogen)”
Rated minor: it would not touch a result — a value no result rests on, a p-value that stays on the same side of the significance level, or a conflict that is clerical, resolved elsewhere in the paper, or outside its own findings.
In the paper
§ Molecular crowding and RNA synergize to promote phase separation, microtubule interaction, and seeding of Tau condensates > Results > Decoupling of Tau seeding potential and percolation in Tau coacervates
“High concentrations of heparin (287 µg/ml; hepAGG) induce β‐structured Tau aggregates”
§ Molecular crowding and RNA synergize to promote phase separation, microtubule interaction, and seeding of Tau condensates > Materials and Methods > Tau LLPS and aggregation sample preparation
“0.287 µg/ml heparin (4:1, Tau:heparin) to 25 µM Tau”
1 more finding
Create a free account to see every finding of this check.
Citations
Cites
Neuropathological stageing of Alzheimer-related changes.
Braak, H., & Braak, E. (1991) · Acta Neuropathologica · doi:10.1007/bf00308809 · Cited by 16,123
The kinetics of precipitation from supersaturated solid solutions
Lifshitz, I. M., & Slyozov, V. V. (1961) · Journal of Physics and Chemistry of Solids · doi:10.1016/0022-3697(61)90054-3 · Cited by 8,558
Liquid phase condensation in cell physiology and disease
Shin, Y., & Brangwynne, C. P. (2017) · Science · doi:10.1126/science.aaf4382 · Cited by 4,212
A Liquid-to-Solid Phase Transition of the ALS Protein FUS Accelerated by Disease Mutation
Patel, A., Lee, H. O., Jawerth, L., Maharana, S., Jahnel, M., Hein, M. Y., Stoynov, S., Mahamid, J., Saha, S., Franzmann, T. M., et al. (2015) · Cell · doi:10.1016/j.cell.2015.07.047 · Cited by 3,282
Liquid-Liquid Phase Separation in Biology
Hyman, A. A., Weber, C. A., & Jülicher, F. (2014) · Annual Review of Cell and Developmental Biology · doi:10.1146/annurev-cellbio-100913-013325 · Cited by 3,155
Molliex, A., Temirov, J., Lee, J., Coughlin, M., Kanagaraj, A. P., Kim, H. J., Mittag, T., & Taylor, J. P. (2015) · Cell · doi:10.1016/j.cell.2015.09.015 · Cited by 2,893
Provencher, S. W. (1982) · Computer Physics Communications · doi:10.1016/0010-4655(82)90174-6 · Cited by 2,763
Molecular Size Distribution in Three Dimensional Polymers. I. Gelation 1
Flory, P. J. (1941) · Journal of the American Chemical Society · doi:10.1021/ja01856a061 · Cited by 1,873
Late stages of spinodal decomposition in binary mixtures
Siggia, E. D. (1979) · Physical Review A · doi:10.1103/physreva.20.595 · Cited by 1,296
Protein misfolding, aggregation, and conformational strains in neurodegenerative diseases
Soto, C., & Pritzkow, S. (2018) · Nature Neuroscience · doi:10.1038/s41593-018-0235-9 · Cited by 1,180
Cited by
Molecular Crowding: The History and Development of a Scientific Paradigm
Alfano, C., Fichou, Y., Huber, K. P., Weiß, M., Spruijt, E., Ebbinghaus, S., Luca, G. D., Morando, M. A., Vetri, V., Temussi, P. A., et al. (2024) · Chemical Reviews · doi:10.1021/acs.chemrev.3c00615 · Cited by 237
Neurodegenerative Disease Tauopathies
Creekmore, B. C., Watanabe, R., & Lee, E. B. (2023) · Annual Review of Pathology Mechanisms of Disease · doi:10.1146/annurev-pathmechdis-051222-120750 · Cited by 157
Phosphorylation regulates tau’s phase separation behavior and interactions with chromatin
Abasi, L. S., Elathram, N., Movva, M., Deep, A., Corbett, K. D., & Debelouchina, G. T. (2024) · Communications Biology · doi:10.1038/s42003-024-05920-4 · Cited by 58
Ainani, H., Bouchmaa, N., Ben Mrid, R., & El Fatimy, R. (2023) · Neurobiology of Disease · doi:10.1016/j.nbd.2023.106011 · Cited by 54
Copper drives prion protein phase separation and modulates aggregation
do Amaral, M. J., Passos, A. R., Passos, A. R., da Silva, T. S. L., Carvalho, R. S., Almeida, M. S., Pinheiro, A. S., Wegmann, S., & Cordeiro, Y. (2023) · Science Advances · doi:10.1126/sciadv.adi7347 · Cited by 53
Self-citationDisrupting pathologic phase transitions in neurodegeneration
Hurtle, B. T., Xie, L., & Donnelly, C. J. (2023) · Journal of Clinical Investigation · doi:10.1172/jci168549 · Cited by 40
Cytosolic condensates rich in polyserine define subcellular sites of tau aggregation
Lester, E., Alstyne, M. V., McCann, K. L., Reddy, S., Cheng, L. Y., Kuo, J., Pratt, J., & Parker, R. (2023) · Proceedings of the National Academy of Sciences · doi:10.1073/pnas.2217759120 · Cited by 39
Biomolecular condensation involving the cytoskeleton
Mohapatra, S., & Wegmann, S. (2023) · Brain Research Bulletin · doi:10.1016/j.brainresbull.2023.01.009 · Cited by 38
Self-citationHydrogen-Bonded Network of Water in Phase-Separated Biomolecular Condensates
Joshi, A., Avni, A., Walimbe, A., Rai, S. K., Sarkar, S., & Mukhopadhyay, S. (2024) · The Journal of Physical Chemistry Letters · doi:10.1021/acs.jpclett.4c01153 · Cited by 36
RNA G-quadruplexes and calcium ions synergistically induce Tau phase transition in vitro
Yabuki, Y., Matsuo, K., Komiya, G., Kudo, K., Hori, K., Ikenoshita, S., Kawata, Y., Mizobata, T., & Shioda, N. (2024) · Journal of Biological Chemistry · doi:10.1016/j.jbc.2024.107971 · Cited by 35
The mechanobiology of biomolecular condensates
Sanfeliu-Cerdán, N., & Krieg, M. (2025) · Biophysics Reviews · doi:10.1063/5.0236610 · Cited by 32
Initiation and modulation of Tau protein phase separation by the drug suramin
Prince, P. R., Hochmair, J., Brognaro, H., Gevorgyan, S., Franck, M., Schubert, R., Lorenzen, K., Yazici, S., Mandelkow�, E., Wegmann, S., et al. (2023) · Scientific Reports · doi:10.1038/s41598-023-29846-9 · Cited by 32
Self-citationLiquid − liquid phase separation of tau: Driving forces, regulation, and biological implications
Li, P., Chen, J., Wang, X., Su, Z., Gao, M., & Huang, Y. (2023) · Neurobiology of Disease · doi:10.1016/j.nbd.2023.106167 · Cited by 30
Stress‐dependent macromolecular crowding in the mitochondrial matrix
Bulthuis, E. P., Dieteren, C. E. J., Bergmans, J., Berkhout, J. H., Wagenaars, J. A. L., van de Westerlo, E. M. A., Podhumljak, E., Hink, M. A., Hesp, L. F. B., Rosa, H. S., et al. (2023) · The EMBO Journal · doi:10.15252/embj.2021108533 · Cited by 30
The influence of APOEε4 on the pTau interactome in sporadic Alzheimer’s disease
Thierry, M., Ponce, J., Martá-Ariza, M., Askenazi, M., Faustin, A., Leitner, D., Pires, G., Kanshin, E., Drummond, E., Ueberheide, B. M., et al. (2024) · Acta Neuropathologica · doi:10.1007/s00401-024-02744-8 · Cited by 30
Kar, S., Deis, R., Ahmad, A., Bogoch, Y., Dominitz, A., Shvaizer, G., Sasson, E., Mytlis, A., Ben‐Zvi, A., & Elkouby, Y. M. (2025) · Current Biology · doi:10.1016/j.cub.2024.11.056 · Cited by 29
Tau liquid–liquid phase separation: At the crossroads of tau physiology and tauopathy
Islam, M., Shen, F., Regmi, D., Petersen, K., Karim, M. R. U., & Du, D. (2024) · Journal of Cellular Physiology · doi:10.1002/jcp.30853 · Cited by 28
Joron, K., Viegas, J. O., Haas-Neill, L. I., Bier, S., Drori, P., Dvir, S., Lim, P. S. L., Rauscher, S., Meshorer, E., & Lerner, E. (2023) · Nature Communications · doi:10.1038/s41467-023-40647-6 · Cited by 28
Hochmair, J., van den Oetelaar, M. C. M., Ravatt, L. M., Diez, L., Lemmens, L. J. M., Ponce-Lina, R., Sankar, R., Franck, M., Nolte, G., Semenova, E., et al. (2025) · Communications Biology · doi:10.1038/s42003-025-08548-0 · Cited by 26
Self-citationPhosphorylation-Induced Self-Coacervation versus RNA-Assisted Complex Coacervation of Tau Proteins
Allahyartorkaman, M., Chan, T.-H., Chen, E. H.-L., Ng, S.-T., Chen, Y., Wen, J., Ho, M., Yen, H., Kuan, Y., Kuo, M., et al. (2025) · Journal of the American Chemical Society · doi:10.1021/jacs.4c14728 · Cited by 25
Mekonnen, G., Djaja, N. A., Yuan, X., & Myong, S. (2023) · Current Opinion in Chemical Biology · doi:10.1016/j.cbpa.2023.102371 · Cited by 25
Rai, S. K., Khanna, R., Sarbahi, A., Joshi, A., & Mukhopadhyay, S. (2025) · Science Advances · doi:10.1126/sciadv.ads1241 · Cited by 24
A coarse‐grained model for disordered proteins under crowded conditions
Rauh, A. S., Tesei, G., & Lindorff‐Larsen, K. (2025) · Protein Science · doi:10.1002/pro.70232 · Cited by 24
Chen, J., Ma, W., Yu, J., Wang, X., Qian, H., Li, P., Ye, H., Han, Y., Su, Z., Gao, M., et al. (2023) · Journal of Agricultural and Food Chemistry · doi:10.1021/acs.jafc.2c07799 · Cited by 23
Decoupling phase separation and fibrillization preserves activity of biomolecular condensates
Mahendran, T. S., Singh, A. A., Srinivasan, S., Jennings, C. M., Neureuter, C., Gindra, B. H., Parekh, S. H., & Banerjee, P. R. (2026) · Nature Communications · doi:10.1038/s41467-026-69244-z · Cited by 22
Boyko, S., & Surewicz, W. K. (2023) · Journal of Biological Chemistry · doi:10.1016/j.jbc.2023.104722 · Cited by 21
Phosphorylation but Not Oligomerization Drives the Accumulation of Tau with Nucleoporin Nup98
Diez, L., Kapinos, L. E., Hochmair, J., Hübschmann, S., Dominguez‐Baquero, A., Vogt, A., Rankovic, M., Zweckstetter, M., Lim, R. Y. H., & Wegmann, S. (2022) · International Journal of Molecular Sciences · doi:10.3390/ijms23073495 · Cited by 20
Self-citationThe endoplasmic reticulum puts a new spin on synaptic tagging
Konietzny, A., Wegmann, S., & Mikhaylova, M. (2022) · Trends in Neurosciences · doi:10.1016/j.tins.2022.10.012 · Cited by 19
Self-citationTau, RNA, and RNA-Binding Proteins: Complex Interactions in Health and Neurodegenerative Diseases
Lester, E., & Parker, R. (2023) · The Neuroscientist · doi:10.1177/10738584231154551 · Cited by 19
Chaperone-Mediated Regulation of Tau Phase Separation, Fibrillation, and Toxicity
Mörman, C., Leppert, A., Pizzirusso, G., Zheng, Z., Sun, X., Kumar, R., Biverstål, H., Landreh, M., Johansson, J., Arroyo‐García, L. E., et al. (2025) · Journal of the American Chemical Society · doi:10.1021/jacs.5c01369 · Cited by 17
Liegro, C. M. D., Schiera, G., Schirò, G., & Liegro, I. D. (2022) · International Journal of Molecular Sciences · doi:10.3390/ijms232314622 · Cited by 17
Liquid-liquid phase separation of tau and α-synuclein: A new pathway of overlapping neuropathologies
Rodríguez, L. C., Foressi, N. N., & Celej, M. S. (2024) · Biochemical and Biophysical Research Communications · doi:10.1016/j.bbrc.2024.151053 · Cited by 17
Poly(ADP-ribose) in Condensates: The PARtnership of Phase Separation and Site-Specific Interactions
Alemasova, E. E., & Lavrik, O. I. (2022) · International Journal of Molecular Sciences · doi:10.3390/ijms232214075 · Cited by 16
Znaidi, R., Massiani-Beaudoin, O., Mailly, P., Monnet, H., Bonnifet, T., The Brainbank Neuro-CEB Neuropathology Network, Joshi, R. L., & Fuchs, J. (2025) · Brain Research · doi:10.1016/j.brainres.2025.149579 · Cited by 14
Unravelling the mechanotransduction pathways in Alzheimer’s disease
Donnaloja, F., Limonta, E., Mancosu, C., Morandi, F., Boeri, L., Albani, D., & Raimondi, M. T. (2023) · Journal of Biological Engineering · doi:10.1186/s13036-023-00336-w · Cited by 13
Live-cell visualization of tau aggregation in human neurons
Hurtle, B. T., Donnelly, C. J., Zhang, X., & Thathiah, A. (2024) · Communications Biology · doi:10.1038/s42003-024-06840-z · Cited by 12
Molecular mechanisms of condensate modulation from energy-dominance analysis
Qian, D., Ausserwöger, H., Arter, W. E., Scrutton, R. M., Welsh, T. J., Kartanas, T., Ermann, N., Qamar, S., Fischer, C. M., Šneideris, T., et al. (2025) · Physical Review Applied · doi:10.1103/physrevapplied.23.064017 · Cited by 12
Macromolecular crowding and protein aggregation: Friend, foe or contextual force?
Gimón, I. V., Sandefur, C. I., & Schnell, S. D. (2025) · Progress in Biophysics and Molecular Biology · doi:10.1016/j.pbiomolbio.2025.12.001 · Cited by 11
Tubulin transforms Tau and α-synuclein condensates from pathological to physiological
Lucas, L., Tsoi, P. S., Quan, M. D., Choi, K., Ferreon, J. C., & Ferreon, A. C. M. (2026) · Nature Communications · doi:10.1038/s41467-026-69618-3 · Cited by 11
Fan, X., Truong, J. B., Okada, K., Lin, H., Ori-McKenney, K. M., & McKenney, R. J. (2026) · Communications Biology · doi:10.1038/s42003-026-10797-6 · Cited by 10
Carey, O., Fehilly, J., O’Leary, E. T., O’Shea, S., Juda, K., Fitzel, R., Selvaraj, P., Burk, K., Lindsay, A. J., Young, P. W., et al. (2025) · Journal of Molecular Biology · doi:10.1016/j.jmb.2025.169314 · Cited by 10
A Novel Tandem-Tag Purification Strategy for Challenging Disordered Proteins
Mészáros, A., Muwonge, K., Janvier, S., Ahmed, J., & Tompa, P. (2022) · Biomolecules · doi:10.3390/biom12111566 · Cited by 10
Moller, A. L., Middleton, I. A., Maynard, G. E., Cox, L. R., Wang, A., Li, H. L., & Thordarson, P. (2024) · Biomacromolecules · doi:10.1021/acs.biomac.4c01282 · Cited by 9
Virus-like particles of retroviral origin in protein aggregation and neurodegenerative diseases
Carra, S., Fábián, B., Taghavi, H. V., Milanetti, E., Giliberti, V., Ruocco, G., Shepherd, J. D., Vendruscolo, M., & Fuxreiter, M. (2025) · Molecular Aspects of Medicine · doi:10.1016/j.mam.2025.101369 · Cited by 8
Tian, S., Liu, Y., Hong, H., & Li, S. (2025) · Molecular Neurobiology · doi:10.1007/s12035-025-05280-y · Cited by 8
Hashemi, M., Asheghabadi, P. S., Moassesfar, M., Mashhadikhan, S., Nasirzade, S., Farahani, A. V., Mehdizadeh, S., Minaei, S., Rahmani, M., Jamshidian, F., et al. (2026) · Molecular Neurobiology · doi:10.1007/s12035-025-05510-3 · Cited by 8
EB1 Increases the Dynamics of Tau Droplets and Inhibits Tau Aggregation: Implications in Tauopathies
Venkatramani, A., Ashtam, A., & Panda, D. (2024) · ACS Chemical Neuroscience · doi:10.1021/acschemneuro.3c00815 · Cited by 8
Sun, S., Chen, S., He, J., Yang, B., Zhang, Y., Li, N., Wang, H., Tam, K. Y., & Ying, Z. (2025) · Biomedicine & Pharmacotherapy · doi:10.1016/j.biopha.2025.118290 · Cited by 7
Rational Modulation of Liquid–Liquid Phase Separation Offers Novel Ways to Combat Tauopathies
Zhang, X., Wang, L., Lin, N., Gao, M. Y., & Huang, Y. (2025) · International Journal of Molecular Sciences · doi:10.3390/ijms26146709 · Cited by 7
Rawlinson, S. M., Chakraborty, S., Sethi, A., David, C. T., Harrison, A. R., Bird, L. E., Rozario, A. M., Uthishtran, S., Ardipradja, K., Zhao, T., et al. (2025) · Nature Communications · doi:10.1038/s41467-025-65223-y · Cited by 7
Cevallos, J., Eubanks, E., Jung, S., Huang, Y., Guadagno, E., Jaber, N., Xia, Y., Wang, J., Wang, H., Suvvari, N. R., et al. (2026) · EMBO Reports · doi:10.1038/s44319-026-00856-8 · Cited by 7
Cordeiro, Y., Freire, M. H. O., Wiecikowski, A. F., & do Amaral, M. J. (2023) · Biophysical Reviews · doi:10.1007/s12551-023-01067-4 · Cited by 7
The purification of biomolecular condensates: Bottlenecks and strategies
Tartier, S., Basbous, J., Boulon, S., Verheggen, C., & Bertrand, É. (2025) · The Journal of Cell Biology · doi:10.1083/jcb.202504081 · Cited by 6
MicroRNA-29a-5p contributes to neuroinflammation through TLR7
McGurran, H., Graceffo, E., Kumbol, V. W.-A., Jendrach, M., Hinkelmann, L., Brehm, M., Ravatt, L. M., Krüger, C., Wallach, T., Haake, A., et al. (2026) · Journal of Neuroinflammation · doi:10.1186/s12974-025-03680-4 · Cited by 6
Self-citationCharacterisation of biocondensate microfluidic flow using array-detector FCS
Dilissen, S., Silva, P. L., Smolentseva, A., Kache, T., Thoelen, R., & Hendrix, J. (2024) · Biochimica et Biophysica Acta (BBA) - General Subjects · doi:10.1016/j.bbagen.2024.130673 · Cited by 6
The role of RNA in the nanoscale organization of α-synuclein phase separation
Zappone, S., Perego, E., Rupert, J., Zacco, E., Slenders, E., Tartaglia, G. G., & Vicidomini, G. (2025) · NAR Molecular Medicine · doi:10.1093/narmme/ugaf012 · Cited by 6
Ji, J., Xu, K., Wang, W., & Chen, C. (2025) · The Journal of Physical Chemistry Letters · doi:10.1021/acs.jpclett.5c00262 · Cited by 5
Chemical control of phase separation in DNA solutions
Hauf, S., & Yokobayashi, Y. (2023) · Chemical Communications · doi:10.1039/d2cc06901f · Cited by 5
Tau Oligomers Resist Phase Separation
Lucas, L., Tsoi, P. S., Ferreon, J. C., & Ferreon, A. C. M. (2025) · Biomolecules · doi:10.3390/biom15030336 · Cited by 4
Heterotypic phase separation in aggregation: Driver or deterrent?
Jacob, T., & Hoyer, W. (2026) · Biophysical Chemistry · doi:10.1016/j.bpc.2026.107577 · Cited by 3
Liquid-liquid phase separation of amyloid-like proteins in neurodegenerative diseases
Luo, Y.-Y., & Li, Y. (2025) · Chinese Science Bulletin (Chinese Version) · doi:10.1360/tb-2024-1158 · Cited by 3
Park, C., Jung, J., Hong, Y., Yoo, H., Yang, K., Shin, J., Kim, M., Lim, C. S., Jeong, A., Hong, S., et al. (2026) · Nature Communications · doi:10.1038/s41467-025-67888-x · Cited by 3
Crowding effect on the alignment of rod molecules confined in a spherical cavity
Shew, C., & Yoshikawa, K. (2023) · Chemical Physics Letters · doi:10.1016/j.cplett.2023.140437 · Cited by 3
Structuring Role of Tau-Tubulin Co-Condensates in Early Microtubule OrganizationPreprint
Lee-Eom, C., Jung, J., Park, C., & Shon, M. J. (2024) · bioRxiv (Cold Spring Harbor Laboratory) · doi:10.1101/2024.11.04.621946 · Cited by 3
Viola, G., Sperotto, A., Palmioli, A., Tira, R., Munari, F., Assfalg, M., Airoldi, C., & D’Onofrio, M. (2026) · Journal of Agricultural and Food Chemistry · doi:10.1021/acs.jafc.5c17659 · Cited by 2
Tau modulates nuclear integrity, chromatin, and cholesterol synthesis genes via the nuclear envelopePreprint
Diez, L., Ponce-Lina, R., Kilic, C., Sankar, R., Balduin, F., Wang, C., Grundschöttel, P., Sakurai, K., Askin, B., Bordier, C., et al. (2025) · bioRxiv (Cold Spring Harbor Laboratory) · doi:10.64898/2025.12.05.692577 · Cited by 2
Self-citationThiou, S., Martin, L., Manousaki, E., Nguyen, M., Mortelecque, J., Heidsieck, L., Cantrelle, F.-X., Blum, D., Buée-Scherrer, V., Buée, L., et al. (2026) · ACS Chemical Neuroscience · doi:10.1021/acschemneuro.6c00110 · Cited by 1
Targeting phase separated protein states for drug discovery
Nag, N., Shukla, H., Uversky, V. N., & Tripathi, T. (2024) · Elsevier eBooks · doi:10.1016/b978-0-443-21809-5.00007-7 · Cited by 1
Arora, S., & Wittung-Stafshede, P. E. (2026) · ChemistryEurope · doi:10.1002/ceur.70304 · Cited by 1
Yan, Q., Liu, Y., Wang, T., Liu, Z., & Zhang, Z. (2026) · Journal of Chemical Information and Modeling · doi:10.1021/acs.jcim.6c00488 · Cited by 1
How crowding shapes protein aggregation
Nikam, T., Patel, S. P., Saraf, S. A., & Awasthi, S. (2026) · Current Opinion in Structural Biology · doi:10.1016/j.sbi.2026.103332 · Cited by 1
Wiersma, V. I., Rigort, R., & Polymenidou, M. (2022) · The EMBO Journal · doi:10.15252/embj.2022111425 · Cited by 1
Decker, C. J., McCann, K. L., Lester, E., Pratt, J., Alstyne, M. V., Wang, Y., & Parker, R. (2026) · bioRxiv (Cold Spring Harbor Laboratory) · doi:10.64898/2026.02.17.706203 · Cited by 1
Shapes of condensate droplets containing filamentsPreprint
Wolf, F., Bareesel, S., Eickholt, B. J., Knorr, R. L., Röblitz, S., Grellscheid, S. N., Kusumaatmaja, H., & Böddeker, T. J. (2026) · bioRxiv (Cold Spring Harbor Laboratory) · doi:10.64898/2026.03.31.715246 · Cited by 1
Surface-induced tau condensation generates a selective microenvironment around microtubules
Lanska, E., Nagarajan, A., Humhalova, T., Siahaan, V., Krattenmacher, J., Zdimalova, M. D., Belaid, A., Khanfir, S., Libusova, L., Janke, C., et al. (2026) · doi:10.64898/2026.08.20.745963
Sirati, N. (2023) · Utrecht University Repository (Utrecht University) · doi:10.33540/2077
Znaidi, R. (2023) · theses.fr (ABES) · doi:10.70675/fc5affbdz1b90z4faaza5eczde1aaa097238
G3BP1 Maintains Lysosomal Homeostasis to Limit Tau Aggregate AccumulationPreprint
Kimura, T., Saito, R., Okada, M., Matoba, S., Hoshino, A., & Watanabe, Y. (2025) · bioRxiv (Cold Spring Harbor Laboratory) · doi:10.1101/2025.08.29.672259
Tirupathi, S. J., & Uversky, V. N. (2025) · Advances in protein chemistry and structural biology · doi:10.1016/bs.apcsb.2025.10.031
Karim, M. R. U., Haque, S. K. L., Islam, M., Higgins, C., Selim, M., Sardar, M. N., & Du, D. (2026) · The Journal of Physical Chemistry B · doi:10.1021/acs.jpcb.5c07284
Liquid–liquid phase separation of tau in Alzheimer’s disease
Rajkhowa, S., & Tripathi, T. (2026) · International review of neurobiology · doi:10.1016/bs.irn.2026.01.009
Franck, M., Biswas, A., Jiang, P., Fernández-Campo, M., Mohapatra, S., Sankar, R., Dominguez‐Baquero, A., Ravatt, L. M., Nagy-Herczeg, B. K., Kantar, O. E., et al. (2026) · bioRxiv (Cold Spring Harbor Laboratory) · doi:10.64898/2026.03.18.711671
Self-citationIn Situ Online Spectroscopy and Light Scattering Techniques
Brognaro, H., & Betzel, C. (2026) · Advances in biochemical engineering, biotechnology · doi:10.1007/10_2026_315
Self-citationDenéchaud, M. (2022) · theses.fr (ABES) · doi:10.70675/623e7224z0cb0z47b1z8a22z549acf553ac0
MAP6 : a multifunctional regulator of the cytoskeleton
Cuveillier, C. (2022) · theses.fr (ABES) · doi:10.70675/3fd3fd45z44bfz4d0bzadb4z6b70c5f2daae
Engineering artificial biomolecular condensates to study the aggregation of α-Synuclein
Piroska, M.-L. (2023) · theses.fr (ABES) · doi:10.70675/1d15bb63z3f2fz4a91z80f1z5086a39a5087
Vassiliou, C., Hochmair, J., Sankar, R., de Abreu, A. C. O. V., Onken, J., Sauvigny, T., Fidzinski, P., Wegmann, S., & Dean, C. (2026) · bioRxiv (Cold Spring Harbor Laboratory) · doi:10.64898/2026.04.05.716545
Self-citationSynthetic Biomolecular Condensates as Tunable Microtubule Assembly HubsPreprint
Srinivasan, S., Singh, A. A., Potoyan, D. A., & Banerjee, P. R. (2026) · bioRxiv (Cold Spring Harbor Laboratory) · doi:10.64898/2026.05.01.722010
Current hypothesis for AD progression
Kim, C. (2026) · Elsevier eBooks · doi:10.1016/b978-0-443-45844-6.00016-0
Mangiarotti, A., Ambroggio, E. E., & Celej, M. S. (2026) · Frontiers in Biophysics · doi:10.3389/frbis.2026.1860065
Riboregulation: a non-canonical tau function
LeBlanc, K. R., Eck, R. J., Benbow, S. J., & Kraemer, B. C. (2026) · Molecular Neurodegeneration · doi:10.1186/s13024-026-00949-x
Novel Analysis Method for Condensate Wetting Identifies Charge-Dependent Tau-Membrane Interactions
Anonymous, Ghosh, S., Sankar, R., Nagy-Herczeg, B. K., Wegmann, S., Agudo‐Canalejo, J., & Knorr, R. L. (2026) · PRX Life · doi:10.1103/8x47-4t2b
Self-citationSun, S., Yang, B., Chen, S., Huang, Q., Zhang, Y., Li, N., Peng, Q., Tam, K. Y., Wang, H., & Ying, Z. (2026) · Journal of Biological Chemistry · doi:10.1016/j.jbc.2026.113365
YOSHIDA, N., Shono, M., Yoshikawa, K., & Takinoue, M. (2026) · JACS Au · doi:10.1021/jacsau.6c00746
Polanco, D., Viguri-Lamata, B., van Zanten, T. S., & Cremades, N. (2026) · Current Opinion in Structural Biology · doi:10.1016/j.sbi.2026.103350
14-3-3/Tau molecular glues modulate in vitro tau condensation
van den Oetelaar, M. C. M., Ravatt, L. M., Maqueda, F., Oberheide, A., van der Wijngaart, T., Boxtel, F. V., Pennings, M. A. M., Verhoef, C. J. A., van Veldhuisen, T. W., Cossar, P. J., et al. (2026) · RSC Chemical Biology · doi:10.1039/d6cb00156d
Self-citationGurumoorthy, V., Zhang, Q., Leite, W. C., Hicks, A., Kolape, J., Lamichhane, R., & O’Neill, H. (2026) · bioRxiv (Cold Spring Harbor Laboratory) · doi:10.64898/2026.09.07.749946
Quantifying Biomolecule Concentration of Phase-Separated Condensates in Optofluidic Chips
Tang, J., Kathe, N. C., Lee, S. S., Novakovic, M., Allain, F. H. ‐., Tao, Y., Chen, X., Kolf, K., Qiu, G., & Wang, J. (2026) · ACS Sensors · doi:10.1021/acssensors.6c02043
Reproducible Agent-Based Simulations of Protein Aggregation: A FAIR Implementation
Gimón, I. V., Sandefur, C. I., & Schnell, S. D. (2026) · Bulletin of Mathematical Biology · doi:10.1007/s11538-026-01739-8
Site-specific phosphorylation of Ser352 drives aggregation of Tau R4 under acidosis conditions
Bressler, S., Blacher, C., Harpaz, K. A., Grunhaus, D., Rüdiger, S., Hurevich, M., Shalev, D. E., Miller, Y., & Friedler, A. (2026) · Chemical Science · doi:10.1039/d6sc04370d
Metadata
- Authors
- Hochmair, J., Exner, C., Franck, M., Dominguez‐Baquero, A., Diez, L., Brognaro, H., Kraushar, M. L., Mielke, T., Radbruch, H., Kaniyappan, S., Falke, S., Mandelkow, E., Betzel, C., & Wegmann, S.
- Affiliations
- German Center for Neurodegenerative Diseases (DE)
- Universität Hamburg (DE)
- Max Planck Institute for Molecular Genetics (DE)
- Charité – Universitätsmedizin Berlin (DE)
- University of Bonn (DE)
- Corresponding author
- Wegmann, Susanne
- ORCID
- Venue
- The EMBO Journal
- Published
- 2022-03-17
- Volume
- 41
- Issue
- 11
- Pages
- e108882-e108882
- ISSN
- 0261-4189 (ISSN-L)
- 1460-2075
- PMC
- PMC9156969
- OpenAlex
- W4221061896
- Cited by
- 106
- References
- 94
- Citations by year
- 2026: 38 · 2025: 25 · 2024: 12 · 2023: 22 · 2022: 9
- FWCI
- 5.78
- Type
- journal article
- Language
- en
- Open access
- hybrid
- doi.org
- Licence
- Locations
- The EMBO Journal (publishedVersion, cc-by-nc-nd)
- bioRxiv (Cold Spring Harbor Laboratory) (submittedVersion)
- PubMed (publishedVersion)
- PubMed Central (publishedVersion, cc-by-nc-nd)
- DZNE Pub (submittedVersion, other-oa)
- Funders
- Deutsche Forschungsgemeinschaft (402723784, EXC 2056)
- Deutsches Zentrum für Neurodegenerative Erkrankungen
- Gemeinnützige Hertie‐Stiftung
- BrightFocus Foundation
- Topics
- Life Sciences › Neuroscience › Cellular and Molecular Neuroscience › Alzheimer's disease research and treatments
- Health Sciences › Medicine › Clinical Neurology › Amyotrophic Lateral Sclerosis Research
- Life Sciences › Biochemistry, Genetics and Molecular Biology › Cell Biology › Microtubule and mitosis dynamics
- Keywords
- tau protein, biomolecular condensates, liquid-liquid phase separation, macromolecular crowding, microtubule bundling, microtubule assembly, tau aggregation, nuclear transport, fluorescence lifetime imaging, molecular packing density, neurodegenerative diseases
- MeSH terms
- Humans, Microtubules, Neurons, Protein Binding, RNA, tau Proteins, Neurodegenerative Diseases
About these checks
Registry, retraction, Cites and statistics results are computed, not judged, with one exception: a printed reference that no index lists is read once by a model before it counts as a citation error. Claims are extracted by a model and kept only when their quote appears verbatim in the text; each cited source is then checked, with a model’s help, for whether it says what the claim relies on. Those verdicts can be wrong — read the claim’s quote and the cited source before relying on one.
A language model drew the claims from the paper on 2026-11-13, under version 3 of the claim definition (model deepseek-v4.1-flash, prompt extract-v3).
A second model labelled each claim on 2026-11-13 (model jev-1.13-20260917, definition revision gold-guideline-v0.2).
Statistics and arithmetic are recomputed, not judged.
Confidence bands are shown only for fields calibrated on our annotated test set. None is calibrated yet, so no band is shown.
What counts as a claim ›How we measure confidence ›How we check this ›
Are you an author, or do you see a problem with this page? Request a review
Data sources
Bibliographic data: Semantic Scholar, OpenAlex, Crossref.
Contains information from the Semantic Scholar Academic Graph Datasets, made available under the ODC Attribution License (ODC-BY 1.0).
Semantic Scholar’s data is described in: Kinney, R., et al. (2023). The Semantic Scholar Open Data Platform. arXiv:2301.10140.
