

The DOI matches its Crossref record; 28 of the 28 references it cites were found in a registry or an index.
The role of interleukin‐6 in monitoring severe case of coronavirus disease 2019
Open accessPublished version of a preprint
Abstract
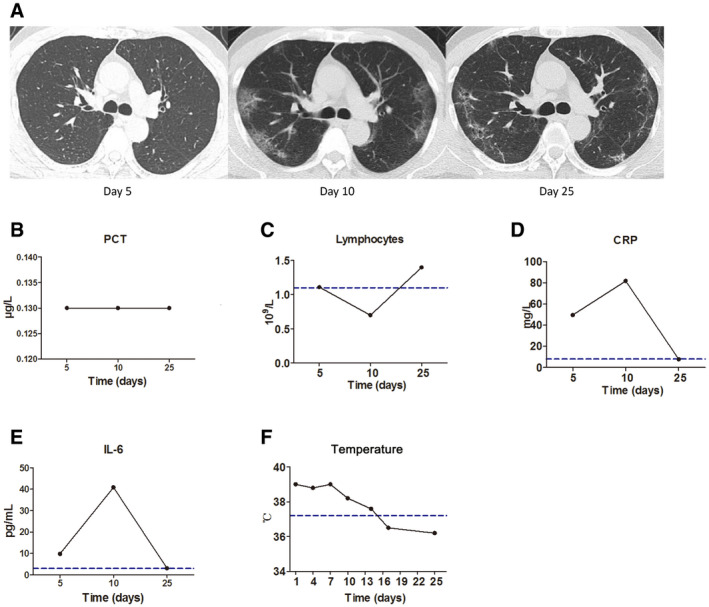
Progression to severe disease is a difficult problem in treating coronavirus disease 2019 (COVID‐19). The purpose of this study is to explore changes in markers of severe disease in COVID‐19 patients. Sixty‐nine severe COVID‐19 patients were included. Patients with severe disease showed significant lymphocytopenia. Elevated level of lactate dehydrogenase (LDH), C‐reactive protein (CRP), ferritin, and D‐dimer was found in most severe cases. Baseline interleukin‐6 (IL‐6) was found to be associated with COVID‐19 severity. Indeed, the significant increase of baseline IL‐6 was positively correlated with the maximal body temperature during hospitalization and with the increased baseline of CRP, LDH, ferritin, and D‐dimer. High baseline IL‐6 was also associated with more progressed chest computed tomography (CT) findings. Significant decrease in IL‐6 and improved CT assessment was found in patients during recovery, while IL‐6 was further increased in exacerbated patients. Collectively, our results suggest that the dynamic change in IL‐6 can be used as a marker for disease monitoring in patients with severe COVID‐19.
Overview
The claims and statistics of this paper haven’t been checked yet.
Run the check — free, no account needed. It reads the open-access text and checks the sources it cites.
Integrity signals
Registry
Cites
Statistics
Figures
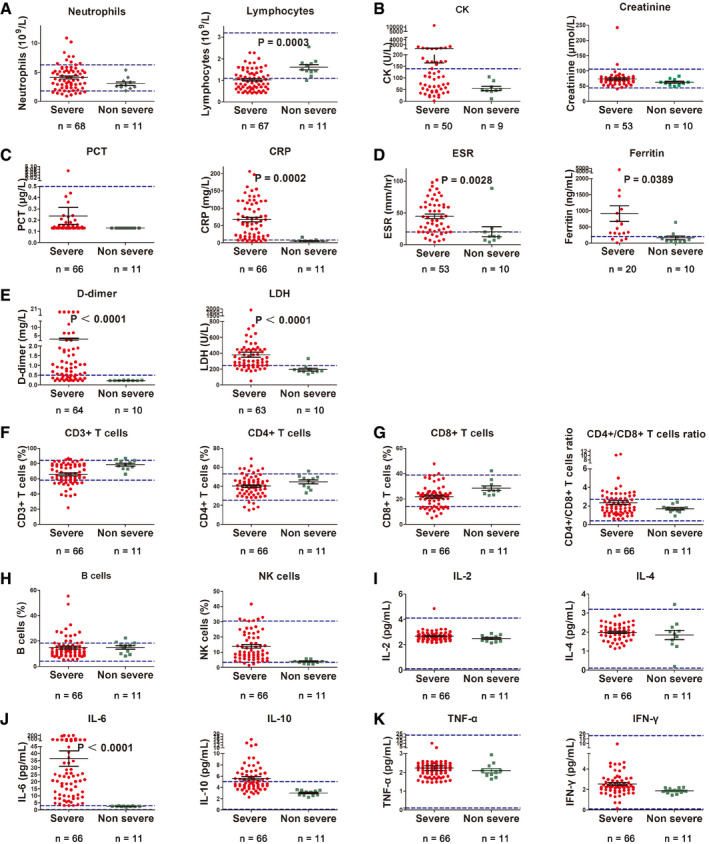
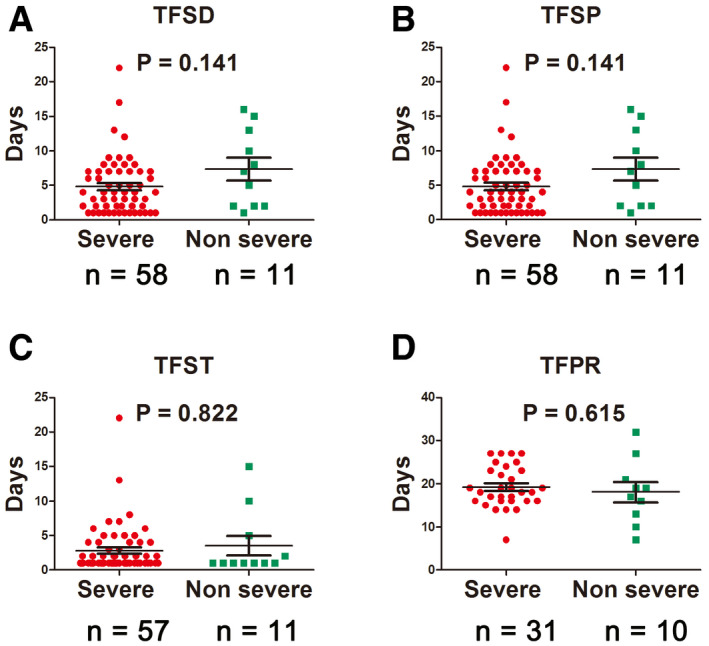
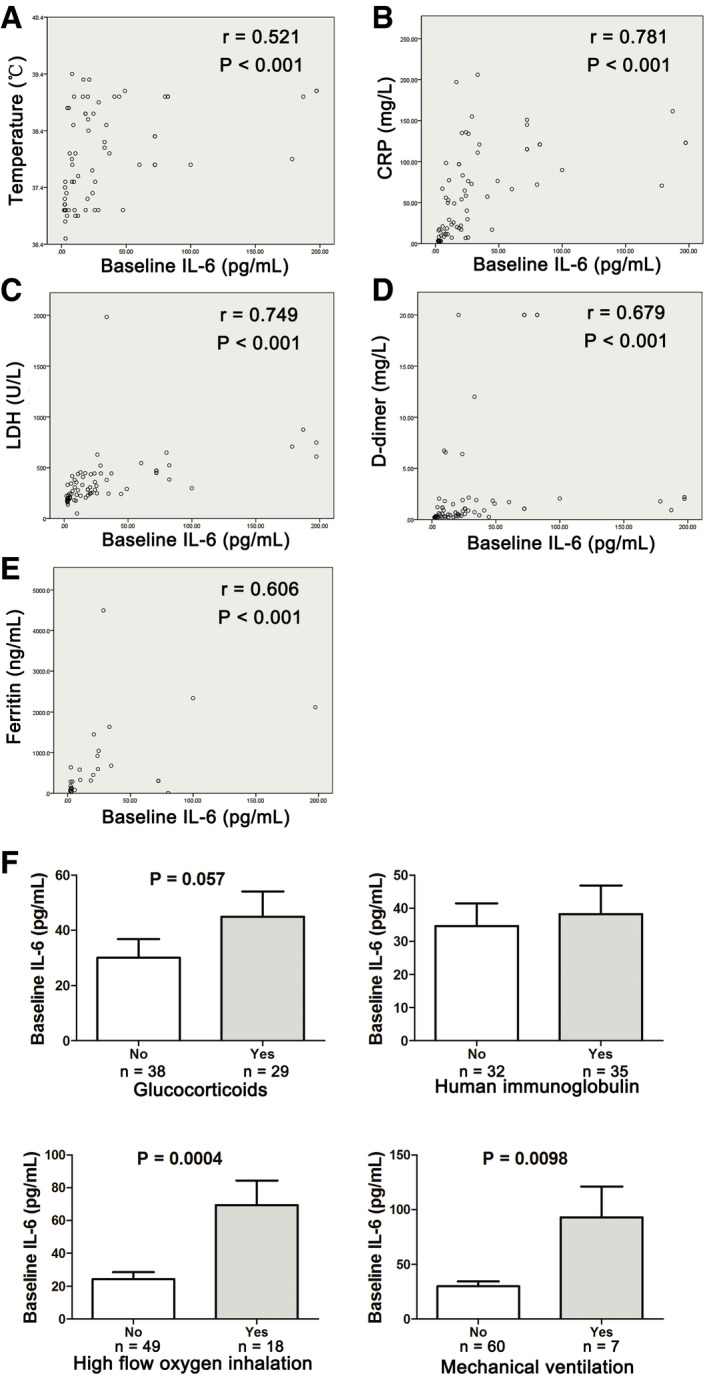
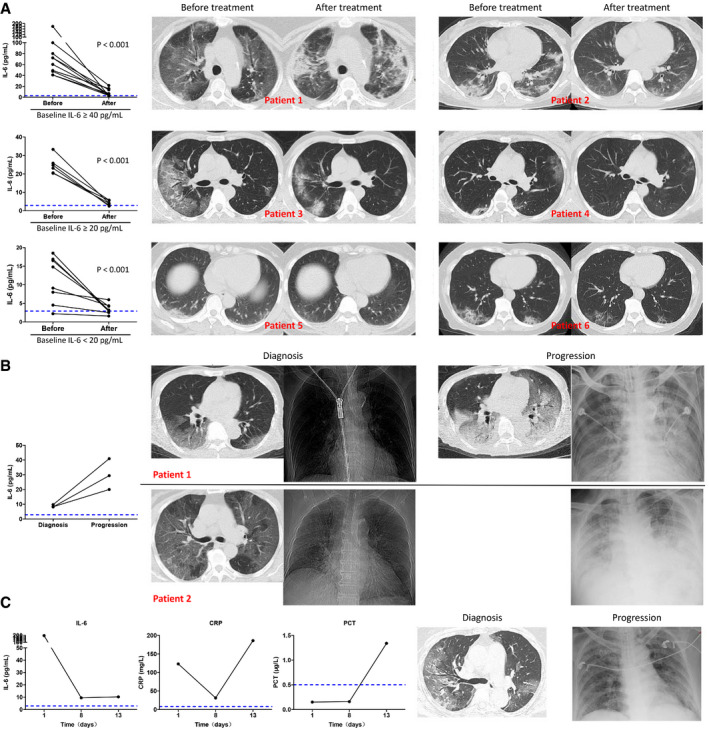
Verification
Claims the paper makes
The claims and statistics of this paper haven’t been checked yet.
Run the check — free, no account needed. It reads the open-access text and checks the sources it cites.
Claims other papers make about this one
Each is checked against this paper’s own text: does it say what the citing paper says it does?
The source backs part of the claim, not all of it — or backs it for a different population, condition or comparison.
In the citing paper
“Patients infected with SARS-CoV-2 present elevated levels of IL-6, IL-10, IL-1β, INF-γ, CCL2, TNF-α, CXCL10, CCL7, IL-1 receptor antagonist and IL-2 receptor, supposedly associated with disease severity [9, 98–105].”
From Hyperactivation of P2X7 receptors as a culprit of COVID-19 neuropathology (2021) · cites this paper as [104]
Experimental — accuracy not yet measured
Self-check
Percentages, sums and reported differences re-computed from the paper’s own numbers.
The self-check needs the paper’s full text.
Citations
Cites
Clinical features of patients infected with 2019 novel coronavirus in Wuhan, China
Huang, C., Wang, Y., Li, X., Ren, L., Zhao, J., Hu, Y., Zhang, L., Fan, G., Xu, J., Gu, X., et al. (2020) · The Lancet · doi:10.1016/s0140-6736(20)30183-5 · Cited by 48,884
Self-citationClinical characteristics of coronavirus disease 2019 in China
Guan, W.-J., Ni, Z.-Y., Hu, Y., Liang, W.-H., Ou, C.-Q., He, J.-X., Liu, L., Shan, H., Lei, C.-L., Hui, D. S. C., et al. (2020) · New England Journal of Medicine · doi:10.1056/nejmoa2002032 · Cited by 30,246
A pneumonia outbreak associated with a new coronavirus of probable bat origin
Zhou, P., Yang, X.-L., Wang, X.-G., Hu, B., Zhang, L., Zhang, W., Si, H.-R., Zhu, Y., Li, B., Huang, C.-L., et al. (2020) · Nature · doi:10.1038/s41586-020-2012-7 · Cited by 21,969
Wang, D., Hu, B., Hu, C., Zhu, F., Liu, X., Zhang, J., Wang, B., Xiang, H., Cheng, Z., Xiong, Y., et al. (2020) · JAMA · doi:10.1001/jama.2020.1585 · Cited by 20,148
Self-citationLa certeza de lo impredecible: Cultura Educación y Sociedad en tiempos de COVID19
Martínez González, M. (2020) · DSPACE System - Metalibrary (University of the Coast) · Cited by 18,463
Wu, Z., & McGoogan, J. M. (2020) · JAMA · doi:10.1001/jama.2020.2648 · Cited by 17,016
Yang, X., Yu, Y., Xu, J., Shu, H., Xia, J., Liu, H., Wu, Y., Zhang, L., Yu, Z., Fang, M., et al. (2020) · The Lancet Respiratory Medicine · doi:10.1016/s2213-2600(20)30079-5 · Cited by 10,066
Self-citationIL‐6 in inflammation, immunity, and disease
Tanaka, T., Narazaki, M., & Kishimoto, T. (2014) · Cold Spring Harbor Perspectives in Biology · doi:10.1101/cshperspect.a016295 · Cited by 5,046
Channappanavar, R., & Perlman, S. (2017) · Seminars in Immunopathology · doi:10.1007/s00281-017-0629-x · Cited by 2,524
Liu, J., Li, S., Liu, J., Liang, B., Wang, X., Wang, H., Li, W., Tong, Q., Yi, J., Zhao, L., et al. (2020) · EBioMedicine · doi:10.1016/j.ebiom.2020.102763 · Cited by 1,726
Self-citation
Cited by
Sorted by citations
Immunology of COVID-19: Current State of the Science
Vabret, N., Britton, G. J., Gruber, C., Hegde, S., Kim, J., Kuksin, M., Levantovsky, R., Malle, L., Moreira, A., Park, M. D., et al. (2020) · Immunity · doi:10.1016/j.immuni.2020.05.002 · Cited by 1,623
Risk factors for severe and critically ill COVID‐19 patients: A review
Gao, Y., Ding, M., Dong, X., Zhang, J., Azkur, A. K., Azkur, D., Gan, H. K., Sun, Y., Fu, W., Li, W., et al. (2020) · Allergy · doi:10.1111/all.14657 · Cited by 1,453
Self-citationCOVID-19: Transmission, prevention, and potential therapeutic opportunities
Lotfi, M., Hamblin, M. R., & Rezaei, N. (2020) · Clinica Chimica Acta · doi:10.1016/j.cca.2020.05.044 · Cited by 1,065
Interleukin‐6 in Covid‐19: A systematic review and meta‐analysis
Coomes, E. A., & Haghbayan, H. (2020) · Reviews in Medical Virology · doi:10.1002/rmv.2141 · Cited by 914
Leisman, D. E., Ronner, L., Pinotti, R., Taylor, M. D., Sinha, P., Calfee, C. S., Hirayama, A. V. V., Mastroianni, F., Turtle, C. J., Harhay, M. O., et al. (2020) · The Lancet Respiratory Medicine · doi:10.1016/s2213-2600(20)30404-5 · Cited by 874
Metadata
- Authors
- Liu, T., Zhang, J., Yang, Y., Ma, H., Li, Z., Zhang, J., Cheng, J., Zhang, X., Zhao, Y., Xia, Z., Zhang, L., Wu, G., & Yi, J.
- Affiliations
- Wuhan Union Hospital (CN)
- Fudan University (CN)
- Corresponding author
- Zhang, Liling
- Wu, Gang
- Yi, Jianhua
- ORCID
- Venue
- EMBO Molecular Medicine
- Published
- 2020-06-05
- Volume
- 12
- Issue
- 7
- Pages
- e12421-e12421
- ISSN
- 1757-4676 (ISSN-L)
- 1757-4684
- PMC
- PMC7280589
- OpenAlex
- W3025830962
- Cited by
- 498
- References
- 27
- Citations by year
- 2026: 13 · 2025: 27 · 2024: 38 · 2023: 83 · 2022: 87 · 2021: 118 · 2020: 130
- FWCI
- 13.69
- Type
- journal article
- Language
- en
- Open access
- gold
- doi.org
- Locations
- EMBO Molecular Medicine (publishedVersion, cc-by)
- medRxiv (acceptedVersion)
- PubMed Central (publishedVersion, cc-by)
- PubMed (publishedVersion)
- DOAJ (DOAJ: Directory of Open Access Journals) (submittedVersion, cc-by-sa)
- Funders
- The National Natural Science Foundation of China (81602696)
- Fundamental Research Funds for Central Universities of the Central South University (2015QN190)
- The National Science and Technology Major Project of China (2018ZX10302204‐002‐003)
- Topics
- Health Sciences › Medicine › Infectious Diseases › COVID-19 Clinical Research Studies
- Health Sciences › Medicine › Infectious Diseases › SARS-CoV-2 and COVID-19 Research
- Health Sciences › Medicine › Clinical Neurology › Long-Term Effects of COVID-19
- Keywords
- interleukin-6, severe COVID-19, disease severity markers, lymphopenia, lactate dehydrogenase, C-reactive protein, ferritin, D-dimer, chest CT findings, fever, disease surveillance, cytokine dynamics
- MeSH terms
- Betacoronavirus, COVID-19, SARS-CoV-2, Adult, Aged, Aged, 80 and over, Antiviral Agents, C-Reactive Protein, Female, Humans, Lymphopenia, Male, Middle Aged, Pneumonia, Viral, Severity of Illness Index, Tomography, X-Ray Computed, Biomarkers, Interleukin-6, Coronavirus Infections, Pandemics
About these checks
Registry, retraction, Cites and statistics results are computed, not judged, with one exception: a printed reference that no index lists is read once by a model before it counts as a citation error. Claims are extracted by a model and kept only when their quote appears verbatim in the text; each cited source is then checked, with a model’s help, for whether it says what the claim relies on. Those verdicts can be wrong — read the claim’s quote and the cited source before relying on one.
Statistics and arithmetic are recomputed, not judged.
Confidence bands are shown only for fields calibrated on our annotated test set. None is calibrated yet, so no band is shown.
What counts as a claim ›How we measure confidence ›How we check this ›
Are you an author, or do you see a problem with this page? Request a review
