

The DOI matches its Crossref record; 10 of the 10 references it cites were found in a registry or an index.
Disparities in excess mortality associated with COVID-19 - united states, 2020
Open accessAbstract
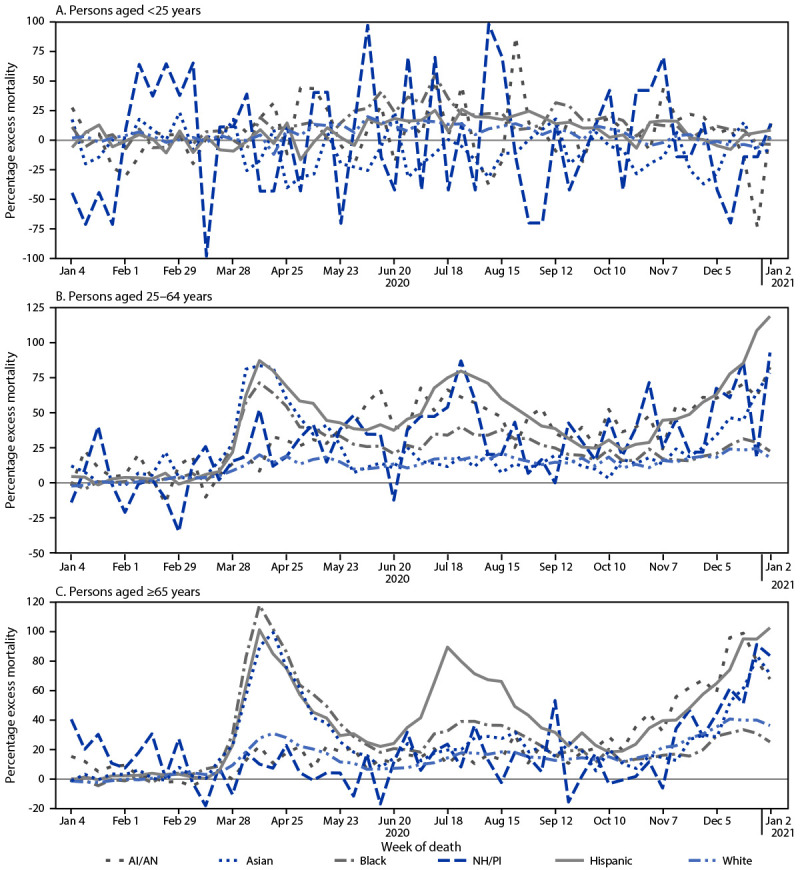
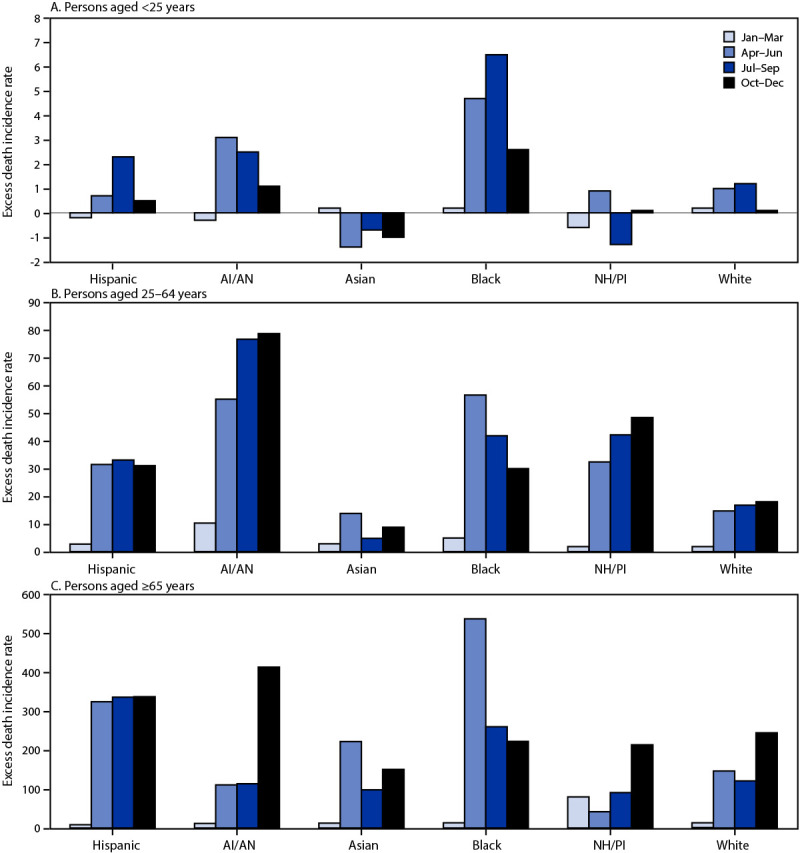
The COVID-19 pandemic has disproportionately affected Hispanic or Latino, non-Hispanic Black (Black), non-Hispanic American Indian or Alaska Native (AI/AN), and non-Hispanic Native Hawaiian or Other Pacific Islander (NH/PI) populations in the United States. These populations have experienced higher rates of infection and mortality compared with the non-Hispanic White (White) population (1-5) and greater excess mortality (i.e., the percentage increase in the number of persons who have died relative to the expected number of deaths for a given place and time) (6). A limitation of existing research on excess mortality among racial/ethnic minority groups has been the lack of adjustment for age and population change over time. This study assessed excess mortality incidence rates (IRs) (e.g., the number of excess deaths per 100,000 person-years) in the United States during December 29, 2019-January 2, 2021, by race/ethnicity and age group using data from the National Vital Statistics System. Among all assessed racial/ethnic groups (non-Hispanic Asian [Asian], AI/AN, Black, Hispanic, NH/PI, and White populations), excess mortality IRs were higher among persons aged ≥65 years (426.4 to 1033.5 excess deaths per 100,000 person-years) than among those aged 25-64 years (30.2 to 221.1) and those aged <25 years (-2.9 to 14.1). Among persons aged <65 years, Black and AI/AN populations had the highest excess mortality IRs. Among adults aged ≥65 years, Black and Hispanic persons experienced the highest excess mortality IRs of >1,000 excess deaths per 100,000 person-years. These findings could help guide more tailored public health messaging and mitigation efforts to reduce disparities in mortality associated with the COVID-19 pandemic in the United States,* by identifying the racial/ethnic groups and age groups with the highest excess mortality rates.
Overview
The claims and statistics of this paper haven’t been checked yet.
Run the check — free, no account needed. It reads the open-access text and checks the sources it cites.
Integrity signals
Registry
Cites
Statistics
Figures
Verification
Claims the paper makes
The claims and statistics of this paper haven’t been checked yet.
Run the check — free, no account needed. It reads the open-access text and checks the sources it cites.
Claims other papers make about this one
Each is checked against this paper’s own text: does it say what the citing paper says it does?
The source backs part of the claim, not all of it — or backs it for a different population, condition or comparison.
In the citing paper
“It is well documented that COVID-19 infections and pandemic-related mortality are higher in African American than White adults in all age groups (Rossen et al., 2021).”
From Young Adult Adaptability to the Social Challenges of the COVID-19 Pandemic: The Protective Role of Friendships (2022) · cites this paper as Rossen et al., 2021
Experimental — accuracy not yet measuredIn the citing paper
“Prior work has shown important disparities in COVID-19 impact by race/ethnicity and economic status (Mena et al., 2021; Rossen, 2021) in the US and abroad.”
From Direct and indirect mortality impacts of the COVID-19 pandemic in the United States, March 1, 2020 to January 1, 2022 (2023) · cites this paper as Rossen, 2021
Self-check
Percentages, sums and reported differences re-computed from the paper’s own numbers.
The self-check needs the paper’s full text.
Citations
Cites
COVID-19 and Racial/Ethnic Disparities
Hooper, M. W., Nápoles, A. M., & Pérez‐Stable, E. J. (2020) · JAMA · doi:10.1001/jama.2020.8598 · Cited by 2,080
Arias, E., Schauman, W. S., Eschbach, K., Sorlie, P. D., & Backlund, E. (2008) · PubMed · Cited by 451
Racial and Ethnic Disparities in Population-Level Covid-19 Mortality
Gross, C. P., Essien, U. R., Pasha, S., Gross, J. R., Wang, S.-Y., & Nunez-Smith, M. (2020) · Journal of General Internal Medicine · doi:10.1007/s11606-020-06081-w · Cited by 410
Rossen, L. M., Branum, A. M., Ahmad, F. B., Sutton, P., & Anderson, R. N. (2020) · MMWR Morbidity and Mortality Weekly Report · doi:10.15585/mmwr.mm6942e2 · Cited by 373
Self-citationRace, Ethnicity, and Age Trends in Persons Who Died from COVID-19 — United States, May–August 2020
Gold, J. A. W., Rossen, L. M., Ahmad, F. B., Sutton, P. D., Li, Z., Salvatore, P. P., Coyle, J. P., DeCuir, J., Baack, B. N., Durant, T. M., et al. (2020) · MMWR Morbidity and Mortality Weekly Report · doi:10.15585/mmwr.mm6942e1 · Cited by 336
Self-citationProvisional Mortality Data — United States, 2020
Ahmad, F. B., Cisewski, J. A., Miniño, A., & Anderson, R. N. (2021) · MMWR Morbidity and Mortality Weekly Report · doi:10.15585/mmwr.mm7014e1 · Cited by 311
Self-citationSharpening the global focus on ethnicity and race in the time of COVID-19
Bhala, N. B., Curry, G., Martineau, A. R., Agyemang, C. O., & Bhopal, R. S. (2020) · The Lancet · doi:10.1016/s0140-6736(20)31102-8 · Cited by 280
Bassett, M. T., Chen, J. T., & Krieger, N. (2020) · PLoS Medicine · doi:10.1371/journal.pmed.1003402 · Cited by 277
Bassett, M. T., Chen, J. T., & Krieger, N. (2021) · PLoS Medicine · doi:10.1371/journal.pmed.1003541 · Cited by 191
Faust, J. S., Du, C., Mayes, K. D., Li, S., Lin, Z., Barnett, M. L., & Krumholz, H. M. (2021) · JAMA · doi:10.1001/jama.2021.8012 · Cited by 117
Self-citation
Cited by
Sorted by citations
Items 101–146 of 146
The coronavirus disease 2019 pandemic: the disruptor that maintenance dialysis never anticipated
Weinhandl, E. D. (2022) · Current Opinion in Nephrology & Hypertension · doi:10.1097/mnh.0000000000000777 · Cited by 2
Whom Do Incentive Program Physicians Serve? New Measures for Assessing Program Reach
Quigley, L. (2022) · Journal of Ambulatory Care Management · doi:10.1097/jac.0000000000000425 · Cited by 2
Ortega‐Villa, A. M., Hynes, N. A., Levine, C. B., Yang, K. Y., Wiley, Z., Jilg, N., Wang, J., Whitaker, J. A., Colombo, C. J., Nayak, S., et al. (2023) · Open Forum Infectious Diseases · doi:10.1093/ofid/ofad290 · Cited by 2
Gona, P. N., Estrada-Martínez, L. M., Zhang, L., Gona, C. M., Mody, A., Rao, S. R., Cooper, J. B., Mack-Shelton, K. V., Chen, P., Leveille, S. G., et al. (2024) · BMC Public Health · doi:10.1186/s12889-024-20522-9 · Cited by 2
Faust, J. S., Renton, B., Chen, A. J., Du, C., Liang, C., Li, S., Lin, Z., & Krumholz, H. M. (2022) · medRxiv · doi:10.1101/2022.07.07.22277315 · Cited by 2
Self-citationLife Expectancy and Disease Burden in Older People in the Region of the Americas
Pan American Health Organization (2023) · Pan American Health Organization eBooks · doi:10.37774/9789275126714 · Cited by 1
Ford, C. L., Cook, M. C., & Cross, R. I. (2024) · Epidemiologic Reviews · doi:10.1093/epirev/mxae005 · Cited by 1
Ennis, J. S., Riggan, K. A., Nguyen, N. V., Smith, A. K., Kramer, D. B., Sulmasy, D. P., Tilburt, J. C., & DeMartino, E. S. (2026) · Journal of the American Geriatrics Society · doi:10.1111/jgs.70300 · Cited by 1
Kurup, C., & Rijal, D. (2026) · Nursing Open · doi:10.1002/nop2.70754 · Cited by 1
COVID-19 Geçiren Yaşlıların Deneyimleri: Hatay Örneğinde Nitel Bir Çalışma
Arık, I. A., & Ferhat, A. R. I. K. (2022) · Hacettepe Üniversitesi Edebiyat Fakültesi Dergisi · doi:10.32600/huefd.1080996 · Cited by 3
Jester, D. J., & Leutwyler, H. C. (2023) · International Psychogeriatrics · doi:10.1017/s1041610223000352 · Cited by 1
Renton, B., Du, C., Chen, A. J., Li, S., Lin, Z., Krumholz, H. M., & Faust, J. S. (2023) · Journal of General Internal Medicine · doi:10.1007/s11606-023-08374-2 · Cited by 1
Self-citationExpectativa de vida e carga de doença nas pessoas idosas da Região das Américas
da Saúde, O. P.-A. (2023) · doi:10.37774/9789275726716 · Cited by 1
Dorabawila, V., Hoen, R., & Hoefer, D. (2024) · Journal of Racial and Ethnic Health Disparities · doi:10.1007/s40615-024-02211-w · Cited by 1
Faust, J. S., Du, C., Mayes, K. D., Renton, B., Li, S., Lin, Z., & Krumholz, H. M. (2021) · medRxiv · doi:10.1101/2021.09.16.21263477 · Cited by 1
Self-citationMajnoonian, A., Duong, D., Vo, A. T., Wijaya, C., Nguyen, M., Flores, M., Omaleki, V., Le, T., & Fielding-Miller, R. K. (2023) · Research Square · doi:10.21203/rs.3.rs-2488760/v1 · Cited by 1
Weinberger, D. M., Bhaskaran, K., Korves, C., Lucas, B., Columbo, J. A., Vashi, A. A., Davies, L., Justice, A. C., & Rentsch, C. T. (2023) · medRxiv · doi:10.1101/2023.05.12.23289900 · Cited by 1
Cordeiro, M. (2021) · USF Scholarship Repository (University of San Francisco)
Merckx, J., Crèveceour, J., Proesmans, K., Hammami, N., Denys, H., & Hens, N. (2022) · Research Square · doi:10.21203/rs.3.rs-1192357/v1
Chen, Z., Grace, X., Zhang, X., & McLemore, M. R. (2022) · Health Equity · doi:10.1089/heq.2022.0124
Value of Environmental Health During the COVID-19 Pandemic: A Story From Indian Country
Piontkowski, S., Hickey, B. N., Woodlee, C., & Taylor, K. M. (2022) · Disaster Medicine and Public Health Preparedness · doi:10.1017/dmp.2022.244
Siedhoff, M. (2022) · Geographica Helvetica · doi:10.5194/gh-77-505-2022
Impact of coronavirus disease 2019 on co-morbidities in HIV
Guaraldi, G., & Milić, J. (2023) · Current Opinion in HIV and AIDS · doi:10.1097/coh.0000000000000785
Aune, K. T., Grantz, K. H., Menezes, N. P., Robsky, K., Gurley, E. S., Marx, M. A., & Phelan-Emrick, D. F. (2023) · American Journal of Epidemiology · doi:10.1093/aje/kwad186
Heterogeneity in deaths of despair: excess mortality in the US during the Covid-19 pandemicPreprint
Kandula, S., Keyes, K. M., & Shaman, J. L. (2024) · medRxiv · doi:10.1101/2024.01.14.24301291
Health System Response to the Coincidence of the COVID-19 Pandemic and Disasters: A Call for Action
Sohrabizadeh, S., Möckel, L., Zaré, M., & Yarmohammadian, M. H. (2024) · Frontiers research topics · doi:10.3389/978-2-8325-4761-8
Barrett, R., Zuckerman, M. K., Dudgeon, M. R., & Armelagos, G. J. (2024) · Oxford University Press eBooks · doi:10.1093/oso/9780192843135.003.0006
Rahim, J., Sen, B., Ghosh, P., Lee, E., & Brisendine, A. E. (2025) · Ethics Medicine and Public Health · doi:10.1016/j.jemep.2025.101055
Paternina-Caicedo, Á. J., Espinosa, O., Sheth, S. S., Hupert, N., & Saghafian, S. (2025) · Annals of Internal Medicine · doi:10.7326/annals-24-02794
End of the Pandemic or End of Progress?
Hlatshwayo, M., & Page, K. R. (2025) · The Journal of Infectious Diseases · doi:10.1093/infdis/jiaf257
Jungst, D., Solomonides, A. E., & Konchak, C. (2025) · Applied Clinical Informatics · doi:10.1055/a-2621-0110
Conley, T. D., Piemonte, J. L., Mangla, A., Mateti, N., Tariq, S., & Yang, T.-W. (2025) · Analyses of Social Issues and Public Policy · doi:10.1111/asap.70025
Levitan, E. B., Howard, V. J., Cushman, M., Judd, S. E., Tison, S. E., Yuan, Y., Mukaz, D. K., Wang, H. E., Pamir, N., Plante, T. B., et al. (2021) · Figshare · doi:10.6084/m9.figshare.17163149
Levitan, E. B., Howard, V. J., Cushman, M., Judd, S. E., Tison, S. E., Yuan, Y., Mukaz, D. K., Wang, H. E., Pamir, N., Plante, T. B., et al. (2021) · Figshare · doi:10.6084/m9.figshare.17163152
Merckx, J., Crèvecoeur, J., Proesmans, K., Hammami, N., Denys, H., & Hens, N. (2022) · Figshare · doi:10.6084/m9.figshare.21341586
Uzair, M., Amir, H. B., Khan, Z. M., Siddiqi, H. A., & Sidhwa, A. Y. (2026) · Cureus · doi:10.7759/cureus.112594
Racial and ethnic disparities in the cause of death for clear cell renal cell carcinoma
Xie, Y., Zhang, Y., Li, S., Chen, L., Liu, Y., Xie, W., Zheng, Z., & Ping, H. (2026) · Nature Communications · doi:10.1038/s41467-026-70709-4
Self-citationReversals in the ‘Right to Health’? The Case of SARS-CoV-2
Pillay, N. (2026) · Laws · doi:10.3390/laws15040090
Blake, I., Singleton, R. J., Bruden, D. J. T., Gray, J., Fischer, M., & Keck, J. W. (2026) · International Journal of Circumpolar Health · doi:10.1080/22423982.2026.2706888
Rurality as a Risk Factor for Excess Mortality in Nebraska During the COVID-19 Pandemic
EINSPAHR, E., Du, Y., Lawler, J. V., Donahue, M. A., Paritala, S., & Maloney, P. (2026) · Journal of Primary Care & Community Health · doi:10.1177/21501319261498009
Juhász, L., Garba, N. A., Moise, I. K., Bhoite, P. B., Clark, C., Clarke, R. D., Stuver, N. K., & Brown, D. R. (2026) · PLoS ONE · doi:10.1371/journal.pone.0361211
Metadata
- Authors
- Rossen, L. M., Ahmad, F. B., Anderson, R. N., Branum, A. M., Du, C., Krumholz, H. M., Li, S.-X., Lin, Z., Marshall, A., Sutton, P. D., & Faust, J. S.
- Affiliations
- Brigham and Women's Hospital (US)
- Corresponding author
- Rossen, Lauren M.
- ORCID
- Venue
- MMWR Morbidity and Mortality Weekly Report
- Published
- 2021-08-20
- Volume
- 70
- Issue
- 33
- Pages
- 1114-1119
- ISSN
- 0149-2195 (ISSN-L)
- 1545-861X
- PMC
- PMC8375709
- OpenAlex
- W3195344687
- Cited by
- 146
- References
- 10
- Citations by year
- 2026: 9 · 2025: 7 · 2024: 27 · 2023: 41 · 2022: 51 · 2021: 11
- FWCI
- 12.57
- Type
- journal article
- Language
- en
- Open access
- diamond
- doi.org
- Locations
- MMWR Morbidity and Mortality Weekly Report (publishedVersion)
- PubMed Central (publishedVersion, public-domain)
- PubMed (publishedVersion)
- Funders
- National Institutes of Health (UL1TR001863)
- National Center for Advancing Translational Sciences
- Topics
- Physical Sciences › Mathematics › Modeling and Simulation › COVID-19 epidemiological studies
- Health Sciences › Medicine › Infectious Diseases › COVID-19 Clinical Research Studies
- Social Sciences › Health › Health disparities and outcomes
- Keywords
- COVID-19 pandemic, excess mortality, racial and ethnic disparities, Hispanic population, Black population, older adults, age-adjusted mortality rates, United States
- MeSH terms
- COVID-19, Adult, Aged, Ethnicity, Humans, Middle Aged, Mortality, United States, Age Distribution, Racial Groups, Health Status Disparities, Young Adult
About these checks
Registry, retraction, Cites and statistics results are computed, not judged, with one exception: a printed reference that no index lists is read once by a model before it counts as a citation error. Claims are extracted by a model and kept only when their quote appears verbatim in the text; each cited source is then checked, with a model’s help, for whether it says what the claim relies on. Those verdicts can be wrong — read the claim’s quote and the cited source before relying on one.
Statistics and arithmetic are recomputed, not judged.
Confidence bands are shown only for fields calibrated on our annotated test set. None is calibrated yet, so no band is shown.
What counts as a claim ›How we measure confidence ›How we check this ›
Are you an author, or do you see a problem with this page? Request a review
