

The DOI matches its Crossref record; 7 of the 7 references it cites were found in a registry or an index.
Caloric restriction rescues yeast cells from alpha-synuclein toxicity through autophagic control of proteostasis
Overview
The claims and statistics of this paper haven’t been checked yet.
Run the check — free, no account needed. It reads the open-access text and checks the sources it cites.
Integrity signals
Registry
Cites
Statistics
Figures
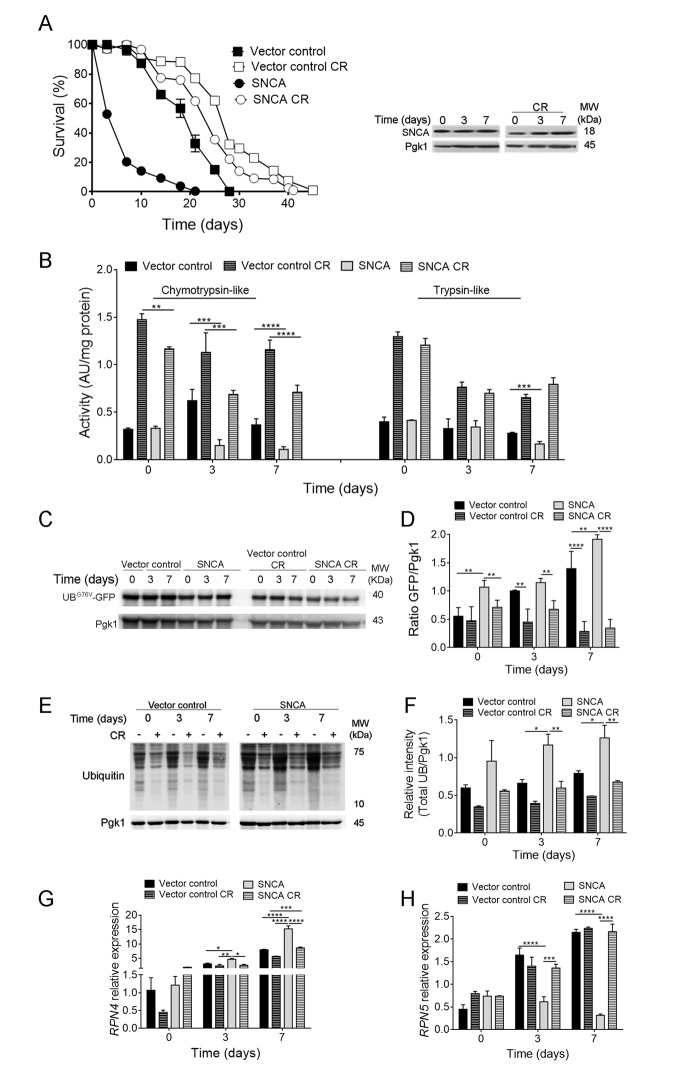
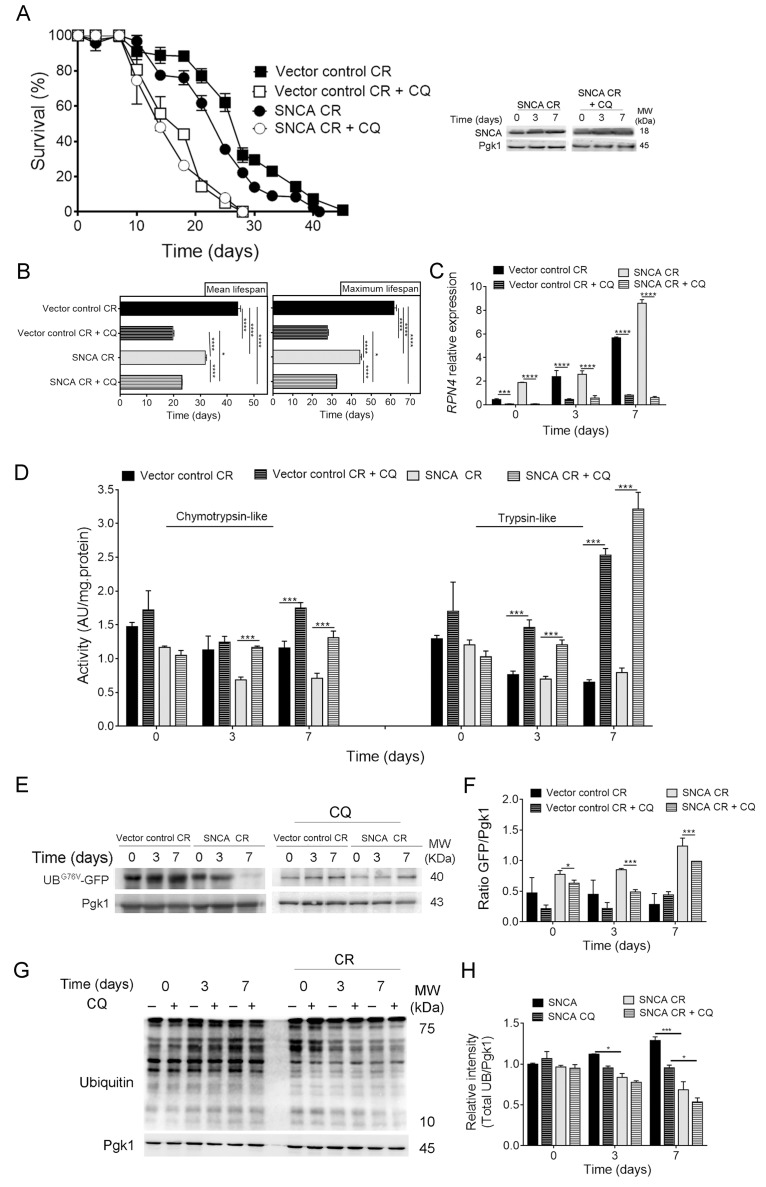
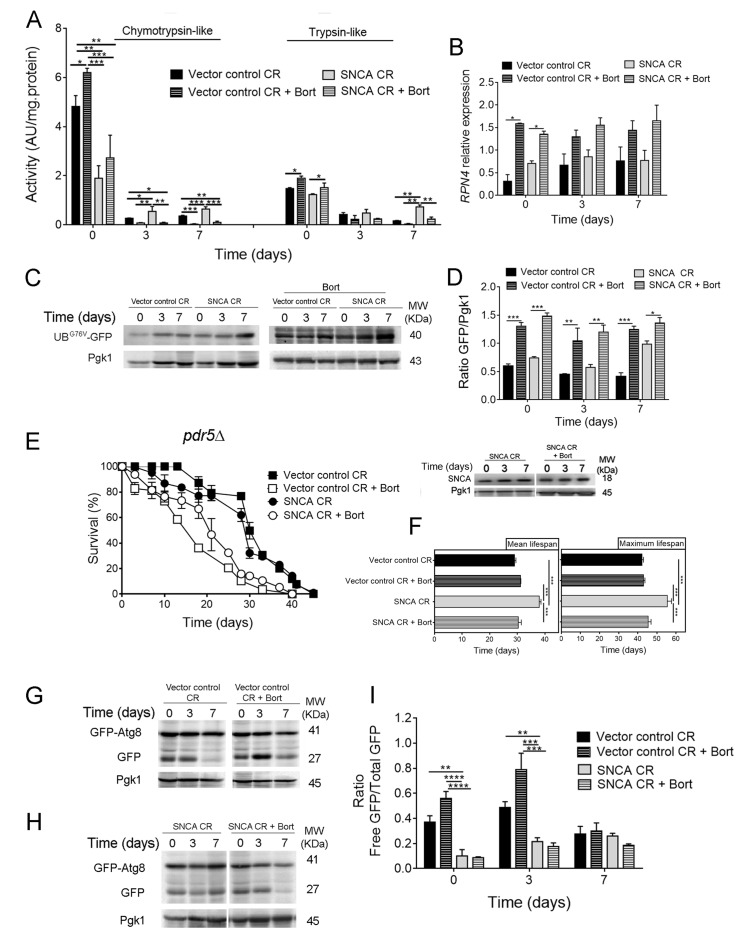
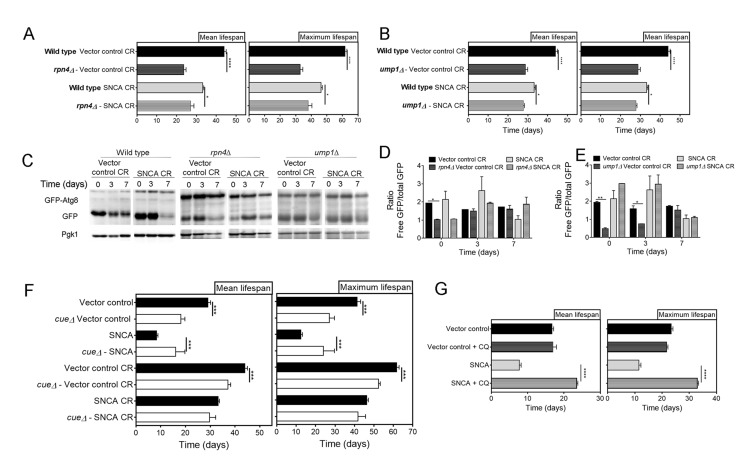
Verification
Claims the paper makes
The claims and statistics of this paper haven’t been checked yet.
Run the check — free, no account needed. It reads the open-access text and checks the sources it cites.
Claims other papers make about this one
Each is checked against this paper’s own text: does it say what the citing paper says it does?
In the citing paper
“TOLLIP-deficient monocytes are defective in lysosome fusion and are programmed into an inflamed state with elevated CCR5 and enhanced expression of chemokines such as CCL2/MCP1 [629, 631].”
From Guidelines for the use and interpretation of assays for monitoring autophagy (4th edition) 1 (2021) · cites this paper as [629]
In the citing paper
“TOLLIP may fulfill its critical function of lysosome fusion through its interaction with phospholipid [629, 630].”
From Guidelines for the use and interpretation of assays for monitoring autophagy (4th edition) 1 (2021) · cites this paper as [629]
Self-check
Percentages, sums and reported differences re-computed from the paper’s own numbers.
The self-check needs the paper’s full text.
Citations
Cites
The MIQE guidelines: minimum information for publication of quantitative real-time PCR experiments
Bustin, S. A., Benes, V., Garson, J. A., Hellemans, J., Huggett, J., Kubista, M., Mueller, R., Nolan, T., Pfaffl, M. W., Shipley, G. L., et al. (2009) · Clinical Chemistry · doi:10.1373/clinchem.2008.112797 · Cited by 16,303 · cited 3×
“The RNA extraction was carried out as previously described [52].”
MethodInfluentialGuidelines for the use and interpretation of assays for monitoring autophagy (3rd edition).
Klionsky, D. J., Abdelmohsen, K., Abe, A., Abedin, M. J., Abeliovich, H., Acevedo Arozena, A., Adachi, H., Adams, C. M., Adams, P. D., Adeli, K., et al. (2016) · Autophagy · doi:10.1080/15548627.2015.1100356 · Cited by 5,894
Self-citationPromoting Health and Longevity through Diet: From Model Organisms to Humans
Fontana, L., & Partridge, L. (2015) · Cell · doi:10.1016/j.cell.2015.02.020 · Cited by 1,245
HDAC6 rescues neurodegeneration and provides an essential link between autophagy and the UPS.
Pandey, U. B., Nie, Z., Batlevi, Y., McCray, B. A., Ritson, G. P., Nedelsky, N. B., Schwartz, S. L., DiProspero, N. A., Knight, M. A., Schuldiner, O., et al. (2007) · Nature · doi:10.1038/nature05853 · Cited by 1,234
Essential role for autophagy in life span extension
Madeo, F., Zimmermann, A., Maiuri, M. C., & Kroemer, G. (2015) · Journal of Clinical Investigation · doi:10.1172/jci73946 · Cited by 464
Autophagy is Required for Dietary Restriction-Mediated Life Span Extension in C. elegans
Jia, K., & Levine, B. (2007) · Autophagy · doi:10.4161/auto.4989 · Cited by 341
Exosomal secretion of α-synuclein as protective mechanism after upstream blockage of macroautophagy
Fussi, N., Höllerhage, M., Chakroun, T., Nykänen, N.-P., Rösler, T. W., Koeglsperger, T., Wurst, W., Behrends, C., & Höglinger, G. U. (2018) · Cell Death & Disease · doi:10.1038/s41419-018-0816-2 · Cited by 161 · cited 1×
“SNCA, an aggregation-prone protein, is a target for degradation by proteolytic systems including UPS and macroautophagy (hereafter called autophagy) (reviewed in [3-6]).”
Background
Research works printed but not linked: 47
- Masliah, 2013, The many faces of α-synuclein: from structure and toxicity to therapeutic target., Nat Rev Neurosci, 1, 38, 10.1038/nrn3406 · DOI
- Hewitt, 2016, Cellular proteostasis: degradation of misfolded proteins by lysosomes., Essays Biochem, 6, 173, 10.1042/EBC20160005 · DOI
- Unni, 2011, Distinct roles in vivo for the ubiquitin-proteasome system and the autophagy-lysosomal pathway in the degradation of α-synuclein., J Neurosci, 3, 14508, 10.1523/JNEUROSCI.1560-11.2011 · DOI
- Stefanis, 2013, α-Synuclein and protein degradation systems: a reciprocal relationship., Mol Neurobiol, 4, 537, 10.1007/s12035-012-8341-2 · DOI
- Rubinsztein, 2003, Alpha-Synuclein is degraded by both autophagy and the proteasome., J Biol Chem, 27, 25009, 10.1074/jbc.M300227200 · DOI · Paper page
- Winderickx, 2005, Characterization of alpha-synuclein aggregation and synergistic toxicity with protein tau in yeast., FEBS J, 27, 1386, 10.1111/j.1742-4658.2005.04571.x · DOI
- Paik, 2008, Dequalinium-induced cell death of yeast expressing alpha-synuclein-GFP fusion protein., Neurochem Res, 3, 1393, 10.1007/s11064-008-9598-8 · DOI
- Debburman, 2006, alpha-Synuclein budding yeast model: toxicity enhanced by impaired proteasome and oxidative stress., J Mol Neurosci, 2, 161, 10.1385/JMN:28:2:161 · DOI
- Braus, 2012, Aggregate clearance of α-synuclein in Saccharomyces cerevisiae depends more on autophagosome and vacuole function than on the proteasome., J Biol Chem, 28, 27567, 10.1074/jbc.M112.361865 · DOI · Paper page
- Outeiro, 2014, Phosphorylation modulates clearance of alpha-synuclein inclusions in a yeast model of Parkinson’s disease., PLoS Genet, 1, e1004302, 10.1371/journal.pgen.1004302 · DOI
- Ludovico, 2015, Sirtuins and proteolytic systems: implications for pathogenesis of synucleinopathies., Biomolecules, 5, 735, 10.3390/biom5020735 · DOI
- Chu, 2011, Diversity in the regulation of autophagy and mitophagy: lessons from Parkinson’s disease., Parkinsons Dis, 201, 789431, 10.4061/2011/789431 · DOI
- Tan, 2007, Role of the ubiquitin proteasome system in Parkinson’s disease., BMC Biochem, 8, S13, 10.1186/1471-2091-8-S1-S13 · DOI
- Unni, 2012, Alpha-synuclein’s degradation in vivo: opening a new (cranial) window on the roles of degradation pathways in Parkinson disease., Autophagy, 8, 281, 10.4161/auto.8.2.18938 · DOI · Paper page
- McLean, 2012, Protein degradation pathways in Parkinson’s disease: curse or blessing., Acta Neuropathol, 12, 153, 10.1007/s00401-012-1004-6 · DOI
- Greene, 2001, Expression of A53T mutant but not wild-type alpha-synuclein in PC12 cells induces alterations of the ubiquitin-dependent degradation system, loss of dopamine release, and autophagic cell death., J Neurosci, 2, 9549, 10.1523/JNEUROSCI.21-24-09549.2001 · DOI
- Grune, 2014, Protein oxidation and proteolytic signalling in aging., Curr Pharm Des, 2, 3040, 10.2174/13816128113196660709 · DOI
- Mattson, 1999, Dietary restriction and 2-deoxyglucose administration improve behavioral outcome and reduce degeneration of dopaminergic neurons in models of Parkinson’s disease., J Neurosci Res, 5, 195, 10.1002/(SICI)1097-4547(19990715)57:2<195::AID-JNR5>3.0.CO;2-P · DOI
- Sampaio-Marques, 2017, Caloric restriction alleviates alpha-synuclein toxicity in aged yeast cells by controlling the opposite roles of Tor1 and Sir2 on autophagy., Mech Ageing Dev, 16, 270, 10.1016/j.mad.2016.04.006 · DOI · Paper page
- Nazir, 2011, Sir-2.1 modulates ‘calorie-restriction-mediated’ prevention of neurodegeneration in Caenorhabditis elegans: implications for Parkinson’s disease., Biochem Biophys Res Commun, 41, 306, 10.1016/j.bbrc.2011.08.092 · DOI
- Mouton, 2004, Caloric restriction increases neurotrophic factor levels and attenuates neurochemical and behavioral deficits in a primate model of Parkinson’s disease., Proc Natl Acad Sci USA, 10, 18171, 10.1073/pnas.0405831102 · DOI
- Kanazir, 2007, Dietary restriction modulates alpha-synuclein expression in the aging rat cortex and hippocampus., Synapse, 6, 790, 10.1002/syn.20427 · DOI
- Wong, 2006, Increased lifespan in transgenic Caenorhabditis elegans overexpressing human alpha-synuclein., Exp Gerontol, 4, 871, 10.1016/j.exger.2006.05.005 · DOI
- Hartl, 2018, Pathways of cellular proteostasis in aging and disease., J Cell Biol, 21, 51, 10.1083/jcb.201709072 · DOI
- Kowaltowski, 2011, Aging and calorie restriction modulate yeast redox state, oxidized protein removal, and the ubiquitin-proteasome system., Free Radic Biol Med, 5, 664, 10.1016/j.freeradbiomed.2011.05.035 · DOI
- Prolla, 1999, Gene expression profile of aging and its retardation by caloric restriction., Science, 28, 1390, 10.1126/science.285.5432.1390 · DOI · Paper page
- Hunter, 2009, A conserved ubiquitination pathway determines longevity in response to diet restriction., Nature, 46, 396, 10.1038/nature08130 · DOI
- Karpov, 2008, Rpn4p is a positive and negative transcriptional regulator of the ubiquitin-proteasome system., Mol Biol (Mosk), 4, 518
- Keller, 2005, Alpha-synuclein alters proteasome function, protein synthesis, and stationary phase viability., J Biol Chem, 28, 30009, 10.1074/jbc.M501308200 · DOI
- Lee, 2017, Emerging Paradigm of Crosstalk between Autophagy and the Ubiquitin-Proteasome System., Mol Cells, 4, 897, 10.14348/molcells.2017.0226 · DOI
- Ludovico, 2012, SNCA (α-synuclein)-induced toxicity in yeast cells is dependent on sirtuin 2 (Sir2)-mediated mitophagy., Autophagy, 8, 1494, 10.4161/auto.21275 · DOI
- Tansey, 2010, Combined chemical and genetic approach to inhibit proteolysis by the proteasome., Yeast, 2, 965, 10.1002/yea.1805 · DOI
- Dohmen, 1998, Ump1p is required for proper maturation of the 20S proteasome and becomes its substrate upon completion of the assembly., Cell, 9, 489, 10.1016/S0092-8674(00)80942-3 · DOI
- Varshavsky, 2001, RPN4 is a ligand, substrate, and transcriptional regulator of the 26S proteasome: a negative feedback circuit., Proc Natl Acad Sci USA, 9, 3056, 10.1073/pnas.071022298 · DOI · Paper page
- Vierstra, 2016, Autophagic Turnover of Inactive 26S Proteasomes in Yeast Is Directed by the Ubiquitin Receptor Cue5 and the Hsp42 Chaperone., Cell Reports, 1, 1717, 10.1016/j.celrep.2016.07.015 · DOI
- Hochstrasser, 1996, Autocatalytic subunit processing couples active site formation in the 20S proteasome to completion of assembly., Cell, 8, 961, 10.1016/S0092-8674(00)80171-3 · DOI
- Wolf, 1997, The active sites of the eukaryotic 20 S proteasome and their involvement in subunit precursor processing., J Biol Chem, 27, 25200, 10.1074/jbc.272.40.25200 · DOI
- Harris, 2009, The role of ATF4 stabilization and autophagy in resistance of breast cancer cells treated with Bortezomib., Cancer Res, 6, 4415, 10.1158/0008-5472.CAN-08-2839 · DOI
- Fan, 2010, Macroautophagy and ERK phosphorylation counteract the antiproliferative effect of proteasome inhibitor in gastric cancer cells., Autophagy, 6, 228, 10.4161/auto.6.2.11042 · DOI
- Sagot, 2008, Reversible cytoplasmic localization of the proteasome in quiescent yeast cells., J Cell Biol, 18, 737, 10.1083/jcb.200711154 · DOI
- Enenkel, 2015, Intracellular Dynamics of the Ubiquitin-Proteasome-System., F1000 Res, 4, 367, 10.12688/f1000research.6835.1 · DOI
- Leu, 2016, Differentiated cytoplasmic granule formation in quiescent and non-quiescent cells upon chronological aging., Microb Cell, 3, 109, 10.15698/mic2016.03.484 · DOI
- Enenkel, 2016, Proteasome dynamics between proliferation and quiescence stages of Saccharomyces cerevisiae., Crit Rev Biochem Mol Biol, 5, 497, 10.1080/10409238.2016.1230087 · DOI
- Yedidi, 2017, Ubiquitin orchestrates proteasome dynamics between proliferation and quiescence in yeast., Mol Biol Cell, 2, 2479, 10.1091/mbc.e17-03-0162 · DOI
- Vierstra, 2018, Proteasome storage granules protect proteasomes from autophagic degradation upon carbon starvation., eLife, 7, 7, 10.7554/eLife.34532 · DOI
- Zhang, 2011, An improved method for whole protein extraction from yeast Saccharomyces cerevisiae., Yeast, 2, 795, 10.1002/yea.1905 · DOI
- Klionsky, 2008, Biochemical methods to monitor autophagy-related processes in yeast., Methods Enzymol, 45, 1, 10.1016/S0076-6879(08)03201-1 · DOI
Cited by
Sorted by citations
Guidelines for the use and interpretation of assays for monitoring autophagy (4th edition) 1
Klionsky, D. J., Abdel-Aziz, A. K., Abdelfatah, S., Abdellatif, M., Abdoli, A., Abel, S., Abeliovich, H., Abildgaard, M. H., Abudu, Y. P., Acevedo-Arozena, A., et al. (2021) · Autophagy · doi:10.1080/15548627.2020.1797280 · Cited by 2,897
Self-citation
Metadata
- Authors
- Sampaio-Marques, B., Pereira, H., Santos, A. R., Teixeira, A., & Ludovico, P.
- Affiliations
- Life and Health Sciences Research Institute (ICVS), School of Medicine, University of Minho, Braga, Portugal
- Venue
- Aging
- Publisher
- Impact Journals, LLC
- Published
- 2018-12-07
- Volume
- 10
- Issue
- 12
- Pages
- 3821-3833
- ISSN
- 1945-4589
- PMC
- PMC6326672
- Cited by
- 14
- References
- 7
- Language
- en
About these checks
Registry, retraction, Cites and statistics results are computed, not judged, with one exception: a printed reference that no index lists is read once by a model before it counts as a citation error. Claims are extracted by a model and kept only when their quote appears verbatim in the text; each cited source is then checked, with a model’s help, for whether it says what the claim relies on. Those verdicts can be wrong — read the claim’s quote and the cited source before relying on one.
Statistics and arithmetic are recomputed, not judged.
Confidence bands are shown only for fields calibrated on our annotated test set. None is calibrated yet, so no band is shown.
What counts as a claim ›How we measure confidence ›How we check this ›
Are you an author, or do you see a problem with this page? Request a review
