Cited by 32

The DOI matches its Crossref record; 2 of the 2 references it cites were found in a registry or an index.

The evolutionary pattern of mutations in glioblastoma reveals therapy-mediated selection

Muscat, Andrea M., Wong, Nicholas C., Drummond, Katharine J., Algar, Elizabeth M., Khasraw, Mustafa, Verhaak, Roel, Field, Kathryn, Rosenthal, Mark A., Ashley, David M.·2018·Oncotarget

Overview

The claims and statistics of this paper haven’t been checked yet.

Run the check — free, no account needed. It reads the open-access text and checks the sources it cites.

A few free checks a day · papers already verified open instantly · results are public

Integrity signals

Registry

Crossref · 10.18632/oncotarget.23541

Cites

2 of 2 references verified0 citation errors · 0 not checkable

Statistics

Figures

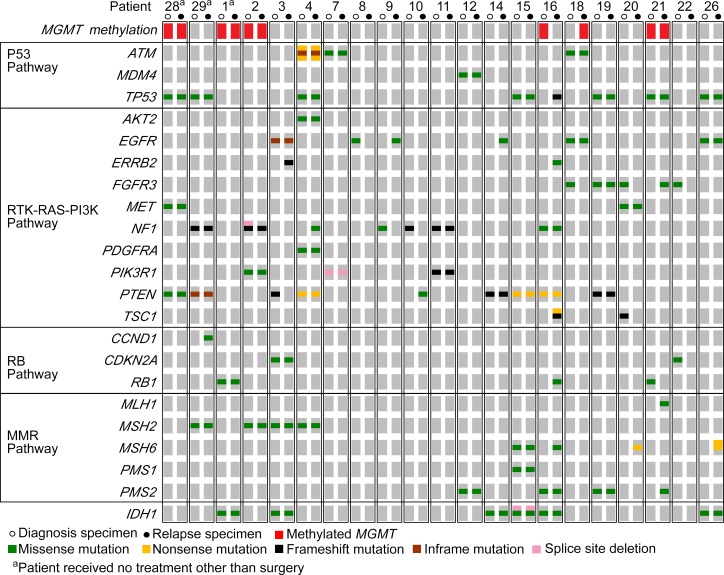
Figure 1 Patterns of mutations in key signaling pathway genes were consistent with previously described traits of primary GBM OncoPrint summarizing the non-synonymous and splice site variants detected by targeted deep sequencing in both diagnostic (open circles) and relapse (closed circles) specimens for each of the 21 patients. Specimens with methylation of MGMT are noted in red.
Figure 1 Patterns of mutations in key signaling pathway genes were consistent with previously described traits of primary GBM OncoPrint summarizing the non-synonymous and splice site variants detected by targeted deep sequencing in both diagnostic (open circles) and relapse (closed circles) specimens for each of the 21 patients. Specimens with methylation of MGMT are noted in red.CC BY · PubMed Central
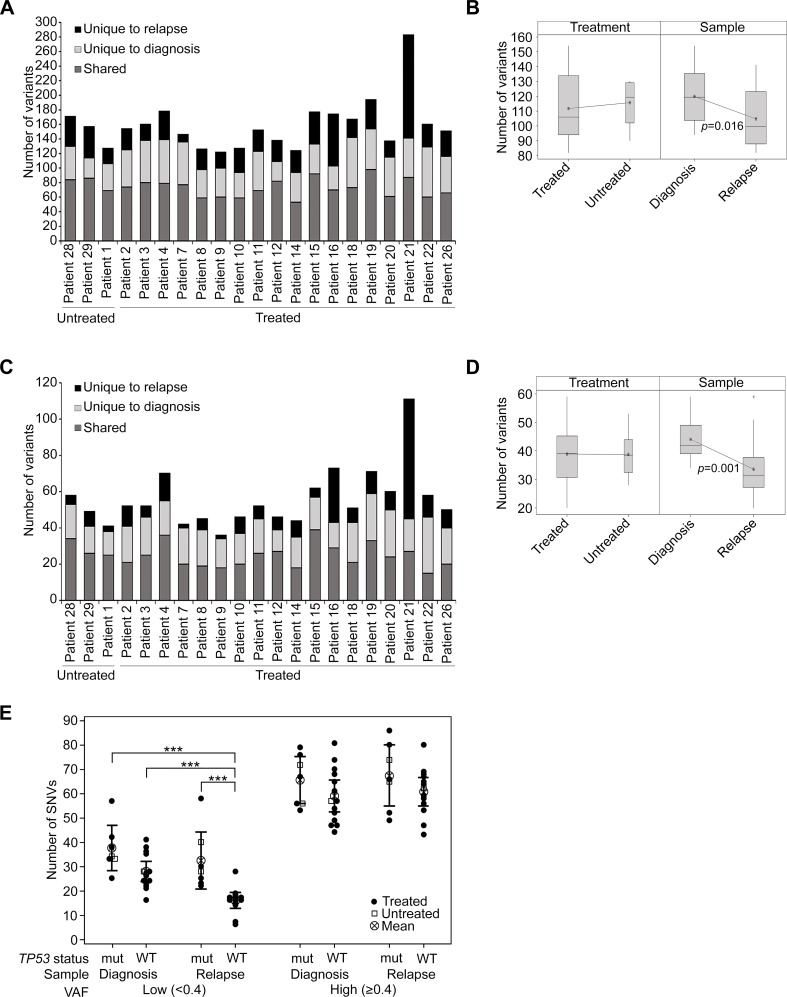
Figure 2 The burden of mutations was not heavily impacted by treatment with RT and TMZ (A) The number of variants detected overall in untreated and treated patients, presented according to the specimen/s in which they were observed. (B) Box plot showing the mean number of variants by treatment or sample type. Patient 21 was excluded as an outlier from this analysis. (C) Coding region variants defined as non-synonymous and splice site mutations, presented as shared or unique to either diagnosis or relapse specimens. (D) Box plot showing the mean number of non-synonymous and splice site variants by treatment (treated vs untreated) or sample type (diagnosis vs relapse). Patient 21 was excluded from this analysis. (E) The presence of SNVs was analyzed according to the TP53 status of tumor specimens. TP53 wildtype tumors (WT) were compared to TP53 mutant tumors (mut), which were defined as those that contained non-synonymous TP53 variants. SNVs were designated low VAF (< 0.4) or high VAF (≥ 0.4) and were tallied separately for the diagnosis and relapse specimens of each patient (excluding the relapse sample of patient 21). Untreated patients are depicted as open squares and treated patients as closed circles. The mean and 95% confidence intervals are also shown. A two-way analysis of variance was performed using a general linear model and p-values for significant differences (p ≤ 0.001) are displayed.
Figure 2 The burden of mutations was not heavily impacted by treatment with RT and TMZ (A) The number of variants detected overall in untreated and treated patients, presented according to the specimen/s in which they were observed. (B) Box plot showing the mean number of variants by treatment or sample type. Patient 21 was excluded as an outlier from this analysis. (C) Coding region variants defined as non-synonymous and splice site mutations, presented as shared or unique to either diagnosis or relapse specimens. (D) Box plot showing the mean number of non-synonymous and splice site variants by treatment (treated vs untreated) or sample type (diagnosis vs relapse). Patient 21 was excluded from this analysis. (E) The presence of SNVs was analyzed according to the TP53 status of tumor specimens. TP53 wildtype tumors (WT) were compared to TP53 mutant tumors (mut), which were defined as those that contained non-synonymous TP53 variants. SNVs were designated low VAF (< 0.4) or high VAF (≥ 0.4) and were tallied separately for the diagnosis and relapse specimens of each patient (excluding the relapse sample of patient 21). Untreated patients are depicted as open squares and treated patients as closed circles. The mean and 95% confidence intervals are also shown. A two-way analysis of variance was performed using a general linear model and p-values for significant differences (p ≤ 0.001) are displayed.CC BY · PubMed Central
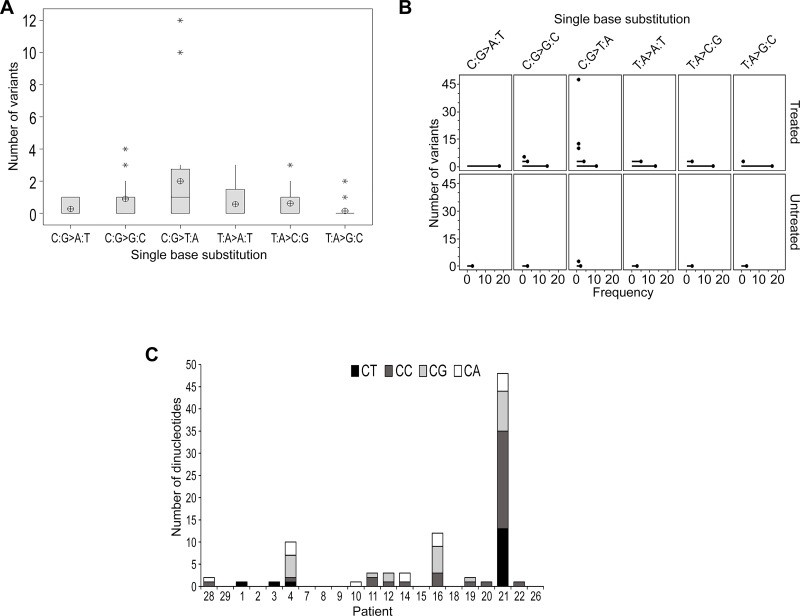
Figure 3 TMZ-induced mutational events were not evident in the majority of samples at recurrence (A) Boxplot representing the distribution of single base substitutions unique to recurrence. The y-axis excludes patient 21 as an outlier with 48 detected variants. The mean is shown as a circular symbol and the asterisks highlight outliers. (B) An individual value plot presenting the spread of single base substitutions occurring uniquely at recurrence and the frequency of patients in which they occur. Substitutions detected in treated patients (including patient 21) and untreated patients are highlighted. (C) Total number of C:G > T:A substitutions and the proportion of each dinucleotide context.
Figure 3 TMZ-induced mutational events were not evident in the majority of samples at recurrence (A) Boxplot representing the distribution of single base substitutions unique to recurrence. The y-axis excludes patient 21 as an outlier with 48 detected variants. The mean is shown as a circular symbol and the asterisks highlight outliers. (B) An individual value plot presenting the spread of single base substitutions occurring uniquely at recurrence and the frequency of patients in which they occur. Substitutions detected in treated patients (including patient 21) and untreated patients are highlighted. (C) Total number of C:G > T:A substitutions and the proportion of each dinucleotide context.CC BY · PubMed Central
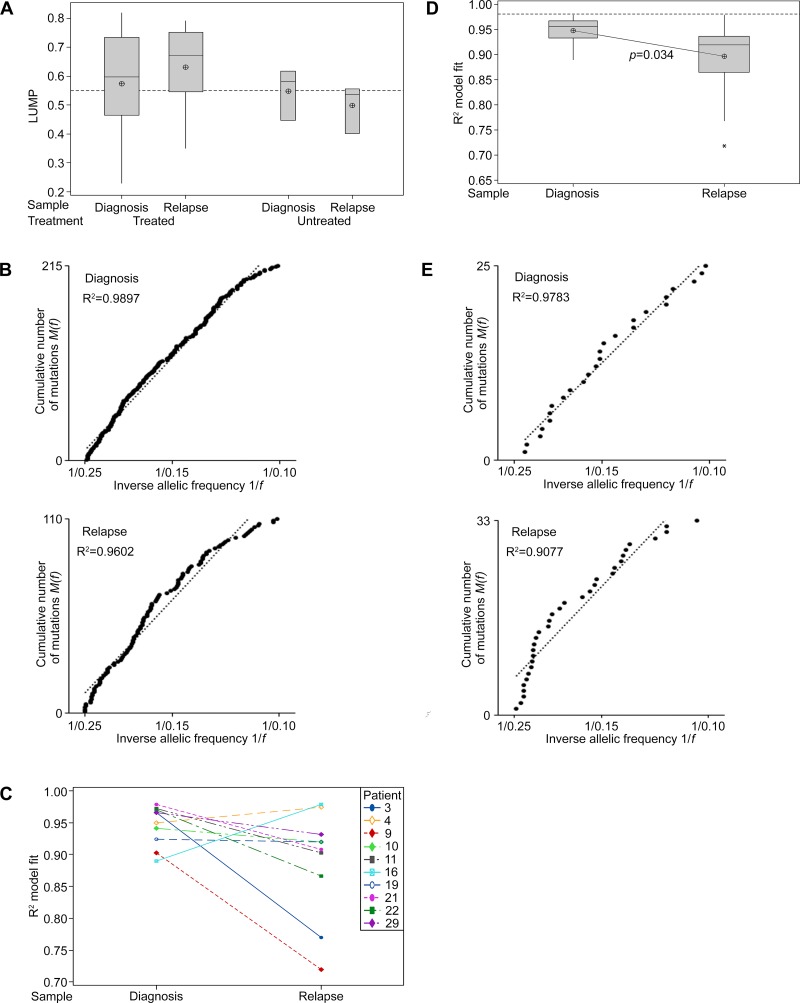
Figure 4 Neutral tumor evolution was evident in untreated GBM, however, a shift away from effectively-neutral subclone dynamics was observed after radiochemotherapy (A) Boxplot presenting the estimated purity of samples determined by LUMP analysis. The line of short dashes indicates the 55% purity threshold for inclusion in neutral evolution analyses. (B) The cumulative distribution M(f) of subclonal mutations in primary tumors prior to therapy analyzed collectively was linear with the inverse of their frequency (1/f) (upper panel) and a shift away from linearity and therefore neutral evolution was evident in tumors after treatment at recurrence (lower panel; excludes patient 21 recurrent sample). A stringent R2 > 0.98 defines neutral evolution in these collective analyses. (C) Subclonal mutations of individual samples were assessed and the variation between tumors at diagnosis and relapse are presented for the 10 paired samples analyzed. R2 goodness-of-fit measures for the neutral evolution model decrease from diagnosis to recurrence in 80% of paired samples from the same patient. (D) Boxplot of the R2 goodness-of-fit for the neutral evolution model. Subclonal mutations of individual samples were assessed and the variation between tumors at diagnosis and relapse are presented for all samples analyzed. The line of short dashes indicates the R2 = 0.98 threshold used to distinguish neutral and non-neutral evolution. A two-way analysis of variance was performed using the general linear model for continuous variables and the corresponding p-value is displayed. (E) The cumulative distribution M(f) of subclonal mutations in the primary tumor (upper panel) and relapse tumor (lower panel) of patient 21. A switch from neutral to non-neutral evolutionary dynamics was apparent between tumors at diagnosis and relapse.
Figure 4 Neutral tumor evolution was evident in untreated GBM, however, a shift away from effectively-neutral subclone dynamics was observed after radiochemotherapy (A) Boxplot presenting the estimated purity of samples determined by LUMP analysis. The line of short dashes indicates the 55% purity threshold for inclusion in neutral evolution analyses. (B) The cumulative distribution M(f) of subclonal mutations in primary tumors prior to therapy analyzed collectively was linear with the inverse of their frequency (1/f) (upper panel) and a shift away from linearity and therefore neutral evolution was evident in tumors after treatment at recurrence (lower panel; excludes patient 21 recurrent sample). A stringent R2 > 0.98 defines neutral evolution in these collective analyses. (C) Subclonal mutations of individual samples were assessed and the variation between tumors at diagnosis and relapse are presented for the 10 paired samples analyzed. R2 goodness-of-fit measures for the neutral evolution model decrease from diagnosis to recurrence in 80% of paired samples from the same patient. (D) Boxplot of the R2 goodness-of-fit for the neutral evolution model. Subclonal mutations of individual samples were assessed and the variation between tumors at diagnosis and relapse are presented for all samples analyzed. The line of short dashes indicates the R2 = 0.98 threshold used to distinguish neutral and non-neutral evolution. A two-way analysis of variance was performed using the general linear model for continuous variables and the corresponding p-value is displayed. (E) The cumulative distribution M(f) of subclonal mutations in the primary tumor (upper panel) and relapse tumor (lower panel) of patient 21. A switch from neutral to non-neutral evolutionary dynamics was apparent between tumors at diagnosis and relapse.CC BY · PubMed Central
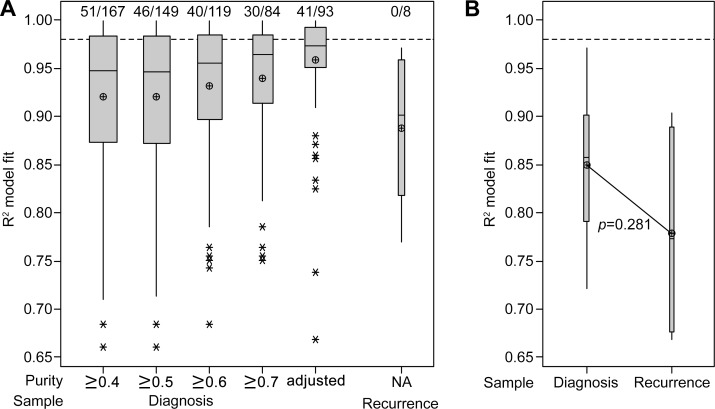
Figure 5 Interrogation of publically available datasets also indicates a stronger fit to the neutral evolution model in untreated primary tumors (A) Boxplot of the R2 goodness-of-fit for the neutral evolution model, presenting data from cohort 2. The minimum purity level of included samples is categorized below the x-axis and the 93 samples which satisfied inclusion criteria for analysis using purity-adjusted VAFs are compared. The line of short dashes indicates the R2 = 0.98 threshold used to distinguish neutral and non-neutral evolution and the number of samples greater than this threshold out of the total number analyzed in each category is indicated above the dashed line. (B) Boxplot of the R2 goodness-of-fit for the neutral evolution model, presenting data from cohort 3. The line of short dashes indicates the R2 = 0.98 threshold. A two-way analysis of variance was performed using the general linear model for continuous variables and the corresponding p-value is displayed.
Figure 5 Interrogation of publically available datasets also indicates a stronger fit to the neutral evolution model in untreated primary tumors (A) Boxplot of the R2 goodness-of-fit for the neutral evolution model, presenting data from cohort 2. The minimum purity level of included samples is categorized below the x-axis and the 93 samples which satisfied inclusion criteria for analysis using purity-adjusted VAFs are compared. The line of short dashes indicates the R2 = 0.98 threshold used to distinguish neutral and non-neutral evolution and the number of samples greater than this threshold out of the total number analyzed in each category is indicated above the dashed line. (B) Boxplot of the R2 goodness-of-fit for the neutral evolution model, presenting data from cohort 3. The line of short dashes indicates the R2 = 0.98 threshold. A two-way analysis of variance was performed using the general linear model for continuous variables and the corresponding p-value is displayed.CC BY · PubMed Central
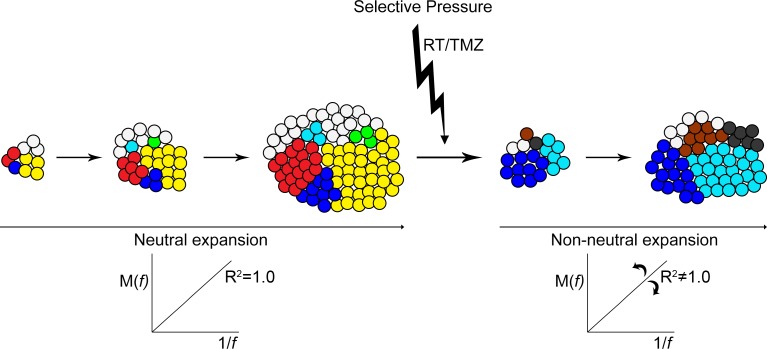
Figure 6 Neutral expansion of variants shifts toward non-neutral modes after therapy Pictorial representation of the neutral expansion of subclones and the linear accumulation of variants M(f) with the inverse of their frequency f. An R2 equal to 1.0 depicts precisely neutral evolutionary dynamics. With the applied pressure of therapy subclonal expansion becomes altered and variable. Some resistant clones and clones with treatment-induced mutations experience a growth advantage and expand rapidly, while other treatment-sensitive clones are reduced or eliminated. The allelic frequency of some variants increases at a more rapid rate while others are decreased. Non-neutral modes of subclonal variant expansion dominate.
Figure 6 Neutral expansion of variants shifts toward non-neutral modes after therapy Pictorial representation of the neutral expansion of subclones and the linear accumulation of variants M(f) with the inverse of their frequency f. An R2 equal to 1.0 depicts precisely neutral evolutionary dynamics. With the applied pressure of therapy subclonal expansion becomes altered and variable. Some resistant clones and clones with treatment-induced mutations experience a growth advantage and expand rapidly, while other treatment-sensitive clones are reduced or eliminated. The allelic frequency of some variants increases at a more rapid rate while others are decreased. Non-neutral modes of subclonal variant expansion dominate.CC BY · PubMed Central

Verification

Claims the paper makes

The claims and statistics of this paper haven’t been checked yet.

Run the check — free, no account needed. It reads the open-access text and checks the sources it cites.

A few free checks a day · papers already verified open instantly · results are public

Claims other papers make about this one

Each is checked against this paper’s own text: does it say what the citing paper says it does?

Self-check

Percentages, sums and reported differences re-computed from the paper’s own numbers.

The self-check needs the paper’s full text.

Citations

Cites

Research works printed but not linked: 31

  1. Wick, 2013, Standards of care for treatment of recurrent glioblastoma--are we there yet?, Neuro Oncol, 15, 4, 10.1093/neuonc/nos273 · DOI
  2. Morokoff, 2016, Reoperation for Recurrent Glioblastoma and Its Association With Survival Benefit, Neurosurgery, 79, 678, 10.1227/NEU.0000000000001338 · DOI
  3. Van Meir, 2015, Whole-genome and multisector exome sequencing of primary and post-treatment glioblastoma reveals patterns of tumor evolution, Genome Res, 25, 316, 10.1101/gr.180612.114 · DOI · Paper page
  4. Park, 2016, Clonal evolution of glioblastoma under therapy, Nat Genet, 48, 768, 10.1038/ng.3590 · DOI · Paper page
  5. Sottoriva, 2016, Identification of neutral tumor evolution across cancer types, Nat Genet, 48, 238, 10.1038/ng.3489 · DOI
  6. Gijtenbeek, 2009, Effects of radiotherapy with concomitant and adjuvant temozolomide versus radiotherapy alone on survival in glioblastoma in a randomised phase III study: 5-year analysis of the EORTC-NCIC trial, Lancet Oncol, 10, 459, 10.1016/S1470-2045(09)70025-7 · DOI
  7. Tabernero, 2015, Molecular and Genomic Alterations in Glioblastoma Multiforme, Am J Pathol, 185, 1820, 10.1016/j.ajpath.2015.02.023 · DOI · Paper page
  8. Ellison, 2016, The 2016 World Health Organization Classification of Tumors of the Central Nervous System: a summary, Acta Neuropathol, 131, 803, 10.1007/s00401-016-1545-1 · DOI
  9. De, 2015, COSMIC: exploring the world's knowledge of somatic mutations in human cancer, Nucleic Acids Res, 43, D805, 10.1093/nar/gku1075 · DOI
  10. Ng, 2009, Predicting the effects of coding non-synonymous variants on protein function using the SIFT algorithm, Nat Protoc, 4, 1073, 10.1038/nprot.2009.86 · DOI · Paper page
  11. Chan, 2012, Predicting the functional effect of amino acid substitutions and indels, PLoS One, 7, e46688, 10.1371/journal.pone.0046688 · DOI · Paper page
  12. Cerutti, 2010, Identification of several novel non-p.R132 IDH1 variants in thyroid carcinomas, Eur J Endocrinol, 163, 747, 10.1530/EJE-10-0473 · DOI
  13. Saito, 2015, Evolution of DNA repair defects during malignant progression of low-grade gliomas after temozolomide treatment, Acta Neuropathol, 129, 597, 10.1007/s00401-015-1403-6 · DOI
  14. Tonn, 2011, Promoter methylation and expression of MGMT and the DNA mismatch repair genes MLH1, MSH2, MSH6 and PMS2 in paired primary and recurrent glioblastomas, Int J Cancer, 129, 659, 10.1002/ijc.26083 · DOI
  15. TCGA Research Network, 2008, Comprehensive genomic characterization defines human glioblastoma genes and core pathways, Nature, 455, 1061, 10.1038/nature07385 · DOI · Paper page
  16. Weiss, 2014, Novel MSH6 mutations in treatment-naive glioblastoma and anaplastic oligodendroglioma contribute to temozolomide resistance independently of MGMT promoter methylation, Clin Cancer Res, 20, 4894, 10.1158/1078-0432.CCR-13-1856 · DOI
  17. Avis, 2006, A hypermutation phenotype and somatic MSH6 mutations in recurrent human malignant gliomas after alkylator chemotherapy, Cancer Res, 66, 3987, 10.1158/0008-5472.CAN-06-0127 · DOI
  18. Butte, 2015, Systematic pan-cancer analysis of tumour purity, Nat Commun, 6, 8971, 10.1038/ncomms9971 · DOI
  19. Wu, 2013, The somatic genomic landscape of glioblastoma, Cell, 155, 462, 10.1016/j.cell.2013.09.034 · DOI · Paper page
  20. Levine, 2012, Absolute quantification of somatic DNA alterations in human cancer, Nat Biotechnol, 30, 413, 10.1038/nbt.2203 · DOI
  21. Joo, 2015, Spatiotemporal Evolution of the Primary Glioblastoma Genome, Cancer Cell, 28, 318, 10.1016/j.ccell.2015.07.013 · DOI
  22. Taylor, 2015, The Amazing and Deadly Glioma Race, Cancer Cell, 28, 275, 10.1016/j.ccell.2015.08.010 · DOI
  23. Sirotkin, 2015, dbSNP: the NCBI database of genetic variation, Nucleic Acids Res, 29, 308
  24. Abecasis, 2015, A global reference for human genetic variation, Nature, 526, 68, 10.1038/nature15393 · DOI · Paper page
  25. Staudt, 2016, Toward a Shared Vision for Cancer Genomic Data, N Engl J Med, 375, 1109, 10.1056/NEJMp1607591 · DOI · Paper page
  26. Manyam, 2016, Molecular Profiling Reveals Biologically Discrete Subsets and Pathways of Progression in Diffuse Glioma, Cell, 164, 550, 10.1016/j.cell.2015.12.028 · DOI
  27. Wong, Li, Tan, Vedururu, Pang, Do, Ellul, Doig, Bell, MacArthur, Fox, Thomas, Fellowes, et al. Sequence artefacts in a prospective series of formalin-fixed tumours tested for mutations in hotspot regions by massively parallel sequencing. BMC Medical Genomics. 2014; p. 7. · DOI
  28. Goldberg, 2012, The cBio cancer genomics portal: an open platform for exploring multidimensional cancer genomics data, Cancer Discov, 2, 401, 10.1158/2159-8290.CD-12-0095 · DOI · Paper page
  29. Schultz, 2013, Integrative analysis of complex cancer genomics and clinical profiles using the cBioPortal, Sci Signal, 6, l1, 10.1126/scisignal.2004088 · DOI · Paper page
  30. Auclair, 2011, Initial genome sequencing and analysis of multiple myeloma, Nature, 471, 467, 10.1038/nature09837 · DOI
  31. Weiler, 2012, Prognostic value of three different methods of MGMT promoter methylation analysis in a prospective trial on newly diagnosed glioblastoma, PLoS One, 7, e33449, 10.1371/journal.pone.0033449 · DOI

Cited by

Sorted by citations

See all 32

Metadata

Authors
Muscat, A. M., Wong, N. C., Drummond, K. J., Algar, E. M., Khasraw, M., Verhaak, R., Field, K., Rosenthal, M. A., & Ashley, D. M.
Affiliations
  • School of Medicine, Deakin University, Geelong, Victoria, Australia
  • Department of Pediatrics, The University of Melbourne, Parkville, Victoria, Australia
  • Department of Neurosurgery, The Royal Melbourne Hospital, Parkville, Victoria, Australia
  • Center for Cancer Research, Hudson Institute of Medical Research, Clayton, Victoria, Australia
  • The Jackson Laboratory for Genomic Medicine, Farmington, Connecticut, USA
  • Department of Medical Oncology, Peter MacCallum Cancer Center, Melbourne, Victoria, Australia
Venue
Oncotarget
Published
2017-12-15
Volume
9
Issue
8
Pages
7844-7858
ISSN
1949-2553
Cited by
32
References
2
Language
en

About these checks

Registry, retraction, Cites and statistics results are computed, not judged, with one exception: a printed reference that no index lists is read once by a model before it counts as a citation error. Claims are extracted by a model and kept only when their quote appears verbatim in the text; each cited source is then checked, with a model’s help, for whether it says what the claim relies on. Those verdicts can be wrong — read the claim’s quote and the cited source before relying on one.

Statistics and arithmetic are recomputed, not judged.

Confidence bands are shown only for fields calibrated on our annotated test set. None is calibrated yet, so no band is shown.

What counts as a claim ›How we measure confidence ›How we check this ›

Are you an author, or do you see a problem with this page? Request a review