Cited by 16

The DOI matches its Crossref record; 1 of the 1 references it cites were found in a registry or an index.

High-throughput drug library screening identifies colchicine as a thyroid cancer inhibitor

Zhang, Le, Yang, Zhaoying, Granieri, Letizia, Pasculescu, Adrian, Datti, Alessandro, Asa, Sylvia L., Xu, Zheli, Ezzat, Shereen·2016·Oncotarget

Overview

The claims and statistics of this paper haven’t been checked yet.

Run the check — free, no account needed. It reads the open-access text and checks the sources it cites.

A few free checks a day · papers already verified open instantly · results are public

Integrity signals

Registry

Crossref · 10.18632/oncotarget.7890

Cites

1 of 1 references verified0 citation errors · 0 not checkable

Statistics

Figures

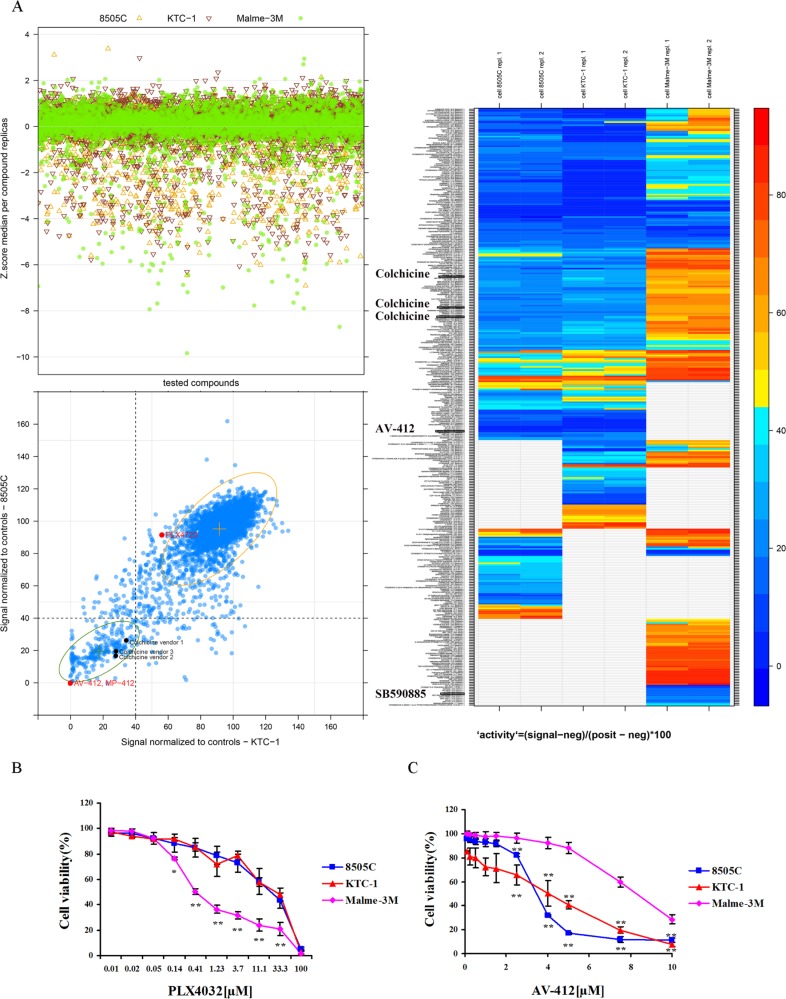
Figure 1 High-throughput drug library screening BRAF-mutant thyroid cancer 8505C and KTC-1 cells and melanoma cells (Malme-3M) were used as biological sources to screen, under high-throughput conditions, a multi-vendor collection of ∼5200 chemical entities with known pharmacological and biological properties. (A) Top left panel shows Z-score values obtained from parallel screens of cells. Bottom left panel displays a comparative chart filled with control-based normalized data resulting from the screen of thyroid cells. Samples with less than or equal to 40% viability are highlighted. Control-based normalization is calculated as follows: 100 (signal-negative control)/(positive control-negative control). PLX4720 is a BRAF inhibitor. A heat map of drug effects on cell viability is shown on the right. Red indicates highest and blue reflects lowest cell viability. AV-412 is an EGF-R inhibitor, and SB590885 is a BRAF inhibitor. (B) The dose-dependent effect of the BRAF inhibitor PLX4032 and (C) The EGF-R inhibitor AV-412 on cell viability after 48 hrs incubation. Results are expressed as a percentage in relation to positive control (100%) treated with vehicle alone, and reported as the means ± SD of three independent experiments performed with four replicates. *p < 0.05; **p < 0.01 comparing melanoma with thyroid cancer cells at each indicated dose.
Figure 1 High-throughput drug library screening BRAF-mutant thyroid cancer 8505C and KTC-1 cells and melanoma cells (Malme-3M) were used as biological sources to screen, under high-throughput conditions, a multi-vendor collection of ∼5200 chemical entities with known pharmacological and biological properties. (A) Top left panel shows Z-score values obtained from parallel screens of cells. Bottom left panel displays a comparative chart filled with control-based normalized data resulting from the screen of thyroid cells. Samples with less than or equal to 40% viability are highlighted. Control-based normalization is calculated as follows: 100 (signal-negative control)/(positive control-negative control). PLX4720 is a BRAF inhibitor. A heat map of drug effects on cell viability is shown on the right. Red indicates highest and blue reflects lowest cell viability. AV-412 is an EGF-R inhibitor, and SB590885 is a BRAF inhibitor. (B) The dose-dependent effect of the BRAF inhibitor PLX4032 and (C) The EGF-R inhibitor AV-412 on cell viability after 48 hrs incubation. Results are expressed as a percentage in relation to positive control (100%) treated with vehicle alone, and reported as the means ± SD of three independent experiments performed with four replicates. *p < 0.05; **p < 0.01 comparing melanoma with thyroid cancer cells at each indicated dose.CC BY · PubMed Central
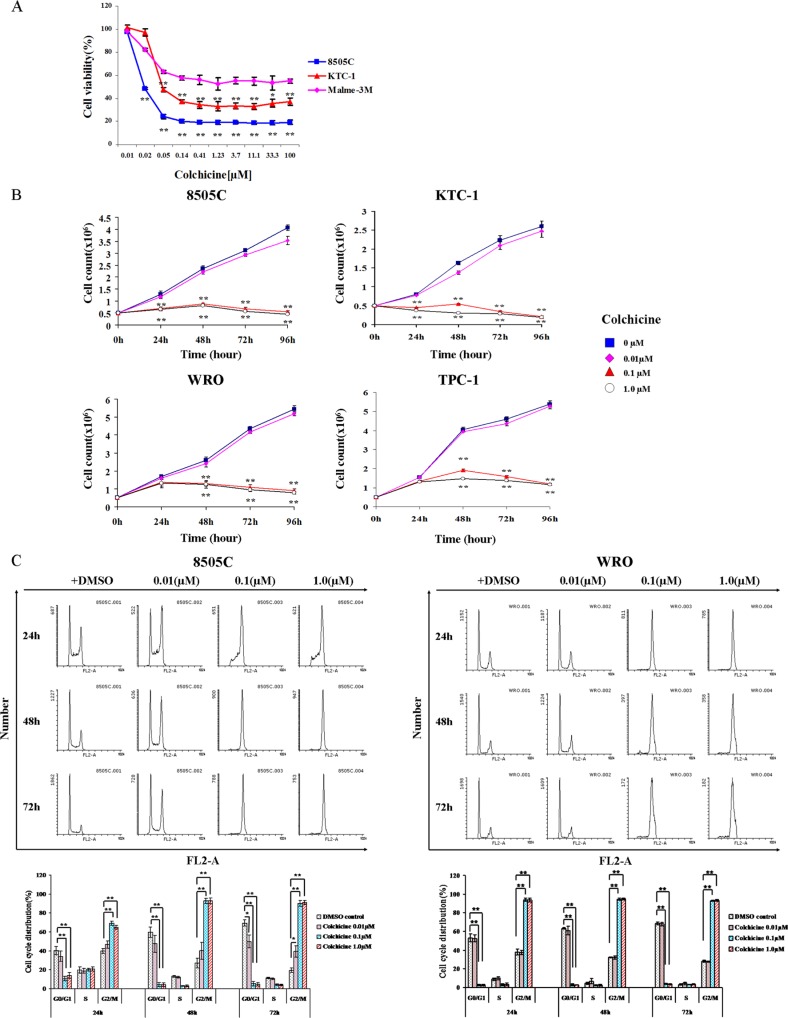
Figure 2 Validation of colchicine as an inhibitor of thyroid cancer cells (A) BRAF-mutant thyroid (8505C and KTC-1) and melanoma (Malme-3M) cells were treated in the presence of increasing doses of colchicine for 48 hrs and assessed for cell viability. *p < 0.05; **p < 0.01 comparing melanoma with thyroid cancer cells at each indicated dose. (B) Cell density was also monitored in two additional thyroid cancer cell lines that are BRAF-WT (WRO and TPC-1). Values are means ± SD of three independent experiments. **p < 0.01 comparing colchicine with DMSO control at the same time point. (C) Cell cycle analysis was monitored by flow cytometry using propidium iodide (PI) dye staining. After 24 hrs of serum starvation, cells were treated with vehicle (DMSO) or colchicine at different doses and times as indicated. Cell cycle profile is estimated by gating histograms generated with the FL2-area variable. The percentage of cells is shown as the mean ± SD of three independent experiments immediately below. *p < 0.05; **p < 0.01 comparing indicated dose of colchicine with DMSO control at the same time point and cell cycle phase.
Figure 2 Validation of colchicine as an inhibitor of thyroid cancer cells (A) BRAF-mutant thyroid (8505C and KTC-1) and melanoma (Malme-3M) cells were treated in the presence of increasing doses of colchicine for 48 hrs and assessed for cell viability. *p < 0.05; **p < 0.01 comparing melanoma with thyroid cancer cells at each indicated dose. (B) Cell density was also monitored in two additional thyroid cancer cell lines that are BRAF-WT (WRO and TPC-1). Values are means ± SD of three independent experiments. **p < 0.01 comparing colchicine with DMSO control at the same time point. (C) Cell cycle analysis was monitored by flow cytometry using propidium iodide (PI) dye staining. After 24 hrs of serum starvation, cells were treated with vehicle (DMSO) or colchicine at different doses and times as indicated. Cell cycle profile is estimated by gating histograms generated with the FL2-area variable. The percentage of cells is shown as the mean ± SD of three independent experiments immediately below. *p < 0.05; **p < 0.01 comparing indicated dose of colchicine with DMSO control at the same time point and cell cycle phase.CC BY · PubMed Central
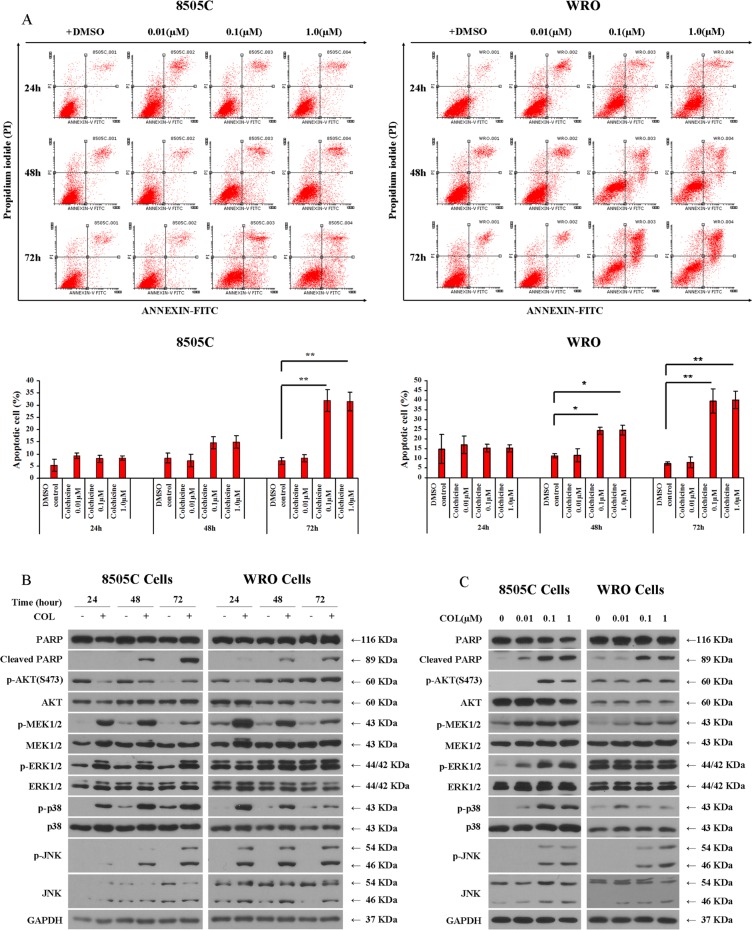
Figure 3 Impact of colchicine on thyroid cancer cell apoptosis (A) After 24 hrs serum starvation, 8505C and WRO cells were incubated with vehicle (DMSO) or colchicine as shown. The apoptotic cell population was detected by Annexin V-FITC and PI staining using flow cytometry. The percentage of apoptotic cells is shown as the mean ± SD of three independent experiments immediately below. (B) 8505C and WRO cells were treated with or without 0.1 μM of colchicine and incubated for different times as shown prior to Western blotting. (C) 8505C and WRO cells were treated for 72 hrs with the indicated doses of colchicine prior to Western blotting. *p < 0.05; **p < 0.01 comparing indicated dose of colchicine with DMSO control at the same time point.
Figure 3 Impact of colchicine on thyroid cancer cell apoptosis (A) After 24 hrs serum starvation, 8505C and WRO cells were incubated with vehicle (DMSO) or colchicine as shown. The apoptotic cell population was detected by Annexin V-FITC and PI staining using flow cytometry. The percentage of apoptotic cells is shown as the mean ± SD of three independent experiments immediately below. (B) 8505C and WRO cells were treated with or without 0.1 μM of colchicine and incubated for different times as shown prior to Western blotting. (C) 8505C and WRO cells were treated for 72 hrs with the indicated doses of colchicine prior to Western blotting. *p < 0.05; **p < 0.01 comparing indicated dose of colchicine with DMSO control at the same time point.CC BY · PubMed Central
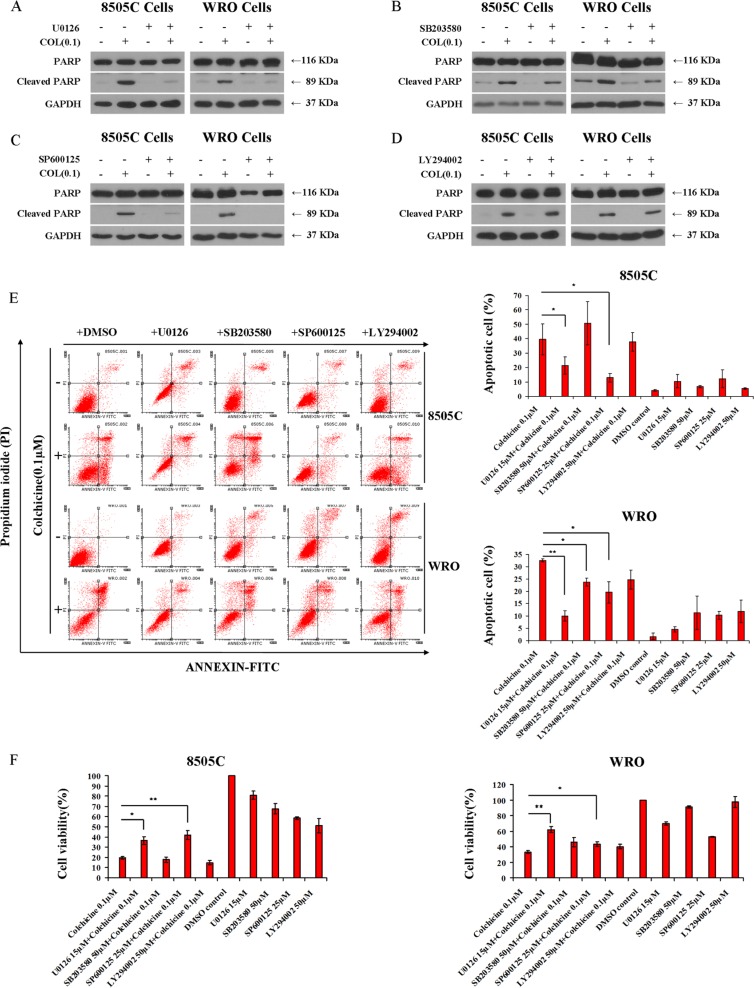
Figure 4 Involvement of MAPK in colchicine-induced thyroid cancer cell apoptosis Western blotting of 8505C and WRO cells to assess PARP cleavage under different treatment conditions. After 24 hrs serum starvation, cells were incubated with vehicle (DMSO), 15 μM of the MEK/ERK1/2 inhibitor U0126 (A), 50 μM of the p38 inhibitor SB203580 (B), 25 μM of the JNK inhibitor SP600125 (C), and 50 μM of the PI3K inhibitor LY294002 (D) in the presence or absence of 0.1 μM of colchicine for 72 hrs. (E) Cells were treated as shown in panels A–D and subjected to flow cytometry analysis for evaluation of Annexin V-FITC and PI staining. Results were interpreted as follows: (Annexin V−, PI− : viable cells); (Annexin V+, PI− : cells undergoing early apoptosis); (Annexin V+, PI+: cells in late apoptosis); and (Annexin V−, PI+: necrotic cells). The percentage of apoptotic cells is shown as the mean ± SD of three independent experiments. (F) Effects of MAPK and PI3K inhibitors on cell viability under the treatment conditions shown. Cell viability was monitored by the Alamar Blue assay. Data are shown as the mean ± SD of three experiments. *p < 0.05; **p < 0.01 comparing colchicine with combination treatments of indicated inhibitors.
Figure 4 Involvement of MAPK in colchicine-induced thyroid cancer cell apoptosis Western blotting of 8505C and WRO cells to assess PARP cleavage under different treatment conditions. After 24 hrs serum starvation, cells were incubated with vehicle (DMSO), 15 μM of the MEK/ERK1/2 inhibitor U0126 (A), 50 μM of the p38 inhibitor SB203580 (B), 25 μM of the JNK inhibitor SP600125 (C), and 50 μM of the PI3K inhibitor LY294002 (D) in the presence or absence of 0.1 μM of colchicine for 72 hrs. (E) Cells were treated as shown in panels A–D and subjected to flow cytometry analysis for evaluation of Annexin V-FITC and PI staining. Results were interpreted as follows: (Annexin V−, PI− : viable cells); (Annexin V+, PI− : cells undergoing early apoptosis); (Annexin V+, PI+: cells in late apoptosis); and (Annexin V−, PI+: necrotic cells). The percentage of apoptotic cells is shown as the mean ± SD of three independent experiments. (F) Effects of MAPK and PI3K inhibitors on cell viability under the treatment conditions shown. Cell viability was monitored by the Alamar Blue assay. Data are shown as the mean ± SD of three experiments. *p < 0.05; **p < 0.01 comparing colchicine with combination treatments of indicated inhibitors.CC BY · PubMed Central
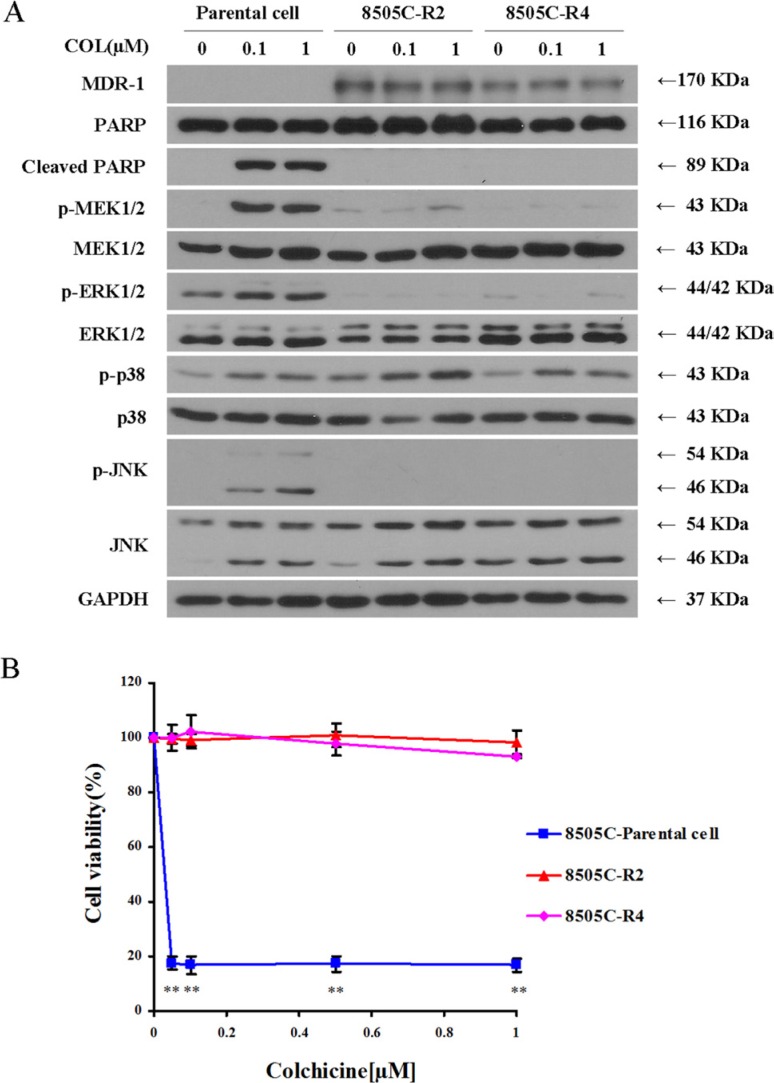
Figure 5 Colchicine–resistant thyroid cancer cells (8505C) show reduced MEK/ERK1/2 and JNK activity (A) Parental 8505C cells and two resistant clones 8505C–R2 and 8505C–R4 were subjected to serum starvation for 24 hrs. Cells were then treated with vehicle (DMSO) or colchicine (0.1 μM and 1 μM) for 72 hrs, and subjected to Western blotting for assessment of MDR-1 expression, MAPK activation, and PARP cleavage. (B) Cell viability by Alamar Blue staining of parental 8505C cells and two resistant clones 8505C–R2 and 8505C–R4 was performed in the presence of increasing concentrations of colchicine incubated for 72 hrs as indicated. The percentage of viable cells is shown as the mean ± SD of three independent experiments. **p < 0.01 comparing parental cells with resistant clones at each indicated dose.
Figure 5 Colchicine–resistant thyroid cancer cells (8505C) show reduced MEK/ERK1/2 and JNK activity (A) Parental 8505C cells and two resistant clones 8505C–R2 and 8505C–R4 were subjected to serum starvation for 24 hrs. Cells were then treated with vehicle (DMSO) or colchicine (0.1 μM and 1 μM) for 72 hrs, and subjected to Western blotting for assessment of MDR-1 expression, MAPK activation, and PARP cleavage. (B) Cell viability by Alamar Blue staining of parental 8505C cells and two resistant clones 8505C–R2 and 8505C–R4 was performed in the presence of increasing concentrations of colchicine incubated for 72 hrs as indicated. The percentage of viable cells is shown as the mean ± SD of three independent experiments. **p < 0.01 comparing parental cells with resistant clones at each indicated dose.CC BY · PubMed Central
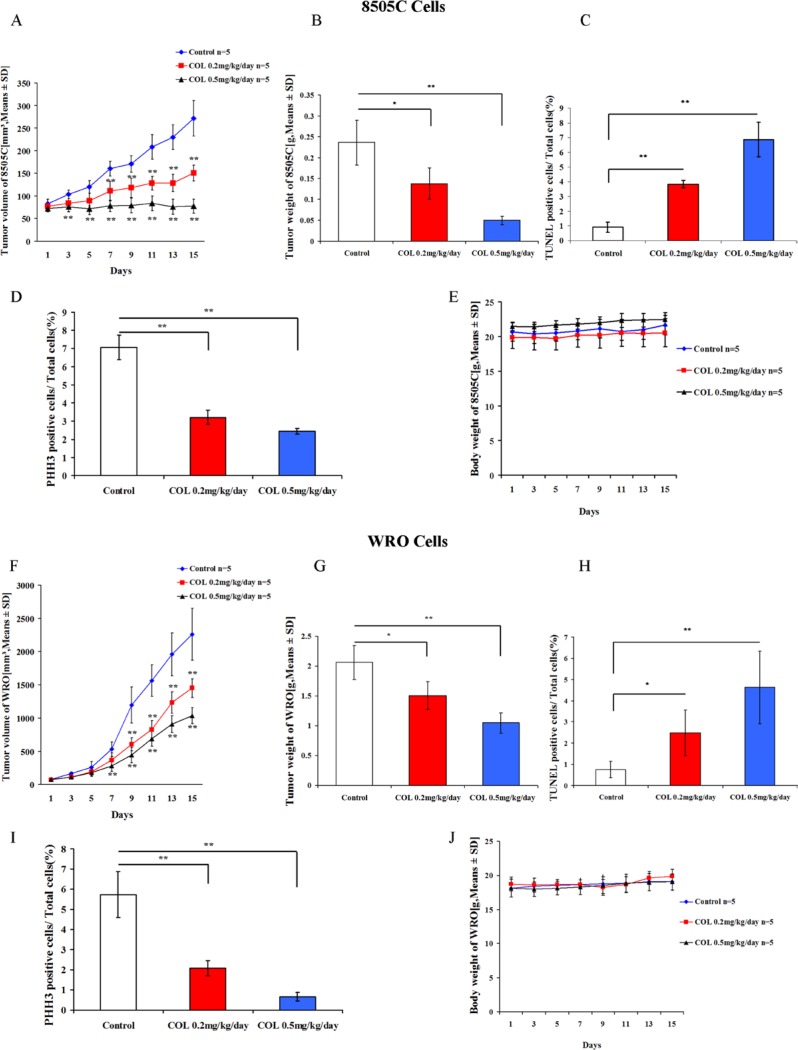
Figure 6 Colchicine activity in thyroid cancer mouse xenografts Five × 106 thyroid cancer 8505C and WRO cells were introduced subcutaneously into female SCID mice. Once a tumor was palpable, animals were treated for two weeks with the indicated doses of colchicine or DMSO vehicle control. Results shown include the following evaluations: Tumor volumes (A, F), tumor weight (B, G), body weight (E, J), TUNEL staining of xenografted tissue to assess apoptosis (C, H), and PHH3 staining to visualize mitotic phase (D, I). Values represent the means ± SD with 5 animals in each experimental group. *p < 0.05; **p < 0.01 comparing colchicine with DMSO control at each indicated dose.
Figure 6 Colchicine activity in thyroid cancer mouse xenografts Five × 106 thyroid cancer 8505C and WRO cells were introduced subcutaneously into female SCID mice. Once a tumor was palpable, animals were treated for two weeks with the indicated doses of colchicine or DMSO vehicle control. Results shown include the following evaluations: Tumor volumes (A, F), tumor weight (B, G), body weight (E, J), TUNEL staining of xenografted tissue to assess apoptosis (C, H), and PHH3 staining to visualize mitotic phase (D, I). Values represent the means ± SD with 5 animals in each experimental group. *p < 0.05; **p < 0.01 comparing colchicine with DMSO control at each indicated dose.CC BY · PubMed Central

Verification

Claims the paper makes

The claims and statistics of this paper haven’t been checked yet.

Run the check — free, no account needed. It reads the open-access text and checks the sources it cites.

A few free checks a day · papers already verified open instantly · results are public

Claims other papers make about this one

Each is checked against this paper’s own text: does it say what the citing paper says it does?

Self-check

Percentages, sums and reported differences re-computed from the paper’s own numbers.

The self-check needs the paper’s full text.

Citations

Cites

Show all 1 references

Research works printed but not linked: 23

  1. Czajkowski, 2015, Novel Approaches to Treatment of Advanced Melanoma: A Review on Targeted Therapy and Immunotherapy, Biomed Res Int, 2015, 851387
  2. Schwartz, 2015, Phase I study of XL281 (BMS-908662), a potent oral RAF kinase inhibitor, in patients with advanced solid tumors, Invest New Drugs, 33, 349, 10.1007/s10637-014-0191-5 · DOI
  3. Cohen, 2015, The discovery and development of sorafenib for the treatment of thyroid cancer, Expert Opin Drug Discov, 10, 427, 10.1517/17460441.2015.1006194 · DOI
  4. Gurski, 2015, Clinical Acquired Resistance to RAF Inhibitor Combinations in BRAF-Mutant Colorectal Cancer through MAPK Pathway Alterations, Cancer Discov, 5, 358, 10.1158/2159-8290.CD-14-1518 · DOI · Paper page
  5. Tetzlaff, 2014, Systematic identification of signaling pathways with potential to confer anticancer drug resistance, Sci Signal, 7, ra121, 10.1126/scisignal.aaa1877 · DOI
  6. Adams, 2015, BRAF inhibitor resistance mediated by the AKT pathway in an oncogenic BRAF mouse melanoma model, Proc Natl Acad Sci U S A, 112, E536, 10.1073/pnas.1418163112 · DOI
  7. Colevas, 2015, Differentiated thyroid cancer: focus on emerging treatments for radioactive iodine-refractory patients, Oncologist, 20, 113, 10.1634/theoncologist.2014-0313 · DOI
  8. Fagin, 2003, High prevalence of BRAF mutations in thyroid cancer: genetic evidence for constitutive activation of the RET/PTC-RAS-BRAF signaling pathway in papillary thyroid carcinoma, Cancer Res, 63, 1454
  9. Asa, 2006, Pathogenetic mechanisms in thyroid follicular-cell neoplasia, Nat Rev Cancer, 6, 292, 10.1038/nrc1836 · DOI
  10. Nucera, 2015, Personalized therapy in patients with anaplastic thyroid cancer: targeting genetic and epigenetic alterations, J Clin Endocrinol Metab, 100, 35, 10.1210/jc.2014-2803 · DOI
  11. Cancer Genome Atlas Research N, 2014, Integrated genomic characterization of papillary thyroid carcinoma, Cell, 159, 676, 10.1016/j.cell.2014.09.050 · DOI
  12. Sobrinho-Simoes, 2014, Prognostic biomarkers in thyroid cancer, Virchows Arch, 464, 333, 10.1007/s00428-013-1521-2 · DOI
  13. Colombo, 2016, Differential Clinicopathological Risk and Prognosis of Major Papillary Thyroid Cancer Variants, J Clin Endocrinol Metab, 101, 264, 10.1210/jc.2015-2917 · DOI
  14. Dhar, 2014, Tubulin inhibitors: a patent survey, Recent Pat Anticancer Drug Discov, 9, 176, 10.2174/15748928113089990042 · DOI
  15. Falchook, 2015, BRAF inhibitors: experience in thyroid cancer and general review of toxicity, Horm Cancer, 6, 21, 10.1007/s12672-014-0207-9 · DOI
  16. Austin, 2008, Quantitative high-throughput screening using a live-cell cAMP assay identifies small-molecule agonists of the TSH receptor, J Biomol Screen, 13, 120, 10.1177/1087057107313786 · DOI
  17. Li, 2015, Dual inhibition of HDAC and EGFR signaling with CUDC-101 induces potent suppression of tumor growth and metastasis in anaplastic thyroid cancer, Oncotarget, 6, 9073, 10.18632/oncotarget.3268 · DOI
  18. Rozanski, 2013, Tubulin-interactive stilbene derivatives as anticancer agents, Cell Mol Biol Lett, 18, 368
  19. Ethiraj, 2015, Tubulins - the target for anticancer therapy, Curr Top Med Chem, 15, 73, 10.2174/1568026615666150112115805 · DOI
  20. Kraus, 2015, Colchicine-Update on mechanisms of action and therapeutic uses, Semin Arthritis Rheum, 45, 341, 10.1016/j.semarthrit.2015.06.013 · DOI
  21. Lin, 2015, S100A8 is a novel therapeutic target for anaplastic thyroid carcinoma, J Clin Endocrinol Metab, 100, E232, 10.1210/jc.2014-2988 · DOI
  22. Chen, 2007, p38 and JNK MAPK, but not ERK1/2 MAPK, play important role in colchicine-induced cortical neurons apoptosis, Eur J Pharmacol, 576, 26, 10.1016/j.ejphar.2007.07.067 · DOI
  23. Pandey, 2014, Novel analogue of colchicine induces selective pro-death autophagy and necrosis in human cancer cells, PLoS One, 9, e87064, 10.1371/journal.pone.0087064 · DOI

Cited by

Sorted by citations

Metadata

Authors
Zhang, L., Yang, Z., Granieri, L., Pasculescu, A., Datti, A., Asa, S. L., Xu, Z., & Ezzat, S.
Affiliations
  • Department of Breast Surgery, China-Japan Union Hospital, Jilin University, Changchun, Jilin, P.R. China
  • SMART Laboratory for High-Throughput Screening Programs, Lunenfeld-Tanenbaum Research Institute at Mount Sinai Hospital, Toronto, ON, Canada
  • Ontario Cancer Institute and The Endocrine Oncology Site Group, Princess Margaret Hospital, University Health Network, Toronto, ON, Canada
Venue
Oncotarget
Published
2016-03-03
Volume
7
Issue
15
Pages
19948-19959
ISSN
1949-2553
Cited by
16
References
1
Language
en

About these checks

Registry, retraction, Cites and statistics results are computed, not judged, with one exception: a printed reference that no index lists is read once by a model before it counts as a citation error. Claims are extracted by a model and kept only when their quote appears verbatim in the text; each cited source is then checked, with a model’s help, for whether it says what the claim relies on. Those verdicts can be wrong — read the claim’s quote and the cited source before relying on one.

Statistics and arithmetic are recomputed, not judged.

Confidence bands are shown only for fields calibrated on our annotated test set. None is calibrated yet, so no band is shown.

What counts as a claim ›How we measure confidence ›How we check this ›

Are you an author, or do you see a problem with this page? Request a review