

The DOI matches its Crossref record; 1 of the 1 references it cites were found in a registry or an index.
TAFPred: Torsion Angle Fluctuations Prediction from Protein Sequences
Open accessPreprint — published as 10.3390/biology12071020 · Paper page
Abstract
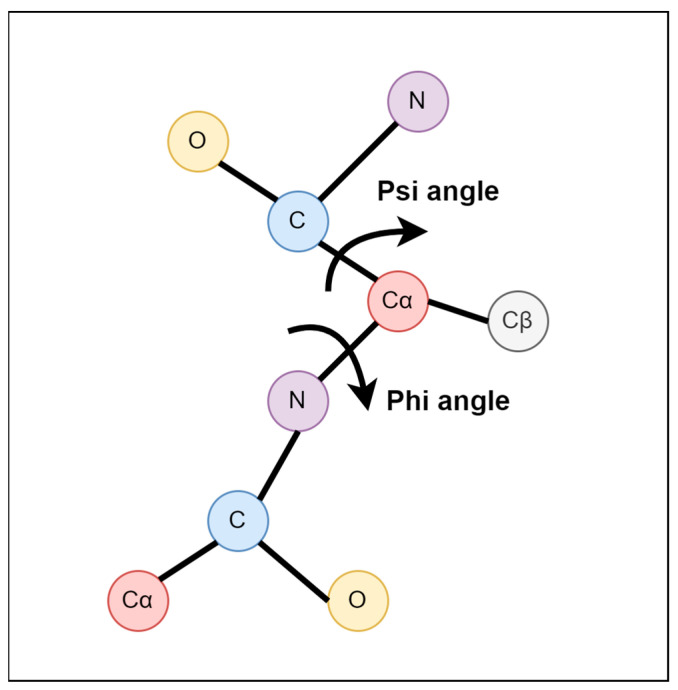
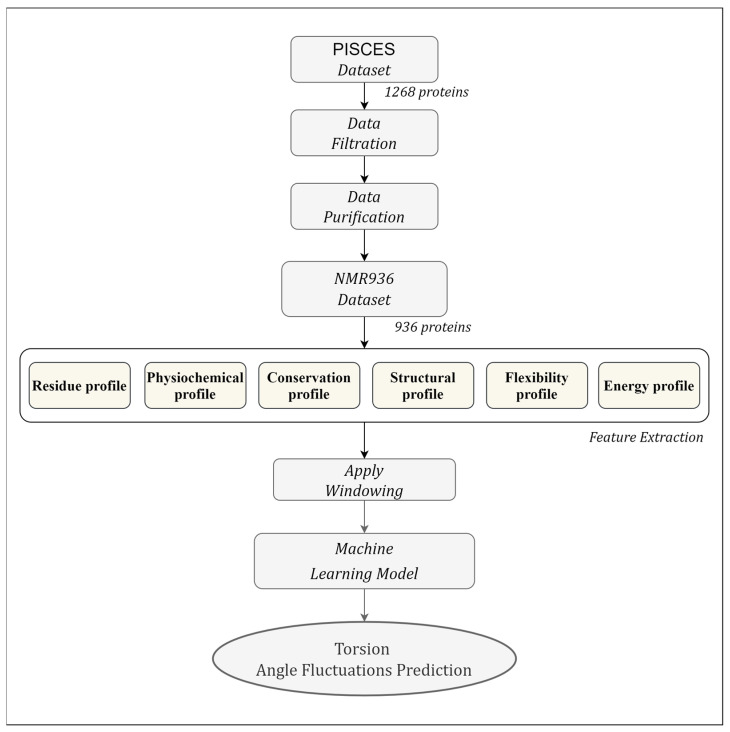
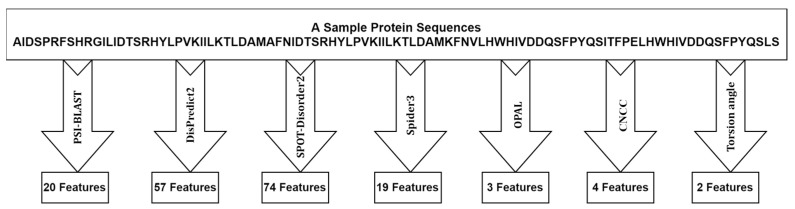
Protein molecules show varying degrees of flexibility throughout their three-dimensional structures. This flexibility is associated with the fluctuation of the torsion angle in proteins. The protein backbone can be defined mainly by two torsion angles, phi (φ) and psi (ψ). The fluctuation of torsion angles is derived from different NMR models’ variations in backbone torsion angles. The angle fluctuations in the cartesian coordinate space are used to characterize the protein’s structural flexibility. Fluctuation of torsion angle is useful in predicting protein function and structure when the torsion angles are used as restraints. This study aims to develop a machine learning method to predict torsion angle fluctuations directly from protein sequences. It explores various useful features such as disorder probability, position-specific scoring matrix profiles, secondary structure probabilities, monograms, bigram, position-specific estimated energy, half-sphere exposures, etc. Likewise, it explores well-known machine learning methods and proposes an optimized Light Gradient Boosting Machine Regressor (LightGBM) method, named TAFPred, to predict torsion angle fluctuations with the selected features. The proposed method achieves ten-fold cross-validated correlation coefficients of 0.746 and 0.737 and mean absolute errors of 0.114 and 0.123 for the angle fluctuation of φ and ψ, respectively, and attains an improvement of 10.08% in MAE, 24.83% in PCC in the phi angle, and 9.93% in MAE, 22.37% in PCC in psi angle compared to the state-of-the-art method proposed by Zhang et al.
Overview
The claims and statistics of this paper haven’t been checked yet.
Run the check — free, no account needed. It reads the open-access text and checks the sources it cites.
Integrity signals
Registry
Cites
Statistics
Figures
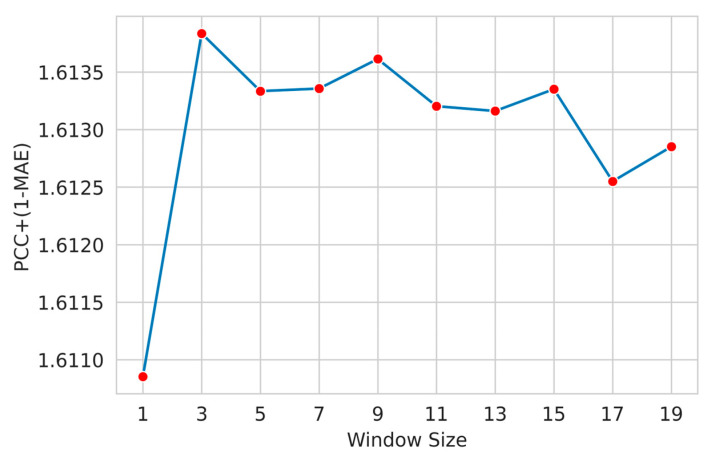
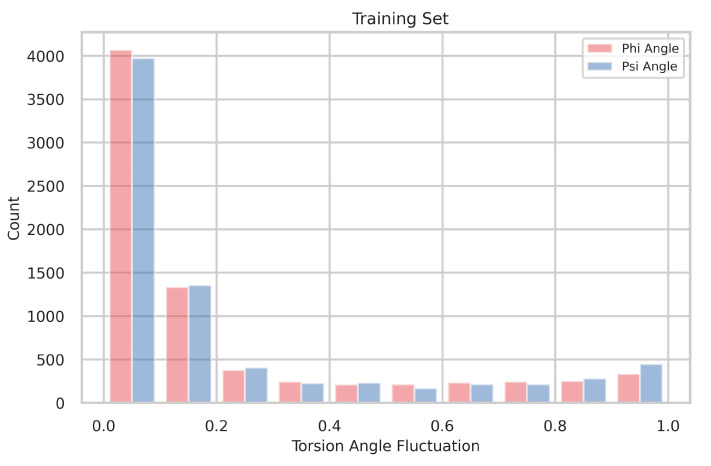
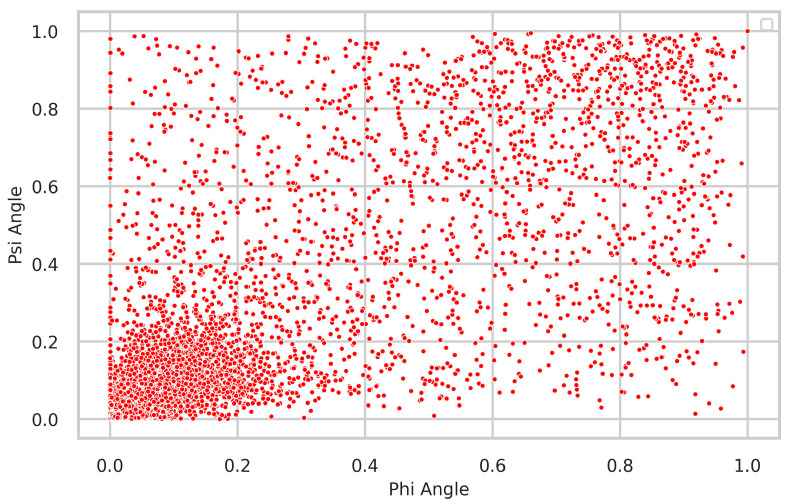
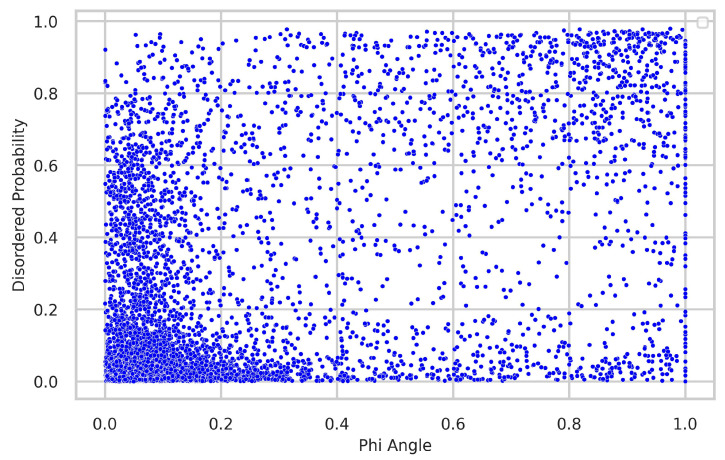
Verification
Claims the paper makes
The claims and statistics of this paper haven’t been checked yet.
Run the check — free, no account needed. It reads the open-access text and checks the sources it cites.
Self-check
Percentages, sums and reported differences re-computed from the paper’s own numbers.
The self-check needs the paper’s full text.
Citations
Cites
Highly accurate protein structure prediction with AlphaFold
Jumper, J., Evans, R., Pritzel, A., Green, T., Figurnov, M., Ronneberger, O., Tunyasuvunakool, K., Bates, R., Žídek, A., Potapenko, A., et al. (2021) · Nature · doi:10.1038/s41586-021-03819-2 · Cited by 43,764
Metadata
- Authors
- Kabir, M. W. U., Alawad, D. M., Mishra, A., & Hoque, M. T.
- Affiliations
- LSU New Orleans (US)
- Texas A&M University – Kingsville (US)
- Corresponding author
- Hoque, Md Tamjidul
- Venue
- Biology
- Publisher
- MDPI AG
- Published
- 2023-07-03
- Volume
- 12
- Issue
- 7
- Pages
- 1020-1020
- ISSN
- 2079-7737 (ISSN-L)
- PMC
- PMC10376102
- OpenAlex
- W4384929351
- Cited by
- 5
- References
- 1
- Citations by year
- 2026: 1 · 2025: 1 · 2024: 3
- FWCI
- 0.44
- Type
- journal article
- Language
- en
- Open access
- gold
- doi.org
- Locations
- Biology (publishedVersion, cc-by)
- Preprints.org (acceptedVersion, cc-by)
- PubMed Central (publishedVersion, cc-by)
- PubMed (publishedVersion)
- DOAJ (DOAJ: Directory of Open Access Journals) (submittedVersion, cc-by-sa)
- Funders
- U.S. Department of Homeland Security (21STSLA00011-01-0)
- Topics
- Life Sciences › Biochemistry, Genetics and Molecular Biology › Molecular Biology › Protein Structure and Dynamics
- Life Sciences › Biochemistry, Genetics and Molecular Biology › Molecular Biology › Machine Learning in Bioinformatics
- Life Sciences › Biochemistry, Genetics and Molecular Biology › Structural Biology › Enzyme Structure and Function
- Keywords
- phi and psi angles, protein flexibility, sequence-based prediction, LightGBM regression
About these checks
Registry, retraction, Cites and statistics results are computed, not judged, with one exception: a printed reference that no index lists is read once by a model before it counts as a citation error. Claims are extracted by a model and kept only when their quote appears verbatim in the text; each cited source is then checked, with a model’s help, for whether it says what the claim relies on. Those verdicts can be wrong — read the claim’s quote and the cited source before relying on one.
Statistics and arithmetic are recomputed, not judged.
Confidence bands are shown only for fields calibrated on our annotated test set. None is calibrated yet, so no band is shown.
What counts as a claim ›How we measure confidence ›How we check this ›
Are you an author, or do you see a problem with this page? Request a review
