PreprintCited by 22Microbial Natural Products and BiosynthesisMicrobial Metabolic Engineering and BioproductionEnzyme Catalysis and Immobilization

The DOI matches its Crossref record; 1 of the 1 references it cites were found in a registry or an index.

Biosensor Guided Polyketide Synthase Engineering for Optimization of Domain Exchange Boundaries

Open access

Preprint — published as 10.1038/s41467-023-40464-x · Paper page

Abstract

Type I modular polyketide synthases (PKSs) are multi-domain enzymes functioning like assembly lines. Many engineering attempts have been made for the last three decades to replace, delete and insert new functional domains into PKSs to produce novel molecules. However, the resulting PKS hybrids typically have reduced catalytic activities and are often insoluble due to misfolding. Here, we have developed a fluorescence-based biosensor method for detecting engineered PKSs with high solubility. The biosensor has been used to sort through PKS hybrids that had acyltransferase (AT) domains from other PKSs exchanged for the native AT with randomly assigned linker junctions. Importantly, we observed a significant correlation between activity and solubility. Evaluation of highly soluble mutants in vitro revealed new boundaries for AT domain exchanges that give a wild-type level of catalytic activity. Together, we have successfully developed an experimentally validated high-throughput method to efficiently screen active engineered PKSs that produce target molecules.

Overview

The claims and statistics of this paper haven’t been checked yet.

Run the check — free, no account needed. It reads the open-access text and checks the sources it cites.

A few free checks a day · papers already verified open instantly · results are public

Integrity signals

Registry

Crossref · 10.21203/rs.3.rs-1528836/v1

Cites

1 of 1 references verified0 citation errors · 0 not checkable

Statistics

Figures

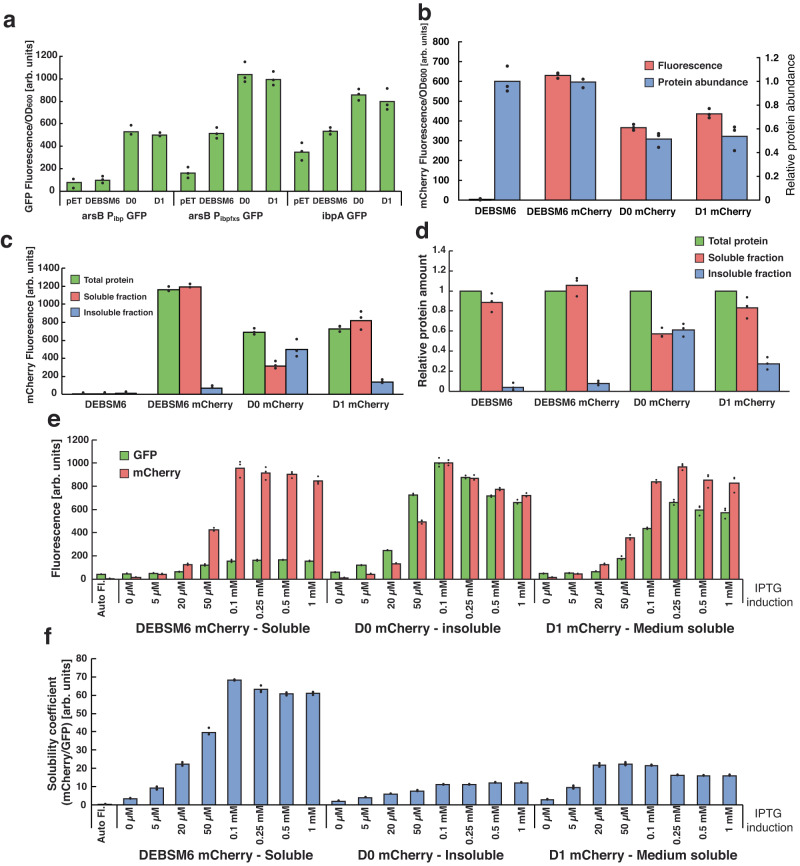
Fig. 1 Activity of misfolded protein biosensor and mCherry fusion proteins. a GFP fluorescence of E. coli biosensor strains expressing PKSs with variable solubilities. pET = pET28a (empty vector control). b Fluorescence of mCherry tagged PKSs (left y-axis) and SDS-PAGE quantified abundance of the proteins relative to DEBSM6 amount (right y-axis). (c) mCherry fluorescence and (d) SDS-PAGE quantification of PKS proteins in different protein fractions of lysed cells, relative to “Total protein” for each replicate. Cells were induced with 250 µM IPTG in (a–d). e Fluorescence of ΔarsB::Pibp GFP strain expressing mCherry tagged PKSs. f Same results as 1e with a simplified “solubility coefficient”: the ratio of the expressed protein (mCherry fluorescence) over activation of insolubility biosensor (GFP fluorescence). Data is presented as mean values of three biological replicates, dots are individual data points. In (a–c) fluorescence was measured using a microplate spectrophotometer, whereas in (e) fluorescence was measured using flow cytometry. Auto Fl = auto fluorescence, arb. units = arbitrary units. Source data are provided as a Source Data file.
Fig. 1 Activity of misfolded protein biosensor and mCherry fusion proteins. a GFP fluorescence of E. coli biosensor strains expressing PKSs with variable solubilities. pET = pET28a (empty vector control). b Fluorescence of mCherry tagged PKSs (left y-axis) and SDS-PAGE quantified abundance of the proteins relative to DEBSM6 amount (right y-axis). (c) mCherry fluorescence and (d) SDS-PAGE quantification of PKS proteins in different protein fractions of lysed cells, relative to “Total protein” for each replicate. Cells were induced with 250 µM IPTG in (a–d). e Fluorescence of ΔarsB::Pibp GFP strain expressing mCherry tagged PKSs. f Same results as 1e with a simplified “solubility coefficient”: the ratio of the expressed protein (mCherry fluorescence) over activation of insolubility biosensor (GFP fluorescence). Data is presented as mean values of three biological replicates, dots are individual data points. In (a–c) fluorescence was measured using a microplate spectrophotometer, whereas in (e) fluorescence was measured using flow cytometry. Auto Fl = auto fluorescence, arb. units = arbitrary units. Source data are provided as a Source Data file.CC BY · PubMed Central
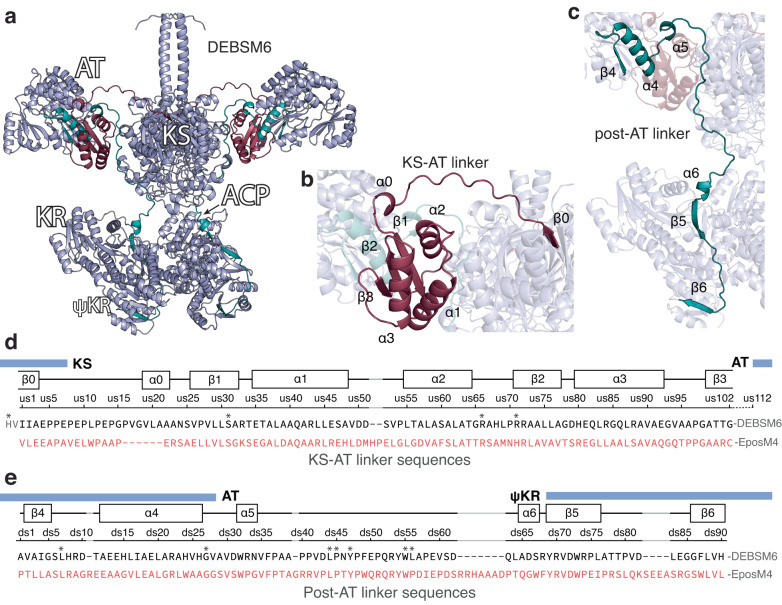
Fig. 2 Predicted structure and sequence of DEBSM6 and KS-AT and post-AT linker. a AlphaFold structure prediction of homodimeric DEBSM6 without TE, (b) a highlighted structure of the KS-AT linker in dark red, and (c) the post-AT linker in teal. The regions highlighted are the sequences selected for the junction library. d Alignment of the region selected for the junction library of DEBSM6 and EpoM4 KS-AT and (e) post-AT linker with secondary structure elements predicted by AlphaFold. Domain boundaries marked with blue boxes were predicted using an online tool49, except the start of ψKR which was placed at the beginning of β5. Each junction position in KS-AT linker is sequentially named us1-102 and post-AT junctions called ds1-90. Highly conserved residues are marked with asterisks. DEBSM6 KS-AT linker sequence starts with HV to denote where the conserved GTNAH sequence is positioned. Gaps in alignments are marked in grey. For reference, the position of the first amino acid in the KS-AT sequence is I1908 for DEBSM6 and V1948 for EpoM4 and in the post-AT linker, the first position is A2301 and P2345, respectively.
Fig. 2 Predicted structure and sequence of DEBSM6 and KS-AT and post-AT linker. a AlphaFold structure prediction of homodimeric DEBSM6 without TE, (b) a highlighted structure of the KS-AT linker in dark red, and (c) the post-AT linker in teal. The regions highlighted are the sequences selected for the junction library. d Alignment of the region selected for the junction library of DEBSM6 and EpoM4 KS-AT and (e) post-AT linker with secondary structure elements predicted by AlphaFold. Domain boundaries marked with blue boxes were predicted using an online tool49, except the start of ψKR which was placed at the beginning of β5. Each junction position in KS-AT linker is sequentially named us1-102 and post-AT junctions called ds1-90. Highly conserved residues are marked with asterisks. DEBSM6 KS-AT linker sequence starts with HV to denote where the conserved GTNAH sequence is positioned. Gaps in alignments are marked in grey. For reference, the position of the first amino acid in the KS-AT sequence is I1908 for DEBSM6 and V1948 for EpoM4 and in the post-AT linker, the first position is A2301 and P2345, respectively.CC BY · PubMed Central
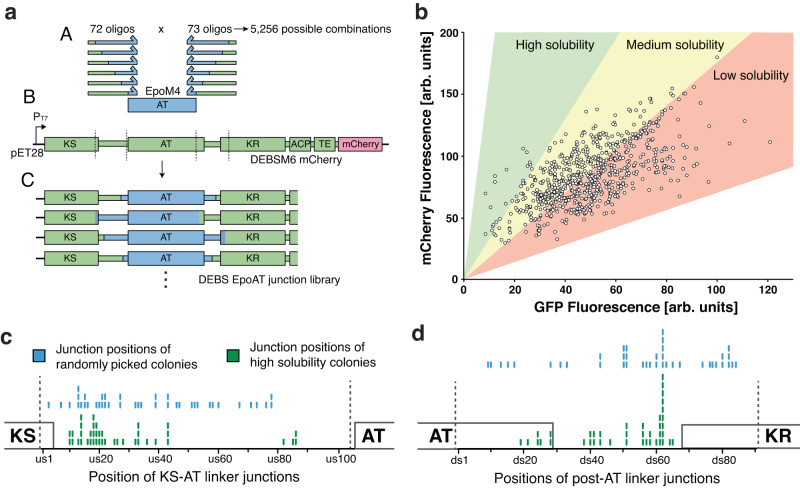
Fig. 3 Creation and measurement of randomized junction library. a Strategy for creating junction library: (A) Pooled libraries of oligos, that each has the junction (where green DEBSM6 sequence and blue EpoAT sequence meet) positioned at a different place in the linker region, amplifies EpoM4 AT with PCR and are inserted into (B) DEBSM6 mCherry with the native AT excised. The resulting library (C) consists of a randomized upstream and downstream junction, with 5256 possible combinations. b Fluorescence measurement of junction library in ΔarsB::Pibp GFP strain using flow cytometry. Each dot represents one measured colony. Colored areas are estimations where differently soluble variants would appear. c,d Comparing junction positions between randomly picked colonies (blue sticks) with high solubility colonies (green sticks) in the KS-AT linker (c) and in the post-AT linker (d). Dotted line denotes selected linker region. Certain junction positions (e.g. ds62) were overrepresented due to how the library was designed: An alignment of DEBSM6-EpoM4 was used to decide junctions. Where there are gaps in the alignment (see position ds62 in Fig. 2e), the same start position of DEBSM6 was used for several end positions of EpoM4. This led to 8 unique variants all sharing ds62 as a junction. Source data are provided as a Source Data file. Arb. units = arbitrary units.
Fig. 3 Creation and measurement of randomized junction library. a Strategy for creating junction library: (A) Pooled libraries of oligos, that each has the junction (where green DEBSM6 sequence and blue EpoAT sequence meet) positioned at a different place in the linker region, amplifies EpoM4 AT with PCR and are inserted into (B) DEBSM6 mCherry with the native AT excised. The resulting library (C) consists of a randomized upstream and downstream junction, with 5256 possible combinations. b Fluorescence measurement of junction library in ΔarsB::Pibp GFP strain using flow cytometry. Each dot represents one measured colony. Colored areas are estimations where differently soluble variants would appear. c,d Comparing junction positions between randomly picked colonies (blue sticks) with high solubility colonies (green sticks) in the KS-AT linker (c) and in the post-AT linker (d). Dotted line denotes selected linker region. Certain junction positions (e.g. ds62) were overrepresented due to how the library was designed: An alignment of DEBSM6-EpoM4 was used to decide junctions. Where there are gaps in the alignment (see position ds62 in Fig. 2e), the same start position of DEBSM6 was used for several end positions of EpoM4. This led to 8 unique variants all sharing ds62 as a junction. Source data are provided as a Source Data file. Arb. units = arbitrary units.CC BY · PubMed Central
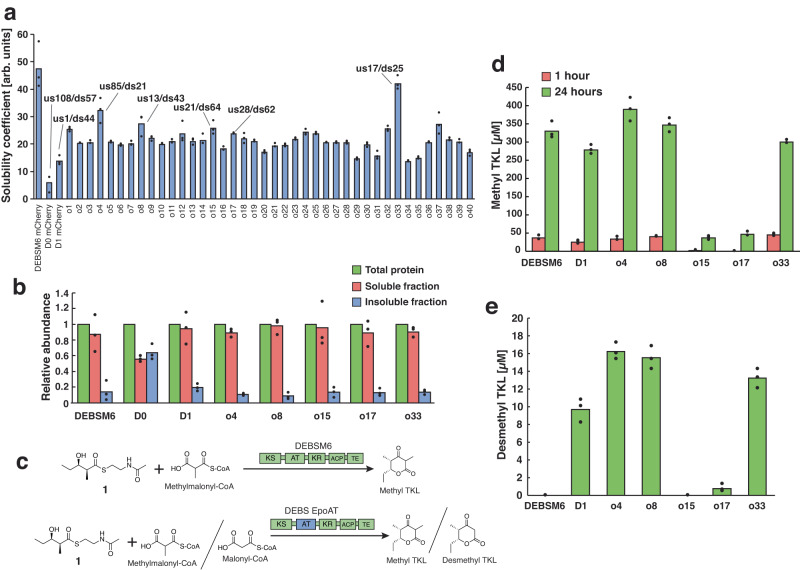
Fig. 4 Solubility and in vitro productivity of high solubility library variants. a Solubility measurement using ΔarsB::Pibp GFP biosensor strain of 40 high solubility colonies, a subset of which have their junction positions marked and were selected for (b) SDS-PAGE quantification of PKS abundance in different protein fractions. (c) In vitro reaction scheme with the synthetic starter 1 and methyl- or malonyl-CoA as substrate. DESBM6 AT natively accepts methylmalonyl-CoA while EpoM4 AT can accept both methyl- and malonyl-CoA. In vitro production of methyl TKL after 1 and 24 hours (d) and desmethyl TKL after 24 hours (e). DEBSM6 is the parental PKS, D1 is included as a reference to what is currently known as the optimal junctions for domain exchange. D0 was excluded due to it already been shown to be inactive8. All strains were induced with 250 µM IPTG. Data is presented as mean values of three biological replicates, dots are individual data points. Arb. units = arbitrary units. Source data are provided as a Source Data file.
Fig. 4 Solubility and in vitro productivity of high solubility library variants. a Solubility measurement using ΔarsB::Pibp GFP biosensor strain of 40 high solubility colonies, a subset of which have their junction positions marked and were selected for (b) SDS-PAGE quantification of PKS abundance in different protein fractions. (c) In vitro reaction scheme with the synthetic starter 1 and methyl- or malonyl-CoA as substrate. DESBM6 AT natively accepts methylmalonyl-CoA while EpoM4 AT can accept both methyl- and malonyl-CoA. In vitro production of methyl TKL after 1 and 24 hours (d) and desmethyl TKL after 24 hours (e). DEBSM6 is the parental PKS, D1 is included as a reference to what is currently known as the optimal junctions for domain exchange. D0 was excluded due to it already been shown to be inactive8. All strains were induced with 250 µM IPTG. Data is presented as mean values of three biological replicates, dots are individual data points. Arb. units = arbitrary units. Source data are provided as a Source Data file.CC BY · PubMed Central
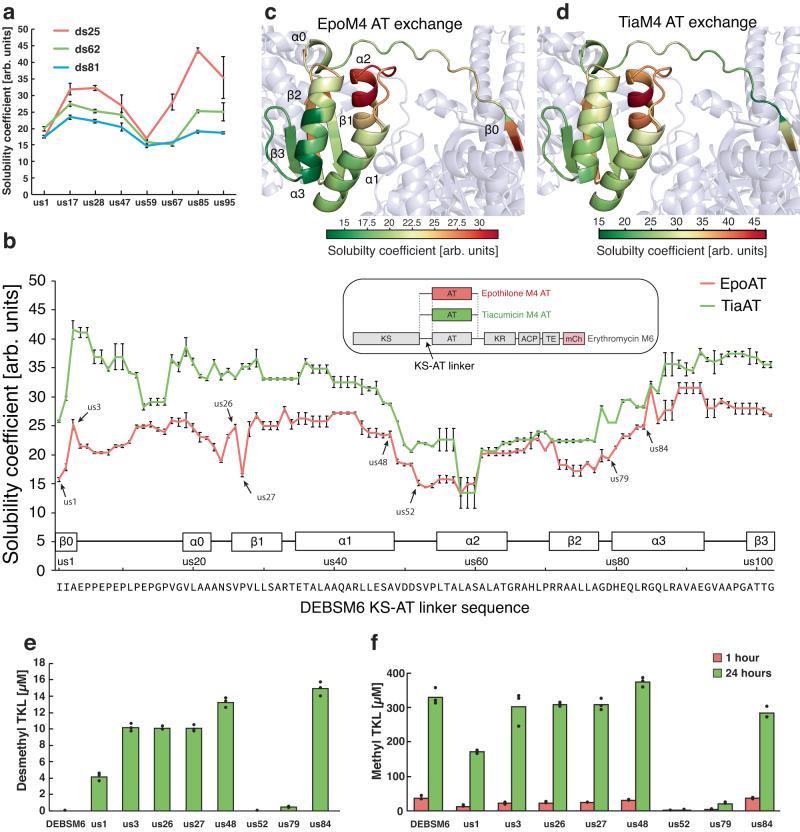
Fig. 5 Effect of KS-AT linker junction positions on solubility and product formation. a Testing synergy between KS-AT and post-AT linker junctions. The solubility coefficient was measured using the ΔarsB::Pibp GFP strain harboring DEBSM6 mCherry engineered with EpoM4 AT with different junction combinations. The color of the lines indicates the position of the post-AT junction, while the x-axis labels indicate the position of the KS-AT junction. b KS-AT junction effect on solubility coefficient measured using ΔarsB::Pibp GFP strain harboring DEBSM6 mCherry engineered with EpoM4 AT or TiaM4 AT with downstream junction at ds25. Sample pairs tested for in vitro production in (e) and (f) are marked with an arrow. Data points from neighboring junction positions that give identical polypeptide sequence due to homology between the parental PKS sequence and exchanged AT sequences are repeated. For reference, the DEBSM6 mCherry solubility coefficient was 71.1 ± 0.5, and its expression was induced with 250 µM IPTG. c, d Solubility data from (b) visualized on predicted protein structure of DEBSM6 engineered with EpoM4 AT (c) or TiaM4 AT (d). e, f In vitro production of desmethyl TKL (e) and methyl TKL (f) of variant pairs of DEBSM6 with EpoM4 AT. Reactions were sampled at 1 hour (red bars) and 24 hours (green bars). Data is presented as mean values of three biological replicates, dots are individual data points. Arb. units = arbitrary units. Source data are provided as a Source Data file.
Fig. 5 Effect of KS-AT linker junction positions on solubility and product formation. a Testing synergy between KS-AT and post-AT linker junctions. The solubility coefficient was measured using the ΔarsB::Pibp GFP strain harboring DEBSM6 mCherry engineered with EpoM4 AT with different junction combinations. The color of the lines indicates the position of the post-AT junction, while the x-axis labels indicate the position of the KS-AT junction. b KS-AT junction effect on solubility coefficient measured using ΔarsB::Pibp GFP strain harboring DEBSM6 mCherry engineered with EpoM4 AT or TiaM4 AT with downstream junction at ds25. Sample pairs tested for in vitro production in (e) and (f) are marked with an arrow. Data points from neighboring junction positions that give identical polypeptide sequence due to homology between the parental PKS sequence and exchanged AT sequences are repeated. For reference, the DEBSM6 mCherry solubility coefficient was 71.1 ± 0.5, and its expression was induced with 250 µM IPTG. c, d Solubility data from (b) visualized on predicted protein structure of DEBSM6 engineered with EpoM4 AT (c) or TiaM4 AT (d). e, f In vitro production of desmethyl TKL (e) and methyl TKL (f) of variant pairs of DEBSM6 with EpoM4 AT. Reactions were sampled at 1 hour (red bars) and 24 hours (green bars). Data is presented as mean values of three biological replicates, dots are individual data points. Arb. units = arbitrary units. Source data are provided as a Source Data file.CC BY · PubMed Central

Verification

Claims the paper makes

The claims and statistics of this paper haven’t been checked yet.

Run the check — free, no account needed. It reads the open-access text and checks the sources it cites.

A few free checks a day · papers already verified open instantly · results are public

Self-check

Percentages, sums and reported differences re-computed from the paper’s own numbers.

The self-check needs the paper’s full text.

Citations

Cites

Metadata

Authors
Englund, E., Schmidt, M., Nava, A., Dan, Q., Katz, L., Yuzawa, S., & Keasling, J.
Affiliations
  • Science for Life Laboratory (SE)
  • Lawrence Berkeley National Laboratory (US)
  • Joint BioEnergy Institute (US)
Corresponding author
Keasling, Jay
Venue
Nature Communications
Published
2022-04-19
Volume
14
Issue
1
Pages
4871-4871
ISSN
2041-1723 (ISSN-L)
OpenAlex
W4385780829
Cited by
22
References
1
Citations by year
2026: 8 · 2025: 9 · 2024: 4 · 2023: 1
FWCI
3.41
Type
journal article
Language
en
Open access
Locations
  • Nature Communications (publishedVersion, cc-by)
  • Research Square (acceptedVersion, cc-by)
  • PubMed Central (publishedVersion, cc-by)
  • PubMed (publishedVersion)
  • RWTH Publications (RWTH Aachen) (publishedVersion, other-oa)
  • eScholarship (California Digital Library) (submittedVersion, cc-by)
  • OSTI OAI (U.S. Department of Energy Office of Scientific and Technical Information) (submittedVersion, cc-by)
  • RePEc: Research Papers in Economics (submittedVersion)
  • DOAJ (DOAJ: Directory of Open Access Journals) (submittedVersion, cc-by-sa)
  • Technical University of Denmark, DTU Orbit (Technical University of Denmark, DTU) (submittedVersion, cc-by)
  • RWTH Publications (RWTH Aachen)
Funders
  • National Science Foundation (DEAC02-05CH11231, 2018253421, 2036849)
  • U.S. Department of Energy (-AC02-05CH11231, Contract No. DE-AC02-05-CH11231, 107514, 05CH11231, No. DE-AC02-05-CH11231, DE AC02 05CH11231, 2018253421, DE-AC02-)
  • Svenska Forskningsrådet Formas (2017-00335)
  • Office of Science (No. DE-AC02- 05-CH11231, 107514, DEAC02–05CH11231, AC02-05CH11231, DE-AC02, Contract No. DE-AC02-05CH11231)
  • Basic Energy Sciences (DE-AC02, Contract No. DE-AC02-05-CH11231, 05CH11231, DE-AC02-05CH11231., 107514, No. DE-AC02-05-CH11231, AC02–05CH11231)
  • Advanced Scientific Computing Research (DE-AC02-05CH11231, AC02-05CH11231, Contract No. DE-AC02-05CH11231)
  • Biological and Environmental Research (05CH11231, No. DE-AC02-05CH11231, DE-AC02 − 05CH11231, Contract No. DE-AC02-05CH11231, AC02-05CH11231)
  • Lawrence Berkeley National Laboratory (AC02‐05CH11231, DE-AC02-05CH11231, No. DE-AC02-05CH11231, Contract No. DE-AC02-05CH11231, 05CH11231)
Topics
  • Life Sciences › Immunology and Microbiology › Applied Microbiology and Biotechnology › Microbial Natural Products and Biosynthesis
  • Life Sciences › Biochemistry, Genetics and Molecular Biology › Molecular Biology › Microbial Metabolic Engineering and Bioproduction
  • Life Sciences › Biochemistry, Genetics and Molecular Biology › Molecular Biology › Enzyme Catalysis and Immobilization
Keywords
domain exchange, acyltransferase domain, protein stability, protein misfolding, high-throughput screening
MeSH terms
Amino Acid Sequence, Polyketide Synthases

About these checks

Registry, retraction, Cites and statistics results are computed, not judged, with one exception: a printed reference that no index lists is read once by a model before it counts as a citation error. Claims are extracted by a model and kept only when their quote appears verbatim in the text; each cited source is then checked, with a model’s help, for whether it says what the claim relies on. Those verdicts can be wrong — read the claim’s quote and the cited source before relying on one.

Statistics and arithmetic are recomputed, not judged.

Confidence bands are shown only for fields calibrated on our annotated test set. None is calibrated yet, so no band is shown.

What counts as a claim ›How we measure confidence ›How we check this ›

Are you an author, or do you see a problem with this page? Request a review