PreprintCited by 87Computational Drug Discovery MethodsProtein Degradation and InhibitorsMachine Learning in Materials Science

The DOI matches its Crossref record; 1 of the 1 references it cites were found in a registry or an index.

Interaction-aware 3D Molecular Generative Framework for Generalizable Structure-based Drug Design

Open access
Kim, Woo Youn, Zhung, Wonho, Kim, Hyeongwoo·2023·Nature Communications

Preprint — published as 10.1038/s41467-024-47011-2

Abstract

Deep generative modeling has a strong potential to accelerate drug design. However, existing generative models often face challenges in generalization due to limited data, leading to less innovative designs and unfavorable interactions with target proteins. To address these issues, we propose an interaction-aware 3D molecular generative framework with its conditional generative model named DeepICL. By leveraging the universal nature of protein-ligand interactions, our model can achieve a generalizable structure-based drug design even with a small experimental dataset. Our framework's generalization ability is comprehensively assessed by analyzing generated ligands for unseen targets in terms of binding pose stability, affinity, geometric patterns, diversity, and novelty. The successful design of mutant-selective inhibitors further manifests the impact of our interaction-aware conditional generation approach in real-world applications.

Overview

The claims and statistics of this paper haven’t been checked yet.

Run the check — free, no account needed. It reads the open-access text and checks the sources it cites.

A few free checks a day · papers already verified open instantly · results are public

Integrity signals

Registry

Crossref · 10.21203/rs.3.rs-3388359/v1

Cites

1 of 1 references verified0 citation errors · 0 not checkable

Statistics

Figures

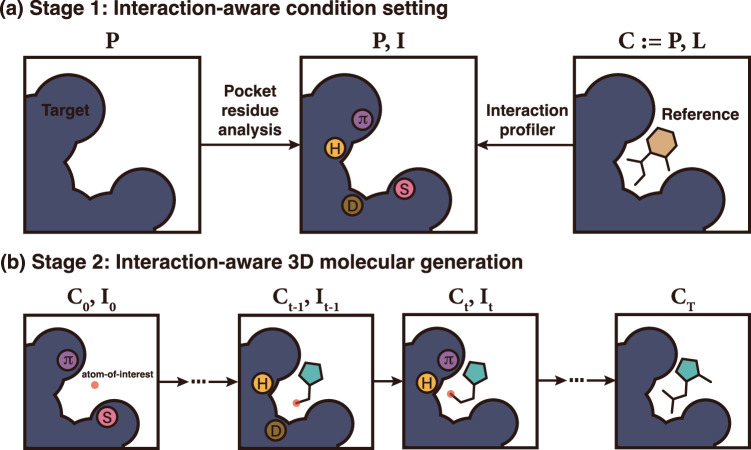
Fig. 1 A conceptualized illustration of our proposed interaction-aware 3D ligand generative framework. a The first stage profiles a protein pocket to designate an interaction condition on each protein atom. b In the second stage, DeepICL sequentially adds ligand atoms inside a protein pocket based on the predetermined interaction condition. Letters inside circles indicate interaction types as follows: hydrogen bonds (H), hydrophobic interactions (D), salt bridges (S), and π–π stackings (π).
Fig. 1 A conceptualized illustration of our proposed interaction-aware 3D ligand generative framework. a The first stage profiles a protein pocket to designate an interaction condition on each protein atom. b In the second stage, DeepICL sequentially adds ligand atoms inside a protein pocket based on the predetermined interaction condition. Letters inside circles indicate interaction types as follows: hydrogen bonds (H), hydrophobic interactions (D), salt bridges (S), and π–π stackings (π).CC BY · PubMed Central
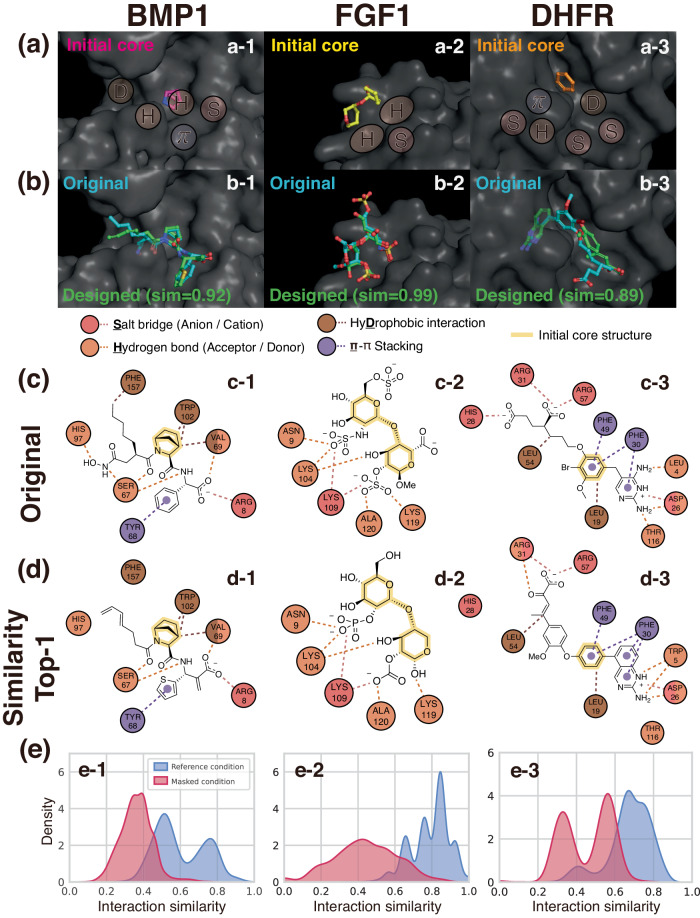
Fig. 2 Examples of interaction-aware conditioned ligand elaboration. a Initial core structures and binding pocket surfaces marked with given interaction conditions. Although an interaction condition is defined at an atom level, we illustrate conditions as patches for a better visual representation. b The original and designed ligands of the highest interaction similarities with the respective similarity value. c, d The 2D diagrams of profiled interactions between the pocket and the original ligands or designed ligands. The circles indicate amino acid residues, and the dashed lines indicate the interactions. Different colors are used to distinguish interaction types, where circles with multiple colors correspond to the residues involved in more than one type of interaction. The core structures used as an initial structure are highlighted in each ligand. e The distributions of interaction similarities of ligands generated with the reference and masked condition. Source data are provided as a Source Data file. Left: bone morphogenic protein 1 (BMP1, PDB ID: 6bto), middle: fibroblast growth factor 1 (FGF1, PDB ID: 3ud9), right: dihydrofolate reductase (DHFR, PDB ID: 1dis).
Fig. 2 Examples of interaction-aware conditioned ligand elaboration. a Initial core structures and binding pocket surfaces marked with given interaction conditions. Although an interaction condition is defined at an atom level, we illustrate conditions as patches for a better visual representation. b The original and designed ligands of the highest interaction similarities with the respective similarity value. c, d The 2D diagrams of profiled interactions between the pocket and the original ligands or designed ligands. The circles indicate amino acid residues, and the dashed lines indicate the interactions. Different colors are used to distinguish interaction types, where circles with multiple colors correspond to the residues involved in more than one type of interaction. The core structures used as an initial structure are highlighted in each ligand. e The distributions of interaction similarities of ligands generated with the reference and masked condition. Source data are provided as a Source Data file. Left: bone morphogenic protein 1 (BMP1, PDB ID: 6bto), middle: fibroblast growth factor 1 (FGF1, PDB ID: 3ud9), right: dihydrofolate reductase (DHFR, PDB ID: 1dis).CC BY · PubMed Central
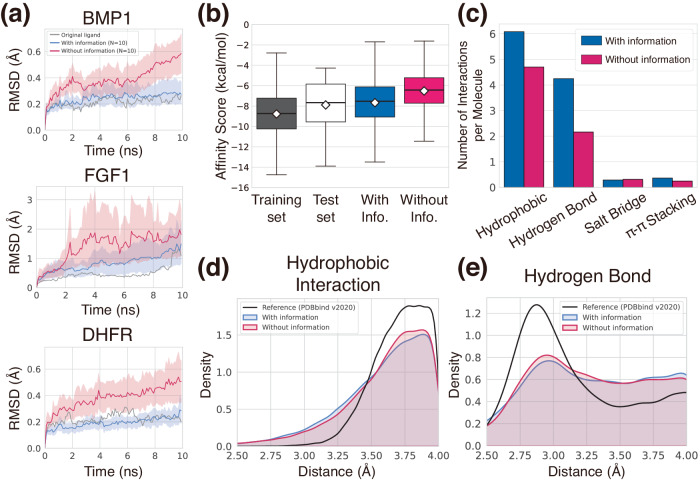
Fig. 3 Demonstration of the generalizability of our generative framework. a Plots of ligand RMSDs during short MD simulations to assess the binding pose stability of designed ligands in three pockets from the test set—BMP1, FGF1, and DHFR. The blue and red curves depict the averaged RMSDs of ten sampled ligands of each generated set with 95% confidence intervals. Gray curves show ligand RMSDs of the original ligands. b The binding affinity scores of each set are presented as box plots (center line at the median, upper bound at 75th percentile, lower bound at 25th percentile) with whiskers at the minimum and maximum values. The average scores are also shown as diamonds. 100 ligands were generated with and without interaction information for each of the 100 test pockets, resulting in a total of 10,000 ligands. Their binding affinity scores were depicted in the blue and red boxes, respectively. The binding affinity scores of the ground-truth complexes composing the training and test sets are also analyzed, and depicted as the black and white boxes, respectively. Note that the training and test complexes are carefully separated, thus the training and test ligands are from distinct protein targets. c The bar plot of the number of interactions per molecule for each interaction type from the generated complexes in (b). d, e Kernel density estimation plots of hydrophobic interaction and hydrogen bonding distances, respectively. The distances from the generated complexes in (b) were measured by using the PLIP software. Source data are provided as a Source Data file.
Fig. 3 Demonstration of the generalizability of our generative framework. a Plots of ligand RMSDs during short MD simulations to assess the binding pose stability of designed ligands in three pockets from the test set—BMP1, FGF1, and DHFR. The blue and red curves depict the averaged RMSDs of ten sampled ligands of each generated set with 95% confidence intervals. Gray curves show ligand RMSDs of the original ligands. b The binding affinity scores of each set are presented as box plots (center line at the median, upper bound at 75th percentile, lower bound at 25th percentile) with whiskers at the minimum and maximum values. The average scores are also shown as diamonds. 100 ligands were generated with and without interaction information for each of the 100 test pockets, resulting in a total of 10,000 ligands. Their binding affinity scores were depicted in the blue and red boxes, respectively. The binding affinity scores of the ground-truth complexes composing the training and test sets are also analyzed, and depicted as the black and white boxes, respectively. Note that the training and test complexes are carefully separated, thus the training and test ligands are from distinct protein targets. c The bar plot of the number of interactions per molecule for each interaction type from the generated complexes in (b). d, e Kernel density estimation plots of hydrophobic interaction and hydrogen bonding distances, respectively. The distances from the generated complexes in (b) were measured by using the PLIP software. Source data are provided as a Source Data file.CC BY · PubMed Central
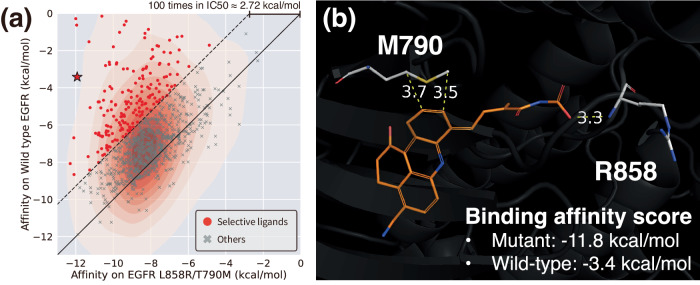
Fig. 4 Selectively controlled ligand design via site-specific interaction conditioning. a The scatter plot illustrating the binding affinity scores of designed ligands toward the wild-type EGFR and the double-mutated EGFR, with their population density. Red points show 2.72 kcal/mol lower binding affinity (corresponding to theoretically 100-fold less inhibitory concentration) for the mutated EGFR. Source data are provided as a Source Data file. b An example of a well-designed ligand that is expected to be selective toward the double-mutated EGFR (depicted as a star in (a)). Non-covalent interactions and their distances (unit: Å) with mutated residues are shown in yellow dashed lines.
Fig. 4 Selectively controlled ligand design via site-specific interaction conditioning. a The scatter plot illustrating the binding affinity scores of designed ligands toward the wild-type EGFR and the double-mutated EGFR, with their population density. Red points show 2.72 kcal/mol lower binding affinity (corresponding to theoretically 100-fold less inhibitory concentration) for the mutated EGFR. Source data are provided as a Source Data file. b An example of a well-designed ligand that is expected to be selective toward the double-mutated EGFR (depicted as a star in (a)). Non-covalent interactions and their distances (unit: Å) with mutated residues are shown in yellow dashed lines.CC BY · PubMed Central
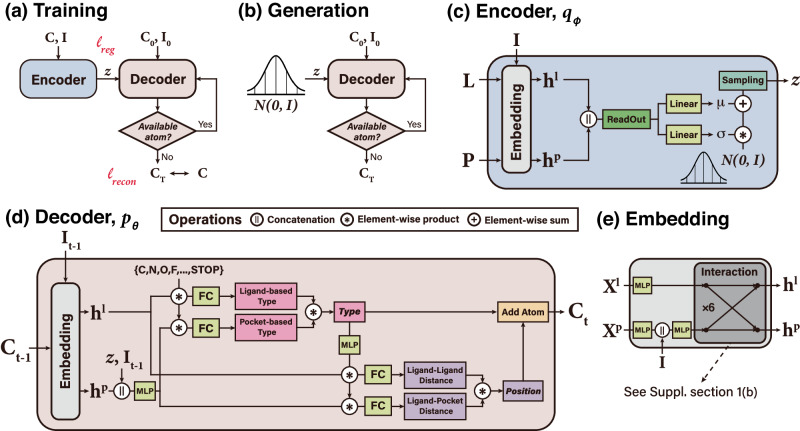
Fig. 5 Illustration of the model architecture of DeepICL. a The training phase of DeepICL, where two losses ℓreg and ℓrecon are denoted. b In the generation phase of DeepICL, z is sampled from the standard normal distribution instead of using the encoder. c The encoder module (qϕ) is trained to encode a whole protein–ligand complex (L, P) and corresponding interaction condition, I, into a latent vector z that follows a prior distribution. d The decoder module (pθ) is trained to reconstruct the ligand structure from the given protein pocket and an interaction condition with an autoregressive process. Note that the decoder of the figure describes a single atom addition step, where a type and a position of the tth ligand atom are determined from the protein–ligand complex of step t−1. e The embedding module is included in front of the encoder and decoder, incorporates interaction conditions to protein atoms, and updates protein and ligand atom features via interaction layers.
Fig. 5 Illustration of the model architecture of DeepICL. a The training phase of DeepICL, where two losses ℓreg and ℓrecon are denoted. b In the generation phase of DeepICL, z is sampled from the standard normal distribution instead of using the encoder. c The encoder module (qϕ) is trained to encode a whole protein–ligand complex (L, P) and corresponding interaction condition, I, into a latent vector z that follows a prior distribution. d The decoder module (pθ) is trained to reconstruct the ligand structure from the given protein pocket and an interaction condition with an autoregressive process. Note that the decoder of the figure describes a single atom addition step, where a type and a position of the tth ligand atom are determined from the protein–ligand complex of step t−1. e The embedding module is included in front of the encoder and decoder, incorporates interaction conditions to protein atoms, and updates protein and ligand atom features via interaction layers.CC BY · PubMed Central

Verification

Claims the paper makes

The claims and statistics of this paper haven’t been checked yet.

Run the check — free, no account needed. It reads the open-access text and checks the sources it cites.

A few free checks a day · papers already verified open instantly · results are public

Self-check

Percentages, sums and reported differences re-computed from the paper’s own numbers.

The self-check needs the paper’s full text.

Citations

Cites

Show all 1 references

Metadata

Authors
Kim, W. Y., Zhung, W., & Kim, H.
Affiliations
Korea Advanced Institute of Science and Technology (KR)
Corresponding author
Kim, Woo Youn
Venue
Nature Communications
Published
2023-10-27
Volume
15
Issue
1
Pages
2688-2688
ISSN
2041-1723 (ISSN-L)
OpenAlex
W4393222489
Cited by
87
References
1
Citations by year
2026: 37 · 2025: 37 · 2024: 13
FWCI
18.39
Type
journal article
Language
en
Open access
Locations
  • Nature Communications (publishedVersion, cc-by)
  • Research Square (acceptedVersion, cc-by)
  • PubMed Central (publishedVersion, cc-by)
  • PubMed (publishedVersion)
  • RePEc: Research Papers in Economics (submittedVersion)
  • DOAJ (DOAJ: Directory of Open Access Journals) (submittedVersion)
Funders
  • National Research Foundation (2018R1A5A1025208)
  • National Research Foundation of Korea (RS-2023-00257479, NRF-2023R1A2C2004376, NRF‐2018R1A5A1025208, 2018R1A5A1025208)
  • Ministry of Science and ICT, South Korea (RS-2023-00257479, 2018R1A5A1025208)
Topics
  • Life Sciences › Pharmacology, Toxicology and Pharmaceutics › Drug Discovery › Computational Drug Discovery Methods
  • Life Sciences › Biochemistry, Genetics and Molecular Biology › Molecular Biology › Protein Degradation and Inhibitors
  • Physical Sciences › Materials Science › Materials Chemistry › Machine Learning in Materials Science
Keywords
generative models, 3D molecular generation, protein-ligand interactions, binding pocket, structure-based drug design, binding affinity, mutant-selective inhibitors
MeSH terms
Ligands, Proteins, Drug Design

About these checks

Registry, retraction, Cites and statistics results are computed, not judged, with one exception: a printed reference that no index lists is read once by a model before it counts as a citation error. Claims are extracted by a model and kept only when their quote appears verbatim in the text; each cited source is then checked, with a model’s help, for whether it says what the claim relies on. Those verdicts can be wrong — read the claim’s quote and the cited source before relying on one.

Statistics and arithmetic are recomputed, not judged.

Confidence bands are shown only for fields calibrated on our annotated test set. None is calibrated yet, so no band is shown.

What counts as a claim ›How we measure confidence ›How we check this ›

Are you an author, or do you see a problem with this page? Request a review

How to cite

Cite CoChat for the checks on this page, and the paper for its own findings.

This page
CoChat. (2026). Citation check: Interaction-aware 3D Molecular Generative Framework for Generalizable Structure-based Drug Design. https://app.cochat.ai/papers/10.21203/rs.3.rs-3388359/v1
The paper
Kim, W. Y., Zhung, W., & Kim, H. (2023). Interaction-aware 3D Molecular Generative Framework for Generalizable Structure-based Drug Design. Nature Communications. https://doi.org/10.21203/rs.3.rs-3388359/v1