PreprintCited by 18vaccines and immunoinformatics approachesMachine Learning in BioinformaticsComputational Drug Discovery Methods

The DOI matches its Crossref record; 1 of the 1 references it cites were found in a registry or an index.

Improving generalizability and data efficiency for MHC-I binding peptide predictions through structure-based geometric deep learning

Open access

Preprint — published as 10.1038/s42003-024-07292-1

Abstract

The interaction between peptides and major histocompatibility complex (MHC) molecules is pivotal for tissue transplantation, pathogen recognition and autoimmune disease treatments. Recent advances in cancer immunotherapies demand for more accurate computational prediction of MHC-bound peptides. We address the generalizability challenge of MHC-bound peptide predictions, revealing limitations in current sequence-based approaches. Our solution employs structure-based methods leveraging geometric deep learning (GDL), yielding up to 8% improvement in generalizability across unseen MHC alleles. We tackle data efficiency by introducing a self-supervised learning approach surpassing sequence-based methods, even without being trained on binding affinity data. Finally, we demonstrate the resilience of structure-based GDL methods to biases in binding data on an Hepatitis B virus vaccine design case study. This study highlights structure-based methods’ potential to enhance generalizability and data efficiency, with implications for data-intensive fields like T-cell receptor specificity predictions, paving the way for enhanced comprehension and manipulation of immune responses.

Overview

The claims and statistics of this paper haven’t been checked yet.

Run the check — free, no account needed. It reads the open-access text and checks the sources it cites.

A few free checks a day · papers already verified open instantly · results are public

Integrity signals

Registry

Crossref · 10.21203/rs.3.rs-3924124/v1

Cites

1 of 1 references verified0 citation errors · 0 not checkable

Statistics

Figures

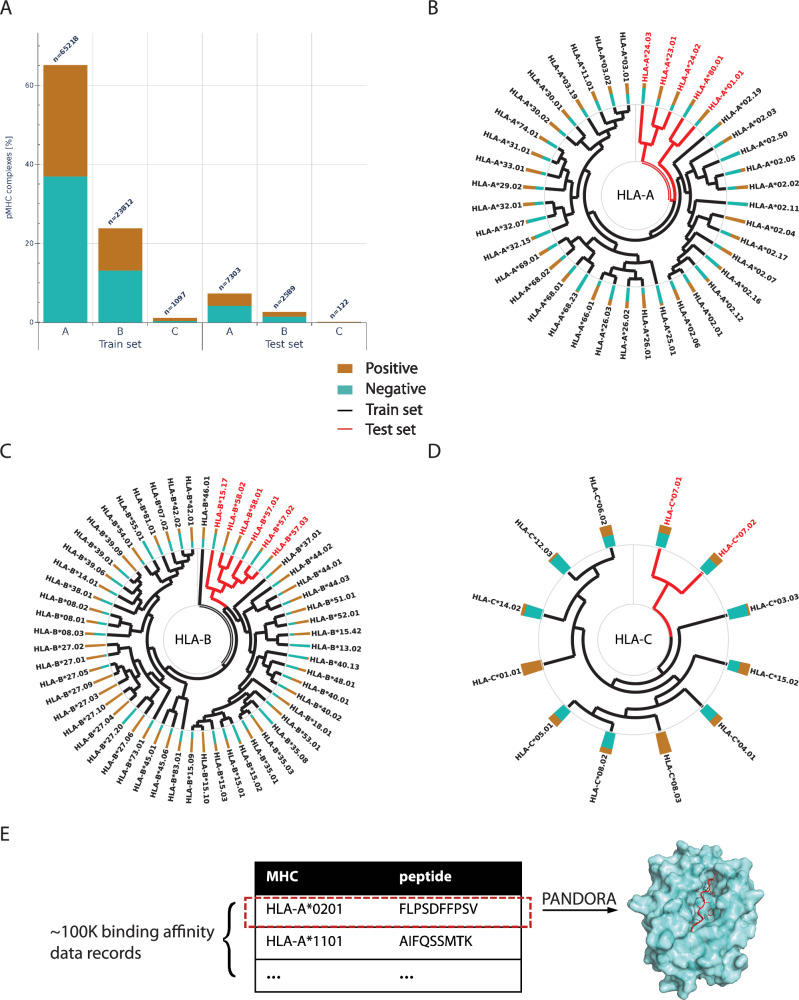
Fig. 1 Data overview. A Shuffled data distribution representation between HLA-A, -B and -C for the training and test sets. B-D show the hierarchical clustering of HLA-A, -B, -C pseudosequences, respectively, with training data in black and test data in red. In all panels, the mustard/teal bar by each gene label represents the binders/non-binders (positive/negative) ratio for the gene. E Data enrichment through 3D modeling. We used PANDORA37 to generate 20 3D models of each of the 100178 pMHC data points, thus enriching the sequence information with physics-derived information, such as geometry and physico-chemical features.
Fig. 1 Data overview. A Shuffled data distribution representation between HLA-A, -B and -C for the training and test sets. B-D show the hierarchical clustering of HLA-A, -B, -C pseudosequences, respectively, with training data in black and test data in red. In all panels, the mustard/teal bar by each gene label represents the binders/non-binders (positive/negative) ratio for the gene. E Data enrichment through 3D modeling. We used PANDORA37 to generate 20 3D models of each of the 100178 pMHC data points, thus enriching the sequence information with physics-derived information, such as geometry and physico-chemical features.CC BY · PubMed Central
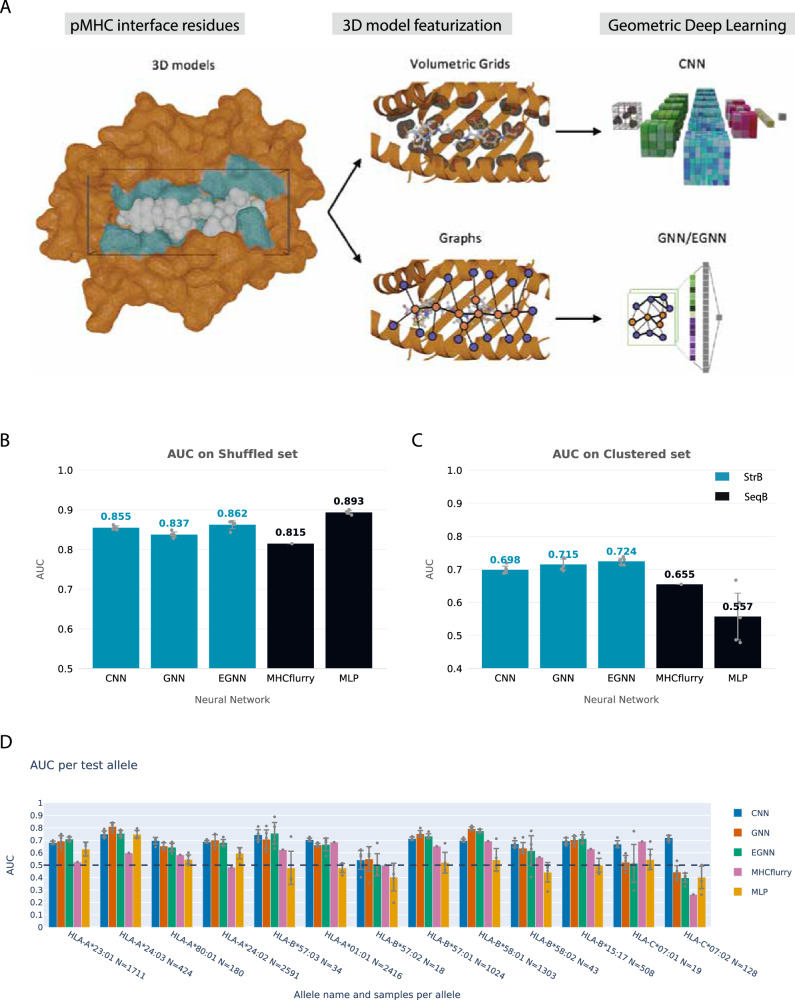
Fig. 2 Our supervised StrB methods overview and performances. A Overview of the pipeline employed for processing pMHC complexes and running the supervised structure-based networks. The process involves: 1) Identifying interface atoms and residues from the pMHC 3D models, 2) converting each pMHC interface into volumetric grids and graphs enriched with geometric and physico-chemical information (Tables 1–3), 3) Run the networks on these representations: volumetric grids for the CNN and graphs for GNN and EGNN. GNN and EGNN use similar graph topology, differing on features and message passing framework (see details in Methods). B, C The performance of StrB and SeqB methods on the shuffled test dataset and on the allele-clustered test dataset, respectively. For all the networks except MHCflurry, 5 replicas were performed by randomly re-sampling each validation set, and the error bars show the standard deviation between the five replicas. Each replica is marked as a gray dot. MHCflurry handles the separate validation sets internally and collects the networks’ outputs, as such no standard deviation could be retrieved. D AUC per allele on the allele-clustered test set. Allele name and number of test cases are reported on the x-axis, and the alleles are sorted by sequence distance with the training set. The black dashed line marks the random predictor AUC value of 0.5. Error bars show the standard deviation between the five replicas. Each replica is marked as a black dot.
Fig. 2 Our supervised StrB methods overview and performances. A Overview of the pipeline employed for processing pMHC complexes and running the supervised structure-based networks. The process involves: 1) Identifying interface atoms and residues from the pMHC 3D models, 2) converting each pMHC interface into volumetric grids and graphs enriched with geometric and physico-chemical information (Tables 1–3), 3) Run the networks on these representations: volumetric grids for the CNN and graphs for GNN and EGNN. GNN and EGNN use similar graph topology, differing on features and message passing framework (see details in Methods). B, C The performance of StrB and SeqB methods on the shuffled test dataset and on the allele-clustered test dataset, respectively. For all the networks except MHCflurry, 5 replicas were performed by randomly re-sampling each validation set, and the error bars show the standard deviation between the five replicas. Each replica is marked as a gray dot. MHCflurry handles the separate validation sets internally and collects the networks’ outputs, as such no standard deviation could be retrieved. D AUC per allele on the allele-clustered test set. Allele name and number of test cases are reported on the x-axis, and the alleles are sorted by sequence distance with the training set. The black dashed line marks the random predictor AUC value of 0.5. Error bars show the standard deviation between the five replicas. Each replica is marked as a black dot.CC BY · PubMed Central
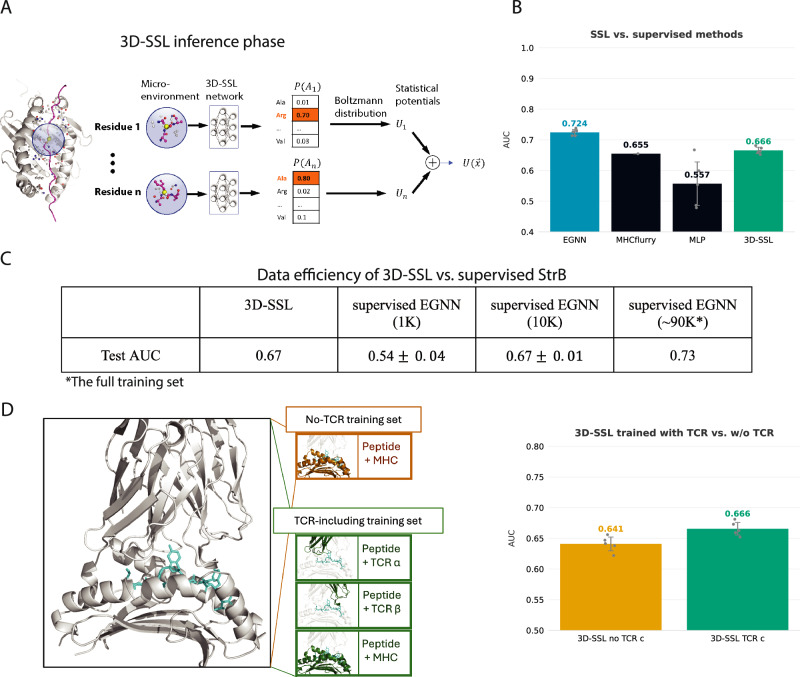
Fig. 3 Self-supervised learning approach (3D-SSL) overview and performances. A the inference stage of 3D-SSL. 3D-SSL is an EGNN network. It takes the microenvironment of a masked peptide residue as input, predicts the probability of amino acid identities of the masked residue, then converts the probability into statistical potential using Boltzmann distribution as the energy contribution of this microenvironment. For the training stage of 3D-SSL, see Supplementary Fig. 2. B Comparison of 3D-SSL (i.e., unsupervised EGNN) with the same EGNN network trained in a supervised manner and with SeqB approaches, on the allele-clustered dataset. Replicas are marked as gray dots. There are no allele overlaps between the 3D-SSL training set and the allele-clustered test set. C Data efficiency of 3D-SSL against supervised EGNN, our top StrB method. The same EGNN architecture is used by 3D-SSL and supervised EGNN (see Supplementary Note 4). We evaluate the effect of training data size (1 K, 10 K, ~90 K) on supervised EGNN performance. The allele-clustered BA dataset is randomly sampled for training the supervised EGNN. AUCs are averaged over 5 runs to account for the potentially unrepresentative subsets. Error bars show the standard deviation between the five replicas. D 3D-SSL performance in terms of AUC when trained with and without peptide-TCR structures, as schematized on the left. We repeated the experiments five times to be sure the difference between training with TCRs and without TCRs is not caused by randomness (error bars for standard deviations shown in black, replicas shown as gray dots).
Fig. 3 Self-supervised learning approach (3D-SSL) overview and performances. A the inference stage of 3D-SSL. 3D-SSL is an EGNN network. It takes the microenvironment of a masked peptide residue as input, predicts the probability of amino acid identities of the masked residue, then converts the probability into statistical potential using Boltzmann distribution as the energy contribution of this microenvironment. For the training stage of 3D-SSL, see Supplementary Fig. 2. B Comparison of 3D-SSL (i.e., unsupervised EGNN) with the same EGNN network trained in a supervised manner and with SeqB approaches, on the allele-clustered dataset. Replicas are marked as gray dots. There are no allele overlaps between the 3D-SSL training set and the allele-clustered test set. C Data efficiency of 3D-SSL against supervised EGNN, our top StrB method. The same EGNN architecture is used by 3D-SSL and supervised EGNN (see Supplementary Note 4). We evaluate the effect of training data size (1 K, 10 K, ~90 K) on supervised EGNN performance. The allele-clustered BA dataset is randomly sampled for training the supervised EGNN. AUCs are averaged over 5 runs to account for the potentially unrepresentative subsets. Error bars show the standard deviation between the five replicas. D 3D-SSL performance in terms of AUC when trained with and without peptide-TCR structures, as schematized on the left. We repeated the experiments five times to be sure the difference between training with TCRs and without TCRs is not caused by randomness (error bars for standard deviations shown in black, replicas shown as gray dots).CC BY · PubMed Central
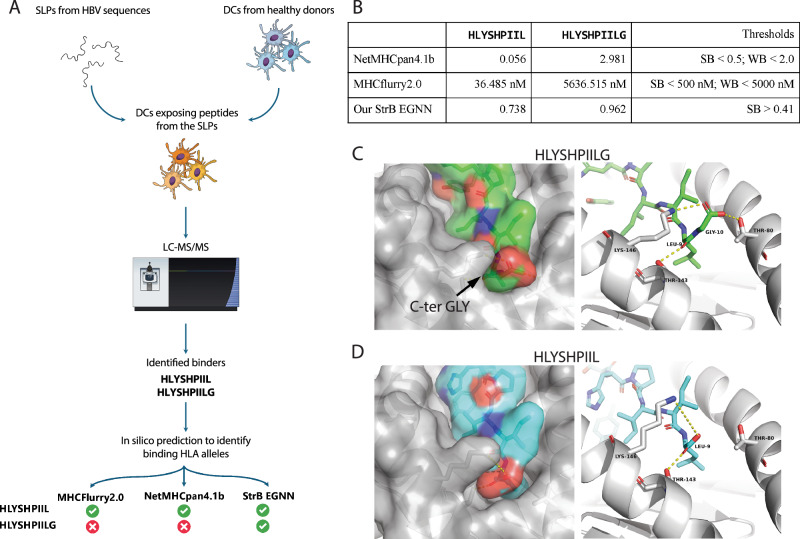
Fig. 4 Case study on two peptides in HBV vaccine research. A HBV case study experiment. Sequences isolated from HBV have been used to synthesize SLPs. The SLPs were then added to DCs cultures from 6 healthy donors. Samples were then analyzed by liquid chromatography tandem mass spectrometry (LC-MS/MS), leading to the identification of peptides presented on the surface of DCs. The peptides were then fed into NetMHCpan4.1b, MHCflurry2.0 BA and our StrB GNN and EGNN. Only our StrB methods successfully identified both peptides as binders. Figure created in the Mind the Graph platform www.mindthegraph.com. B Outputs and cutoffs from predictors tested. The GNN and EGNN here are trained on the whole ~100 K binding affinity data. “SB” stands for Strong Binder, for which the generally used IC50 cutoff is 500 nM and “WB” stands for Weak Binder, for which the generally used IC50 cutoff is 5000 nM. C, D Structural models for HLYSHPIILG (green) and HLYSHPIIL (cyan). Expected polar interactions and hydrogen bonds are shown as yellow dashed lines. Structural models are generated by PANDORA37. Visualizations are done in PYMOL77.
Fig. 4 Case study on two peptides in HBV vaccine research. A HBV case study experiment. Sequences isolated from HBV have been used to synthesize SLPs. The SLPs were then added to DCs cultures from 6 healthy donors. Samples were then analyzed by liquid chromatography tandem mass spectrometry (LC-MS/MS), leading to the identification of peptides presented on the surface of DCs. The peptides were then fed into NetMHCpan4.1b, MHCflurry2.0 BA and our StrB GNN and EGNN. Only our StrB methods successfully identified both peptides as binders. Figure created in the Mind the Graph platform www.mindthegraph.com. B Outputs and cutoffs from predictors tested. The GNN and EGNN here are trained on the whole ~100 K binding affinity data. “SB” stands for Strong Binder, for which the generally used IC50 cutoff is 500 nM and “WB” stands for Weak Binder, for which the generally used IC50 cutoff is 5000 nM. C, D Structural models for HLYSHPIILG (green) and HLYSHPIIL (cyan). Expected polar interactions and hydrogen bonds are shown as yellow dashed lines. Structural models are generated by PANDORA37. Visualizations are done in PYMOL77.CC BY · PubMed Central

Verification

Claims the paper makes

The claims and statistics of this paper haven’t been checked yet.

Run the check — free, no account needed. It reads the open-access text and checks the sources it cites.

A few free checks a day · papers already verified open instantly · results are public

Self-check

Percentages, sums and reported differences re-computed from the paper’s own numbers.

The self-check needs the paper’s full text.

Citations

Cites

Metadata

Authors
Xue, L., Marzella, D., Crocioni, G., Radusinović, T., Lepikhov, D., Severin, H., Bodor, D., Rademaker, D., Lin, C., Georgievska, S., Renaud, N., Kessler, A., Lopez-Tarifa, P., Buschow, S., & Bekkers, E.
Affiliations
  • Radboud University Medical Center (NL)
  • Netherlands eScience Center (NL)
  • University of Amsterdam (NL)
  • Erasmus MC (NL)
  • Netherlands eScience Center
Corresponding author
Xue, Li
Venue
Communications Biology
Published
2024-03-26
Volume
7
Issue
1
Pages
1661-1661
ISSN
2399-3642 (ISSN-L)
OpenAlex
W4405577048
Cited by
18
References
1
Citations by year
2026: 9 · 2025: 8 · 2024: 1
FWCI
2.45
Type
journal article
Language
en
Open access
Locations
  • Communications Biology (publishedVersion, cc-by)
  • Research Square (acceptedVersion, cc-by)
  • PubMed Central (publishedVersion, cc-by)
  • PubMed (publishedVersion)
  • EUR Research Repository (Erasmus University Rotterdam) (publishedVersion, cc-by)
  • UvA-DARE (University of Amsterdam) (acceptedVersion, cc-by)
  • Pure Amsterdam UMC (submittedVersion, cc-by)
  • Radboud Repository (Radboud University) (submittedVersion, cc-by)
  • DOAJ (DOAJ: Directory of Open Access Journals) (submittedVersion)
Funders
  • Nvidia
  • Netherlands eScience Center (NLESC.OEC.2021.008)
  • Nederlandse Organisatie voor Wetenschappelijk Onderzoek (OCENW.XS23.2.130)
  • Radboud Universitair Medisch Centrum (Rv819.52706)
  • Stichting Kinderen Kankervrij
Topics
  • Life Sciences › Biochemistry, Genetics and Molecular Biology › Molecular Biology › vaccines and immunoinformatics approaches
  • Life Sciences › Biochemistry, Genetics and Molecular Biology › Molecular Biology › Machine Learning in Bioinformatics
  • Life Sciences › Pharmacology, Toxicology and Pharmaceutics › Drug Discovery › Computational Drug Discovery Methods
Keywords
geometric deep learning, structure-based prediction, self-supervised learning, data efficiency, immunopeptidomics, hepatitis B vaccine, cancer immunotherapy
MeSH terms
Deep Learning, Humans, Major Histocompatibility Complex, Peptides, Protein Binding, Computational Biology

About these checks

Registry, retraction, Cites and statistics results are computed, not judged, with one exception: a printed reference that no index lists is read once by a model before it counts as a citation error. Claims are extracted by a model and kept only when their quote appears verbatim in the text; each cited source is then checked, with a model’s help, for whether it says what the claim relies on. Those verdicts can be wrong — read the claim’s quote and the cited source before relying on one.

Statistics and arithmetic are recomputed, not judged.

Confidence bands are shown only for fields calibrated on our annotated test set. None is calibrated yet, so no band is shown.

What counts as a claim ›How we measure confidence ›How we check this ›

Are you an author, or do you see a problem with this page? Request a review