PreprintCited by 15Hydrology and Watershed Management StudiesPlant Water Relations and Carbon DynamicsHydrology and Drought Analysis

The DOI matches its Crossref record; the references it cites are not checked yet.

Enhanced effects of changes in precipitation on the water yield and ecosystem sustainability

Open access
Yakir, Dan, Tatrinov, Fedor, Muller, Jonathan, Rotenberg, Eyal·2024·Nature Communications

Preprint — published as 10.1038/s41467-025-66570-6 · Paper page

Abstract

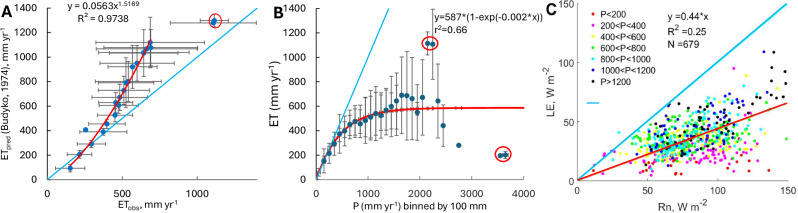
Predictions of climate change over land indicate drying trends in the form of ecological and agricultural droughts over many regions (1-6), and increased flooding in others (7). Globally, evapotranspiration (ET) from vegetated areas consumes about 63% of annual precipitation8, which is expected to increase with global warming (9,10), and can approach 100% in drylands (11) beyond which ecosystems are unsustainable. As global climate change progresses, it remains unknown what fraction of the precipitation will remain available for runoff, recharge of aquifers and consumption, or prevent ecosystems’ collapse in dry regions (7,12). Here, we show using a global dataset that evapotranspiration from ecosystems displays a conservative ‘saturation effect’ at ~460 mm across climates with a precipitation range of ~4000 mm. This implies that changes in precipitation are preferentially reflected in ecosystem water yield (WY; the residual between precipitation and evapotranspiration). Consequently, changes in WY are greatly enhanced compared with precipitation changes, both in observations and model-based future projections. In dry regions, ecosystems will reach the unsustainable state (negative WY) faster than expected based on predicted changes in precipitation alone, imposing land cover changes and impacting water availability for ecological and societal needs.

Overview

The claims and statistics of this paper haven’t been checked yet.

Run the check — free, no account needed. It reads the open-access text and checks the sources it cites.

A few free checks a day · papers already verified open instantly · results are public

Integrity signals

Registry

Crossref · 10.21203/rs.3.rs-3962305/v1

Cites

Statistics

Figures

Fig. 1 Evapotranspiration saturation across ecosystems. A Relationship across global FLUXNET sites between mean annual evapotranspiration (ETobs) and predicted annual evapotranspiration (ETpred), calculated using the Budyko equation with PET derived from the Priestley–Taylor method. Data are binned by 100 mm intervals of precipitation. Error bars indicate standard deviations; the blue line represents the 1:1 line. Data include 453 data years from 182 sites. Two sites marked by red circle (4 years) were excluded from regression. B Dependence of annual total observed ET on the measured annual precipitation (P) binned by 100 mm of precipitation. Error bars represent standard deviations, the blue line is 1:1 line, a few outliers (representing 9 years out 867 data years) were excluded from the regression (marked by red circles).; and C dependence of annual mean latent heat flux (LE = λ·ETobs, where λ is the enthalpy of vaporization) on annual mean net radiation (Rn), grouped by precipitation classes (in mm yr⁻¹), using data from all biomes. N indicates the number of site-years available; differences in N reflect variation in data completeness across variables.
Fig. 1 Evapotranspiration saturation across ecosystems. A Relationship across global FLUXNET sites between mean annual evapotranspiration (ETobs) and predicted annual evapotranspiration (ETpred), calculated using the Budyko equation with PET derived from the Priestley–Taylor method. Data are binned by 100 mm intervals of precipitation. Error bars indicate standard deviations; the blue line represents the 1:1 line. Data include 453 data years from 182 sites. Two sites marked by red circle (4 years) were excluded from regression. B Dependence of annual total observed ET on the measured annual precipitation (P) binned by 100 mm of precipitation. Error bars represent standard deviations, the blue line is 1:1 line, a few outliers (representing 9 years out 867 data years) were excluded from the regression (marked by red circles).; and C dependence of annual mean latent heat flux (LE = λ·ETobs, where λ is the enthalpy of vaporization) on annual mean net radiation (Rn), grouped by precipitation classes (in mm yr⁻¹), using data from all biomes. N indicates the number of site-years available; differences in N reflect variation in data completeness across variables.CC BY-NC-ND · PubMed Central
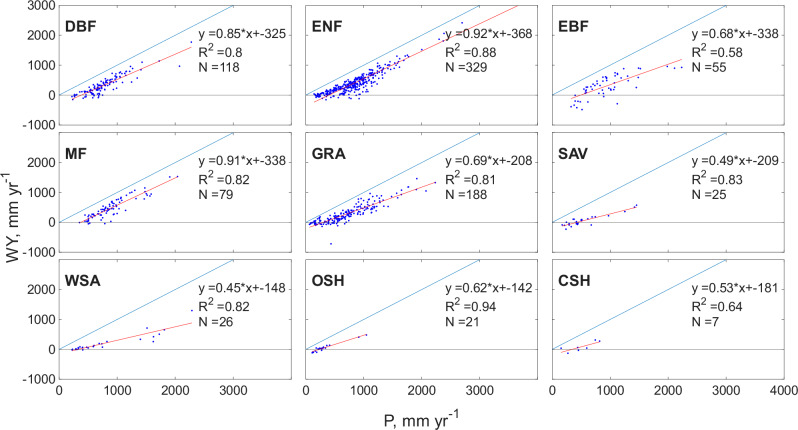
Fig. 2 Water yield response to precipitation by biome. Variations in annual ecosystem water yield (WY) as a function of annual mean precipitation (P) across eddy covariance (EC) flux sites, grouped by biome type. Biome acronyms are defined in Table S1; site data are summarized in Table S2. N indicates the number of data years available for each biome.
Fig. 2 Water yield response to precipitation by biome. Variations in annual ecosystem water yield (WY) as a function of annual mean precipitation (P) across eddy covariance (EC) flux sites, grouped by biome type. Biome acronyms are defined in Table S1; site data are summarized in Table S2. N indicates the number of data years available for each biome.CC BY-NC-ND · PubMed Central
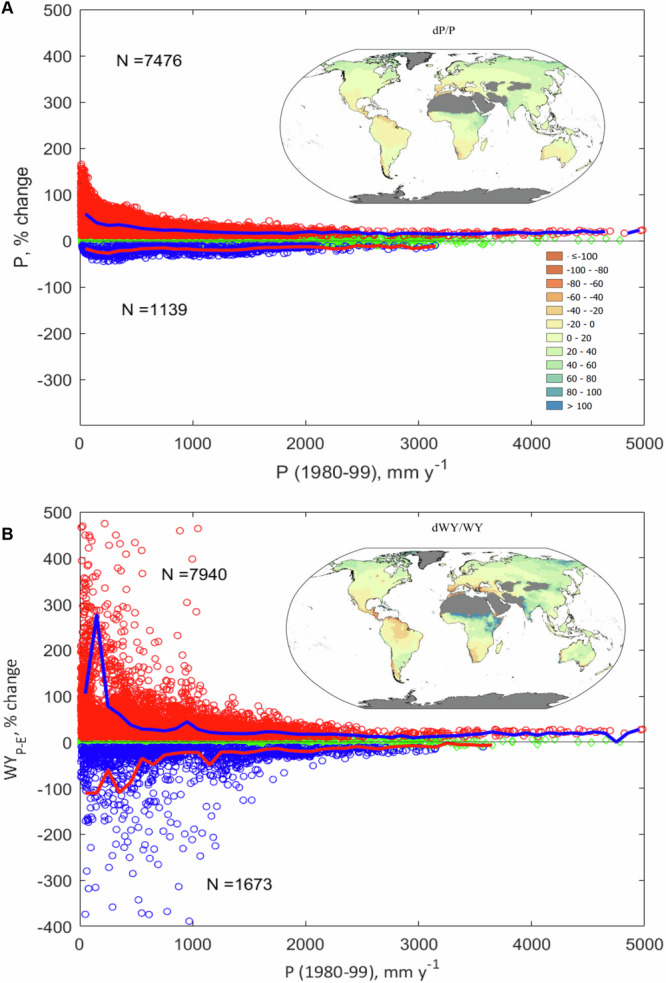
Fig. 3 Projected global changes in precipitation and enhanced water yield. Projected (CMIP6; see “Methods”) changes in precipitation (P) and water yield (WY) over land, based on multi-model means for the periods 1980–1999 and 2080–2099 (denoted by subscripts 20 and 21, respectively). A Relative changes in precipitation are calculated as: ΔP (%) = (P₂₁ − P₂₀) / P₂₀ × 100. B Relative changes in water yield (WYP–E) are computed as: ΔWY (%) = (WY₂₁ − WY₂₀) / WY₂₀ × 100, where WY is approximated as P − E. Values are plotted against baseline P₂₀. Positive (red) and negative (blue) changes are shown separately for land areas within ±70° latitude. Lines represent means within 100-mm precipitation bins. Green points ( ± 10% change) are excluded from bin averaging. Inset maps show the spatial distribution of relative changes in ΔP (panel A) and ΔWY (panel B), illustrating that WY exhibits enhanced relative changes compared with P. Note: In some dry regions (e.g., the Sahel, Australia), even small reductions in P produce large relative changes in WY. In ~1.7% of land grid cells, WY decreased despite increases in P, mainly in parts of Australia where evaporation was suppressed. The data were drawn using open-source application by QGIS Association, http://www.qgis.org.
Fig. 3 Projected global changes in precipitation and enhanced water yield. Projected (CMIP6; see “Methods”) changes in precipitation (P) and water yield (WY) over land, based on multi-model means for the periods 1980–1999 and 2080–2099 (denoted by subscripts 20 and 21, respectively). A Relative changes in precipitation are calculated as: ΔP (%) = (P₂₁ − P₂₀) / P₂₀ × 100. B Relative changes in water yield (WYP–E) are computed as: ΔWY (%) = (WY₂₁ − WY₂₀) / WY₂₀ × 100, where WY is approximated as P − E. Values are plotted against baseline P₂₀. Positive (red) and negative (blue) changes are shown separately for land areas within ±70° latitude. Lines represent means within 100-mm precipitation bins. Green points ( ± 10% change) are excluded from bin averaging. Inset maps show the spatial distribution of relative changes in ΔP (panel A) and ΔWY (panel B), illustrating that WY exhibits enhanced relative changes compared with P. Note: In some dry regions (e.g., the Sahel, Australia), even small reductions in P produce large relative changes in WY. In ~1.7% of land grid cells, WY decreased despite increases in P, mainly in parts of Australia where evaporation was suppressed. The data were drawn using open-source application by QGIS Association, http://www.qgis.org.CC BY-NC-ND · PubMed Central
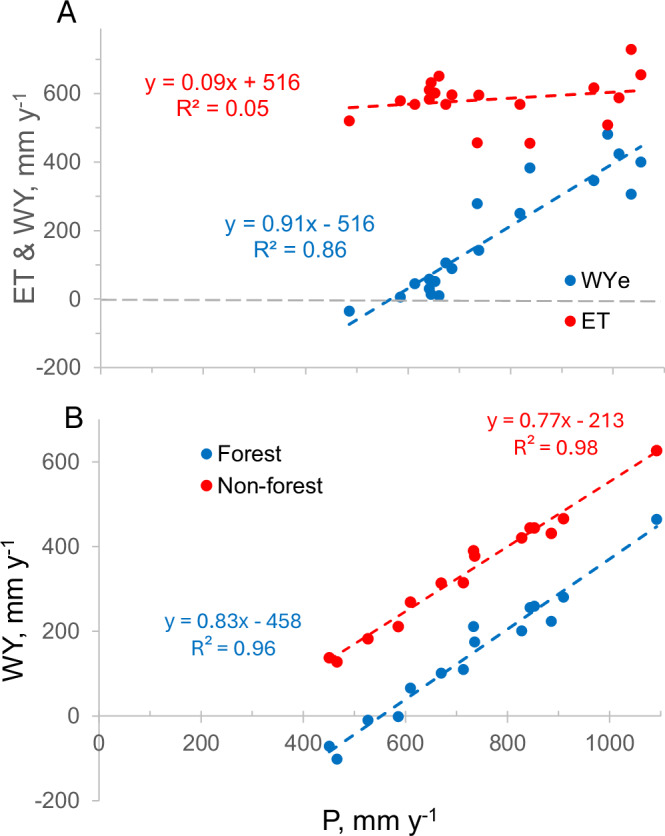
Fig. 4 Site-level contrasts in evapotranspiration and water yield. A Multi-year average water yield (WY) at two paired ecosystem sites: a forest (ENF; Birya) and an adjacent grassland (GRA; Kadita), both located in Israel (see the data in the Table S3). Despite having the same mean annual precipitation (P) of 746 mm, the mean ET differs substantially between the sites (545 mm yr⁻¹ for ENF and 366 mm yr⁻¹ for GRA), resulting in distinct WY and PWY=0 values. B Comparison of multi-year annual evapotranspiration (ET; insensitive to P), and water yield (WY; high sensitivity to P) as a function of annual precipitation (P) at the Niwot Ridge evergreen needleleaf forest (ENF) site in the United States (mean P = 800 mm yr⁻¹; mean ET = 589 mm yr⁻¹). Site metadata for Niwot Ridge available at: https://ameriflux.lbl.gov/sites/siteinfo/US-NR1.
Fig. 4 Site-level contrasts in evapotranspiration and water yield. A Multi-year average water yield (WY) at two paired ecosystem sites: a forest (ENF; Birya) and an adjacent grassland (GRA; Kadita), both located in Israel (see the data in the Table S3). Despite having the same mean annual precipitation (P) of 746 mm, the mean ET differs substantially between the sites (545 mm yr⁻¹ for ENF and 366 mm yr⁻¹ for GRA), resulting in distinct WY and PWY=0 values. B Comparison of multi-year annual evapotranspiration (ET; insensitive to P), and water yield (WY; high sensitivity to P) as a function of annual precipitation (P) at the Niwot Ridge evergreen needleleaf forest (ENF) site in the United States (mean P = 800 mm yr⁻¹; mean ET = 589 mm yr⁻¹). Site metadata for Niwot Ridge available at: https://ameriflux.lbl.gov/sites/siteinfo/US-NR1.CC BY-NC-ND · PubMed Central

Verification

Claims the paper makes

The claims and statistics of this paper haven’t been checked yet.

Run the check — free, no account needed. It reads the open-access text and checks the sources it cites.

A few free checks a day · papers already verified open instantly · results are public

Self-check

Percentages, sums and reported differences re-computed from the paper’s own numbers.

The self-check needs the paper’s full text.

Citations

The citation lists haven’t been fetched yet

References 97 · Cited by 15

Metadata

Authors
Yakir, D., Tatrinov, F., Muller, J., & Rotenberg, E.
Affiliations
  • Weizmann Institute of Science (IL)
  • Weizmann Institute of Science, Earth and Planetary Sciences
  • Stellenbosch University (ZA)
Corresponding author
  • Yakir, Dan
  • Rotenberg, Eyal
Venue
Nature Communications
Published
2024-03-08
Volume
16
Issue
1
Pages
11577-11577
ISSN
2041-1723 (ISSN-L)
OpenAlex
W4416585883
Cited by
15
References
97
Citations by year
2026: 14 · 2025: 1
FWCI
3.81
Type
journal article
Language
en
Open access
Locations
  • Nature Communications (publishedVersion, cc-by-nc-nd)
  • Research Square (acceptedVersion, cc-by)
  • PubMed (publishedVersion)
  • PubMed Central (publishedVersion, cc-by-nc-nd)
  • DOAJ (DOAJ: Directory of Open Access Journals) (submittedVersion, cc-by-sa)
Funders
  • National Science Foundation
  • Schweizerischer Nationalfonds zur Förderung der Wissenschaftlichen Forschung
  • Weizmann Institute of Science
  • Israel Science Foundation (2481/22)
Topics
  • Physical Sciences › Environmental Science › Water Science and Technology › Hydrology and Watershed Management Studies
  • Physical Sciences › Environmental Science › Global and Planetary Change › Plant Water Relations and Carbon Dynamics
  • Physical Sciences › Environmental Science › Global and Planetary Change › Hydrology and Drought Analysis
Keywords
climate sensitivity, rainfall variability, flood risk, ecosystem sustainability

About these checks

Registry, retraction, Cites and statistics results are computed, not judged, with one exception: a printed reference that no index lists is read once by a model before it counts as a citation error. Claims are extracted by a model and kept only when their quote appears verbatim in the text; each cited source is then checked, with a model’s help, for whether it says what the claim relies on. Those verdicts can be wrong — read the claim’s quote and the cited source before relying on one.

Statistics and arithmetic are recomputed, not judged.

Confidence bands are shown only for fields calibrated on our annotated test set. None is calibrated yet, so no band is shown.

What counts as a claim ›How we measure confidence ›How we check this ›

Are you an author, or do you see a problem with this page? Request a review

How to cite

Cite CoChat for the checks on this page, and the paper for its own findings.

This page
CoChat. (2026). Citation check: Enhanced effects of changes in precipitation on the water yield and ecosystem sustainability. https://app.cochat.ai/papers/10.21203/rs.3.rs-3962305/v1
The paper
Yakir, D., Tatrinov, F., Muller, J., & Rotenberg, E. (2024). Enhanced effects of changes in precipitation on the water yield and ecosystem sustainability. Nature Communications. https://doi.org/10.21203/rs.3.rs-3962305/v1