PreprintCited by 9Alzheimer's disease research and treatmentsNeuroinflammation and Neurodegeneration MechanismsMitochondrial Function and Pathology

The DOI matches its Crossref record; 1 of the 1 references it cites were found in a registry or an index.

Divergent consequences of Extracellular tau on the mitochondrial function of astrocytes and neurons

Open access

Preprint — published as 10.1186/s40035-025-00474-9

Abstract

Background Tauopathies encompass a spectrum of neurodegenerative disorders which are marked by the pathological aggregation of tau protein into paired helical filaments (PHF-tau), neurofibrillary tangles (NFTs) and Glial-fibrillary tangles (GFTs). These aggregates impair cellular, mitochondrial, and synaptic functions. The emergence of extracellular tau (ePHF-tau), featuring a myriad of isoforms and phosphorylation states, presents a challenge in comprehending its nuanced effects on neural cells, particularly concerning synaptic and mitochondrial integrity.Methods We studied the impact of ePHF-tau (2N4R) on different states and ages of primary cultures of rat neuroglia. Using confocal microscopy and proteomic analysis of synaptosomes, we studied the impact of ePHF-tau on neurite and synapse number. We monitored mitochondrial responses in neurons and astrocytes over 72 hours using advanced fluorescence microscopy for dynamic, high-throughput analysis.Results Treatment with ePHF-tau has a strong effect on the neurites of immature neurons, but its toxicity is negligible when the neurons are more mature. At the mature stage of their development, we observed a substantial increase in the density of the PSD-95/vGlut1 zone in neurite, suggesting altered synaptic connectivity and ePHF-tau excitotoxicity. Proteomics revealed significant changes in mitochondrial protein in synaptosomes following exposure to ePHF-tau. In the neuronal compartment, real-time imaging revealed rapid and persistent mitochondrial dysfunction, increased ATP production, and reduced mitochondrial turnover. In contrast, we observed increased mitochondrial turnover and filamentation after treatment in the astrocyte processes, indicating cell-specific adaptive responses to ePHF-tau.Conclusions This study sheds light on the intricate effects of extracellular tau aggregates on neuronal and astrocytic mitochondrial populations, highlighting how tau pathology can lead to mitochondrial disturbances and synaptic alterations. By delineating the differential responses of neurons and astrocytes to ePHF-tau, our findings pave the way for developing targeted therapeutic interventions to mitigate the detrimental impacts of tau aggregates in neurodegenerative diseases.

Overview

The claims and statistics of this paper haven’t been checked yet.

Run the check — free, no account needed. It reads the open-access text and checks the sources it cites.

A few free checks a day · papers already verified open instantly · results are public

Integrity signals

Registry

Crossref · 10.21203/rs.3.rs-4306467/v1

Cites

1 of 1 references verified0 citation errors · 0 not checkable

Statistics

Figures

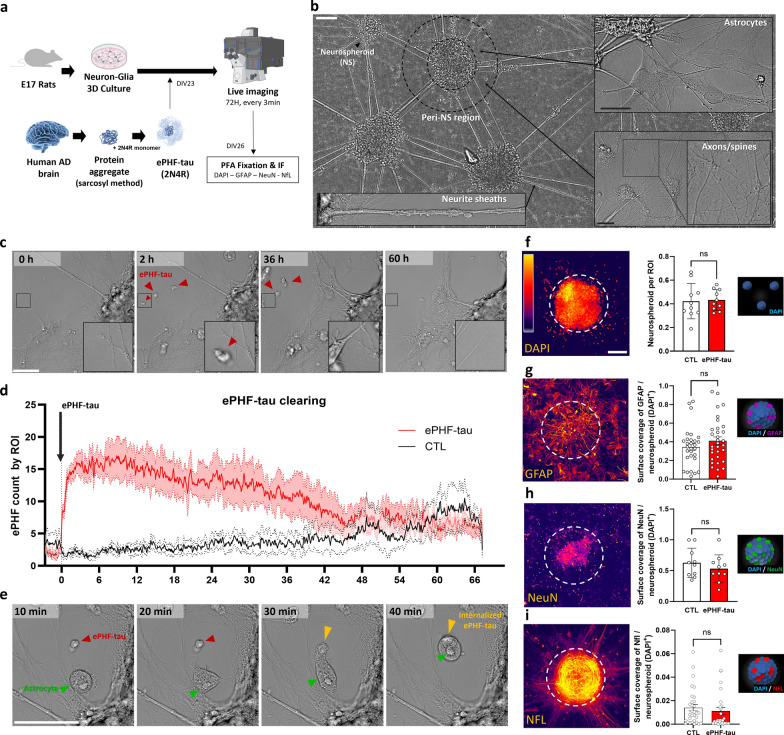
Fig. 1 ePHF-tau is internalized by astrocytes in a neuron-glia 3D cell culture model. a Experimental setup: primary neuron-glia 3D co-cultures were treated with ePHF-tau, followed by live imaging for 72 h and post-fixation immunofluorescence (IF) for astrocytic (GFAP) and neuronal (NeuN, NFL) markers. b Overview of the neuron-glia 3D cultures showing neurospheroids (NS) and their surrounding microenvironment, including the peri-NS region and neurite sheaths. Scale bar: 100 µm. Examples at higher magnification highlight astrocytes (top right) and axonal/spine structures (bottom right). Scale bar: 10 µm. c Time-lapse series showing the gradual disappearance of ePHF-tau aggregates over 60 h. Red arrows point to the aggregates, with an inset providing a higher magnification of an aggregate being cleared at a specific location. Scale bar: 50 µm. d Time series quantifying ePHF-tau clearance per region of interest (ROI) in treated (red) versus control (DMSO, black) conditions, segmented using an AI-based model. Shaded areas represent SEM. e Time-lapse images of ePHF-tau uptake by astrocytes at different time points after aggregate addition (10, 20, 30, and 40 min). Red and yellow arrowheads indicate ePHF-tau aggregates, and green arrows point to astrocytes. Scale bar: 50 µm. f A confocal photograph of the neurospheroid positive for DAPI and the histogram represents the number of neurospheroids in the cultures. g A confocal photograph of astrocytic GFAP labelling in neuropsheroid and histogram presenting the GFAP surface by neuroscpheroide. h A confocal photograph of neuronal NeuN labelling in neuropsheroids and histogram showing NeuN surface by neuroscpheroid. i A confocal photograph of neuronal NFL labelling in neuropsheroids and histogram showing NFL surface by neuroscpheroide. (n = 3 cultures, 25 neurospheroids, 5 ROIs per condition;)
Fig. 1 ePHF-tau is internalized by astrocytes in a neuron-glia 3D cell culture model. a Experimental setup: primary neuron-glia 3D co-cultures were treated with ePHF-tau, followed by live imaging for 72 h and post-fixation immunofluorescence (IF) for astrocytic (GFAP) and neuronal (NeuN, NFL) markers. b Overview of the neuron-glia 3D cultures showing neurospheroids (NS) and their surrounding microenvironment, including the peri-NS region and neurite sheaths. Scale bar: 100 µm. Examples at higher magnification highlight astrocytes (top right) and axonal/spine structures (bottom right). Scale bar: 10 µm. c Time-lapse series showing the gradual disappearance of ePHF-tau aggregates over 60 h. Red arrows point to the aggregates, with an inset providing a higher magnification of an aggregate being cleared at a specific location. Scale bar: 50 µm. d Time series quantifying ePHF-tau clearance per region of interest (ROI) in treated (red) versus control (DMSO, black) conditions, segmented using an AI-based model. Shaded areas represent SEM. e Time-lapse images of ePHF-tau uptake by astrocytes at different time points after aggregate addition (10, 20, 30, and 40 min). Red and yellow arrowheads indicate ePHF-tau aggregates, and green arrows point to astrocytes. Scale bar: 50 µm. f A confocal photograph of the neurospheroid positive for DAPI and the histogram represents the number of neurospheroids in the cultures. g A confocal photograph of astrocytic GFAP labelling in neuropsheroid and histogram presenting the GFAP surface by neuroscpheroide. h A confocal photograph of neuronal NeuN labelling in neuropsheroids and histogram showing NeuN surface by neuroscpheroid. i A confocal photograph of neuronal NFL labelling in neuropsheroids and histogram showing NFL surface by neuroscpheroide. (n = 3 cultures, 25 neurospheroids, 5 ROIs per condition;)CC BY · PubMed Central
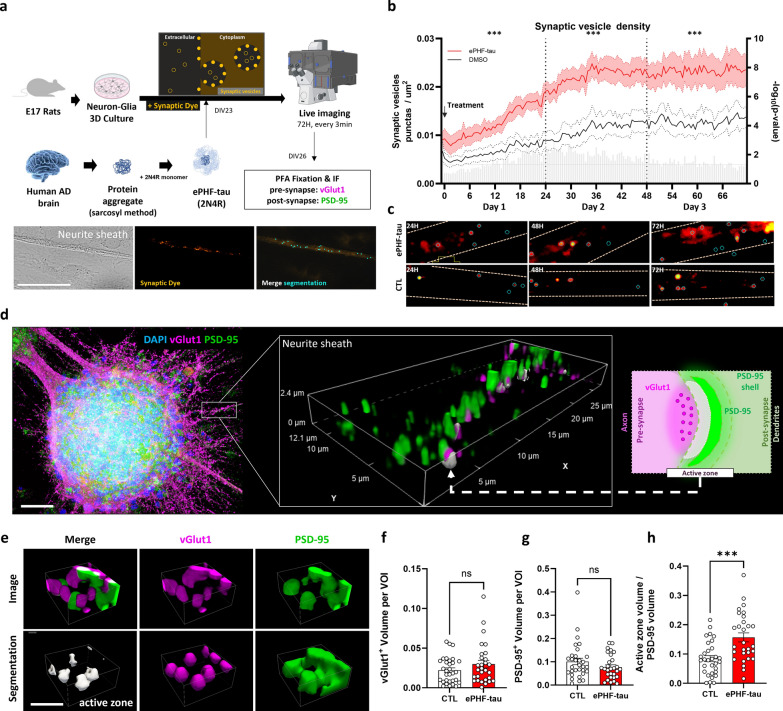
Fig. 2 ePHF-tau induces modifications in synaptic markers in neuronal cultures. a Experimental design: treatment with ePHF-tau, live imaging over 72 h, followed by immunostaining for pre- (VGLUT1) and postsynaptic (PSD-95) markers. Bottom: brightfield and fluorescence images showing synaptic vesicle detection (light blue dots) in neurite sheaths. Scale bar: 50 µm. b Time series of synaptic vesicle density in control (black) and ePHF-tau-treated (red) conditions, relative to the time of treatment. Statistical comparisons for each time points (multiple t-tests) are shown as with gray bars on the right Y-axis as -log(P-value) and comparison over complete days 1, 2, and 3 are shown with asterisks (*) above the graph. c Fluorescence images of synaptic dye at 24, 48, and 72 h, with blue circles marking segmented synaptic vesicles in control and treated conditions. d Combined illustration and methodological overview of neurospheroid immunostaining analysis. The inset shows an example of a 3D volume of interest (VOI) analyzed for synaptic markers. The schematic on the right illustrates the approach used for segmenting active zones and postsynaptic compartments. Scale bar: 100 µm. e 3D visualization of the active zone (gray) along with VGLUT1 (magenta) and PSD-95 (green) in segmented regions of interest (ROI). Scale bar: 5 µm. f–h Quantification of total VGLUT1 volume (f), total PSD-95 volume (g), and active zone volume normalized to PSD-95 surface area (h) in PERI-NS sheath (n = 3 cultures, 25 neurospheroids, 5 ROIs per condition; ***P < 0.001)
Fig. 2 ePHF-tau induces modifications in synaptic markers in neuronal cultures. a Experimental design: treatment with ePHF-tau, live imaging over 72 h, followed by immunostaining for pre- (VGLUT1) and postsynaptic (PSD-95) markers. Bottom: brightfield and fluorescence images showing synaptic vesicle detection (light blue dots) in neurite sheaths. Scale bar: 50 µm. b Time series of synaptic vesicle density in control (black) and ePHF-tau-treated (red) conditions, relative to the time of treatment. Statistical comparisons for each time points (multiple t-tests) are shown as with gray bars on the right Y-axis as -log(P-value) and comparison over complete days 1, 2, and 3 are shown with asterisks (*) above the graph. c Fluorescence images of synaptic dye at 24, 48, and 72 h, with blue circles marking segmented synaptic vesicles in control and treated conditions. d Combined illustration and methodological overview of neurospheroid immunostaining analysis. The inset shows an example of a 3D volume of interest (VOI) analyzed for synaptic markers. The schematic on the right illustrates the approach used for segmenting active zones and postsynaptic compartments. Scale bar: 100 µm. e 3D visualization of the active zone (gray) along with VGLUT1 (magenta) and PSD-95 (green) in segmented regions of interest (ROI). Scale bar: 5 µm. f–h Quantification of total VGLUT1 volume (f), total PSD-95 volume (g), and active zone volume normalized to PSD-95 surface area (h) in PERI-NS sheath (n = 3 cultures, 25 neurospheroids, 5 ROIs per condition; ***P < 0.001)CC BY · PubMed Central
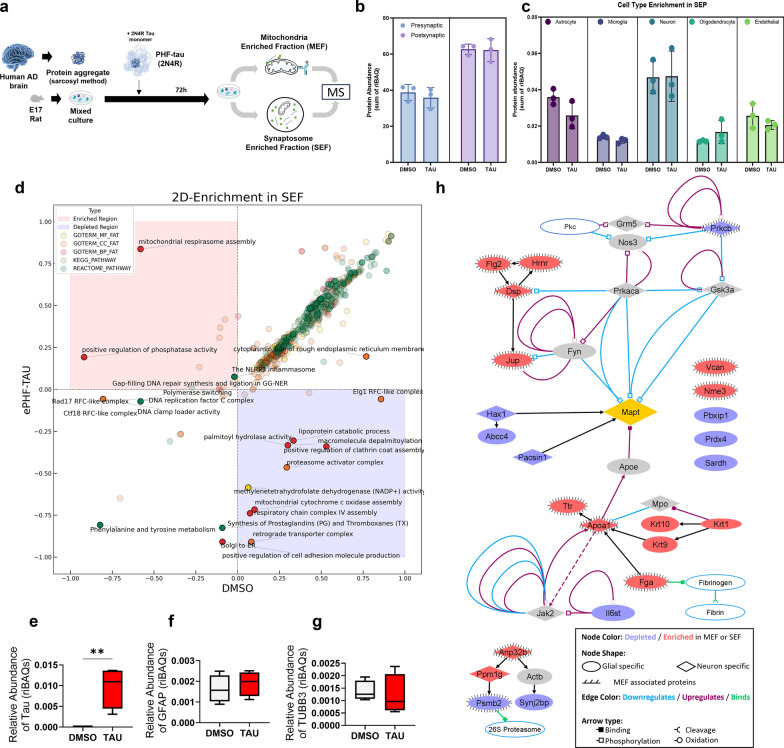
Fig. 3 Proteomic analysis of synaptosome and mitochondrial fractions reveals differential protein regulation under ePHF-tau treatment. a Experimental workflow to investigate the interactions of ePHF-tau in a rat primary mixed culture with 72-h ePHF-tau treatment, followed by isolation of synaptosome-enriched fractions (SEF; n = 3 for DMSO, n = 3 for ePHF-tau) and mitochondria-enriched fractions (MEF; n = 4 for DMSO, n = 4 for ePHF-tau) for proteomic analysis. b Quality check of SEF fractions: Synaptic marker enrichment (presynaptic and postsynaptic proteins) in DMSO and tau-treated conditions, confirming the expected protein content in SEF fractions. c Quality check of SEF fractions based on cell-type enrichment markers (astrocyte, microglia, neuron, oligodendrocyte, and endothelial) showing representation of different cell types within the synaptosome fractions under DMSO and tau-treated conditions. d Differentially expressed functional annotations (2D enrichment) in SEF. Enriched terms are shown in red region, and depleted terms are shown in blue region. Dots colors indicate the annotation types. e–g Box plots comparing the relative abundance of MAPT (e), GFAP (f), and TUBB3 (g) between DMSO and ePHF-tau conditions, showing differential regulation of these proteins in the MEF. h Protein–Protein interaction network of the modified proteins in SEF/MEF
Fig. 3 Proteomic analysis of synaptosome and mitochondrial fractions reveals differential protein regulation under ePHF-tau treatment. a Experimental workflow to investigate the interactions of ePHF-tau in a rat primary mixed culture with 72-h ePHF-tau treatment, followed by isolation of synaptosome-enriched fractions (SEF; n = 3 for DMSO, n = 3 for ePHF-tau) and mitochondria-enriched fractions (MEF; n = 4 for DMSO, n = 4 for ePHF-tau) for proteomic analysis. b Quality check of SEF fractions: Synaptic marker enrichment (presynaptic and postsynaptic proteins) in DMSO and tau-treated conditions, confirming the expected protein content in SEF fractions. c Quality check of SEF fractions based on cell-type enrichment markers (astrocyte, microglia, neuron, oligodendrocyte, and endothelial) showing representation of different cell types within the synaptosome fractions under DMSO and tau-treated conditions. d Differentially expressed functional annotations (2D enrichment) in SEF. Enriched terms are shown in red region, and depleted terms are shown in blue region. Dots colors indicate the annotation types. e–g Box plots comparing the relative abundance of MAPT (e), GFAP (f), and TUBB3 (g) between DMSO and ePHF-tau conditions, showing differential regulation of these proteins in the MEF. h Protein–Protein interaction network of the modified proteins in SEF/MEFCC BY · PubMed Central
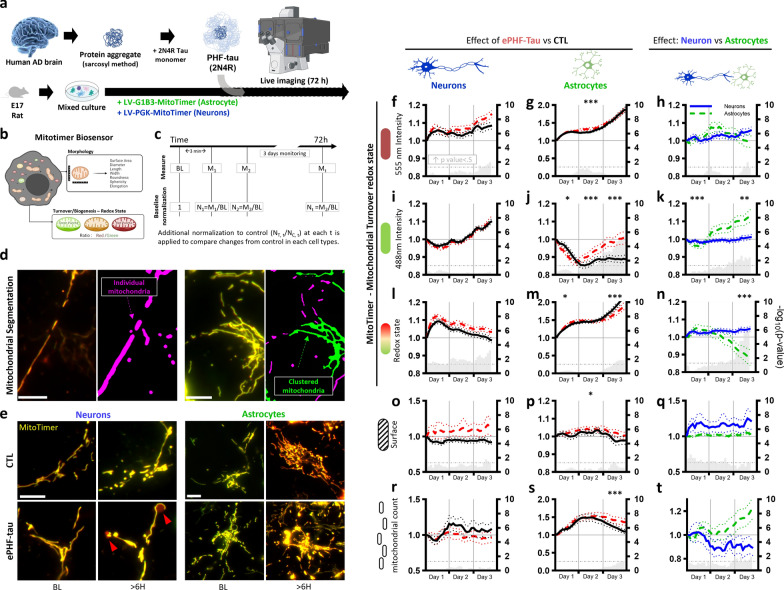
Fig. 4 ePHF-tau negatively affects mitochondrial turnover in neurites. a Experimental design: primary mixed cultures transduced with mitochondrial sensors (MitoTimer) were imaged over 72 h in the presence of ePHF-tau. b Diagram of the MitoTimer biosensor measuring mitochondrial morphology and turnover/redox state. c Data normalization process: mitochondrial features were normalized to baseline (BL) and then compared to controls. d Mitochondrial segmentation illustrating the focus on individual mitochondria (purple) versus clusters (green) in neurons (left) and astrocytes (right). Scale bar: 10 µm. e Representative Mitotimer fluorescence images in neuronal neurites (left) and astrocytic processes (right) at baseline and > 60 h after ePHF-tau treatment. Red arrows indicate swollen, red mitochondria. Scale bar: 10 µm. f–t Comparative analysis of mitochondrial features in and between neurons and astrocytes. Each row represents a specific feature: fluorescence intensity at 555 nm (f, g, h), 488 nm (i, j, k), redox state (l, m, n), mitochondrial surface area (o, p, q), and mitochondrial count (r, s, t). The left columns (f, i, l, o, r) show the effects of ePHF-tau treatment (red lines) versus control (black lines) in neurons, the middle columns (g, j, m, p, s) depict the same comparison in astrocytes, and the right columns (h, k, n, q, t) compare neurons (blue lines) with astrocytes (green lines) relative to their respective controls. Gray bars in each graph represent -log(P-value) for comparisons at each time point on the right y-axis. Asterisks above the graphs indicate P-values for comparisons over entire days (means and SEM, *P < 0.05, **P < 0.01, ***P < 0.001, ****P < 0.0001)
Fig. 4 ePHF-tau negatively affects mitochondrial turnover in neurites. a Experimental design: primary mixed cultures transduced with mitochondrial sensors (MitoTimer) were imaged over 72 h in the presence of ePHF-tau. b Diagram of the MitoTimer biosensor measuring mitochondrial morphology and turnover/redox state. c Data normalization process: mitochondrial features were normalized to baseline (BL) and then compared to controls. d Mitochondrial segmentation illustrating the focus on individual mitochondria (purple) versus clusters (green) in neurons (left) and astrocytes (right). Scale bar: 10 µm. e Representative Mitotimer fluorescence images in neuronal neurites (left) and astrocytic processes (right) at baseline and > 60 h after ePHF-tau treatment. Red arrows indicate swollen, red mitochondria. Scale bar: 10 µm. f–t Comparative analysis of mitochondrial features in and between neurons and astrocytes. Each row represents a specific feature: fluorescence intensity at 555 nm (f, g, h), 488 nm (i, j, k), redox state (l, m, n), mitochondrial surface area (o, p, q), and mitochondrial count (r, s, t). The left columns (f, i, l, o, r) show the effects of ePHF-tau treatment (red lines) versus control (black lines) in neurons, the middle columns (g, j, m, p, s) depict the same comparison in astrocytes, and the right columns (h, k, n, q, t) compare neurons (blue lines) with astrocytes (green lines) relative to their respective controls. Gray bars in each graph represent -log(P-value) for comparisons at each time point on the right y-axis. Asterisks above the graphs indicate P-values for comparisons over entire days (means and SEM, *P < 0.05, **P < 0.01, ***P < 0.001, ****P < 0.0001)CC BY · PubMed Central
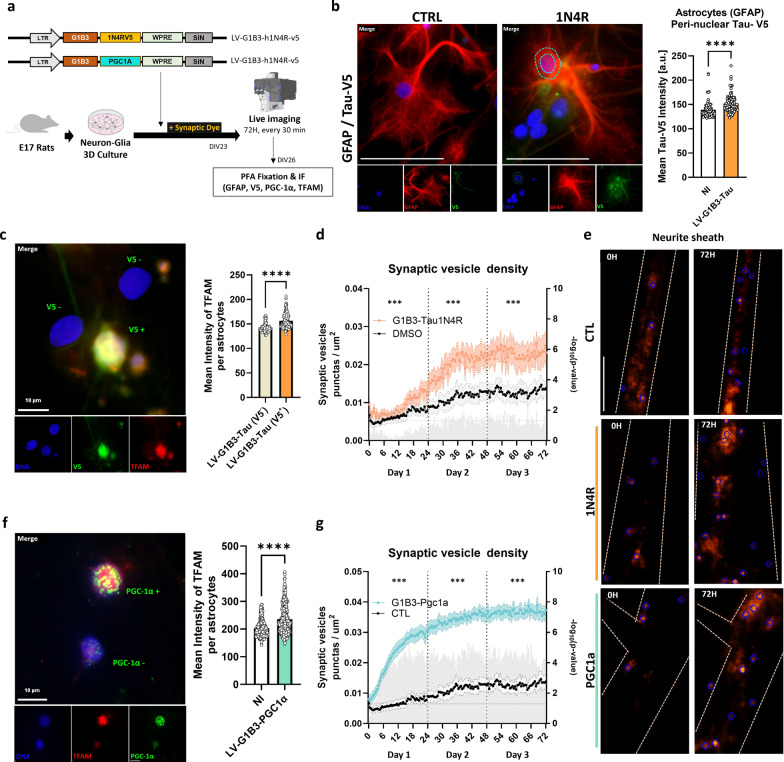
Fig. 5 Astrocytic modifications alone enhance synaptic vesicle density in neurons. a Experimental design: primary mixed cultures with astrocytes infected to overexpress WT human Tau-1N4R-V5 or PGC-1α were stained with a synaptic dye and imaged over 72 h in the presence of ePHF-tau. b Immunofluorescence images of astrocytes (GFAP) stained for Tau-V5 tag after 72 h treatment. Quantification of Tau-V5 intensity in peri-nuclear space of GFAP-positive cells is shown on the right. Scale bar, 50 μm; dashed blue line: peri-nuclear space. c Microscopic images of cultures infected with G1B3-Tau-1N4R-V5 and stained for V5 (green) and TFAM (red). Cells can be positive or negative for V5 expression (as displayed by text on merge image). Right, a bar plot of the quantification of the mean TFAM intensities in nucleus. d Time series of synaptic vesicle density in neurons co-cultured with G1B3-Tau-1N4R-V5 astrocytes (orange) versus DMSO-treated controls (black). Statistical comparisons for each time point (multiple t-tests) are shown as gray bar on the right Y-axis as -log(P-value) and statistical comparison for data subsets aggregated by day is shown with asterisks (*) above the graph. e Fluorescence images of synaptic dye at baseline and 72 h in control, 1N4R, and PGC-1α conditions, with blue circles marking segmented synaptic vesicle. Scale bar, 10 μm. f Same as (c) but with G1B3-PGC-1α infection of astrocytes. g Same as (d), with G1B3-PGC-1α infection of astrocytes. *P < 0.05, **P < 0.01, ***P < 0.001
Fig. 5 Astrocytic modifications alone enhance synaptic vesicle density in neurons. a Experimental design: primary mixed cultures with astrocytes infected to overexpress WT human Tau-1N4R-V5 or PGC-1α were stained with a synaptic dye and imaged over 72 h in the presence of ePHF-tau. b Immunofluorescence images of astrocytes (GFAP) stained for Tau-V5 tag after 72 h treatment. Quantification of Tau-V5 intensity in peri-nuclear space of GFAP-positive cells is shown on the right. Scale bar, 50 μm; dashed blue line: peri-nuclear space. c Microscopic images of cultures infected with G1B3-Tau-1N4R-V5 and stained for V5 (green) and TFAM (red). Cells can be positive or negative for V5 expression (as displayed by text on merge image). Right, a bar plot of the quantification of the mean TFAM intensities in nucleus. d Time series of synaptic vesicle density in neurons co-cultured with G1B3-Tau-1N4R-V5 astrocytes (orange) versus DMSO-treated controls (black). Statistical comparisons for each time point (multiple t-tests) are shown as gray bar on the right Y-axis as -log(P-value) and statistical comparison for data subsets aggregated by day is shown with asterisks (*) above the graph. e Fluorescence images of synaptic dye at baseline and 72 h in control, 1N4R, and PGC-1α conditions, with blue circles marking segmented synaptic vesicle. Scale bar, 10 μm. f Same as (c) but with G1B3-PGC-1α infection of astrocytes. g Same as (d), with G1B3-PGC-1α infection of astrocytes. *P < 0.05, **P < 0.01, ***P < 0.001CC BY · PubMed Central

Verification

Claims the paper makes

The claims and statistics of this paper haven’t been checked yet.

Run the check — free, no account needed. It reads the open-access text and checks the sources it cites.

A few free checks a day · papers already verified open instantly · results are public

Self-check

Percentages, sums and reported differences re-computed from the paper’s own numbers.

The self-check needs the paper’s full text.

Citations

Cites

Show all 1 references

Research works printed but not linked: 33

  1. Pidara I, Yamada K. The Structure of Tau Proteins and Its Role in Neurodegenerative Disease. FASEB J [Internet]. 2022;36. https://onlinelibrary.wiley.com/doi/full/10.1096/fasebj.2022.36.S1.R4663. · DOI
  2. Olfati N, Shoeibi A, Litvan I. Clinical Spectrum of Tauopathies. Front Neurol [Internet]. 2022;13. https://pubmed.ncbi.nlm.nih.gov/35911892/.
  3. Rösler TW, Tayaranian Marvian A, Brendel M, Nykänen NP, Höllerhage M, Schwarz SC et al. Four-repeat tauopathies. Prog Neurobiol [Internet]. 2019 [cited 2020 Jul 7];180:101644. https://pubmed.ncbi.nlm.nih.gov/31238088/.
  4. Gerando AM, De, Welikovitch LA, Khasnavis A, Commins C, Glynn C, Chun JE, et al. Tau seeding and spreading in vivo is supported by both AD-derived fibrillar and oligomeric tau. Acta Neuropathol. 2023;146:191. · DOI
  5. Vogel JW, Iturria-Medina Y, Strandberg OT, Smith R, Levitis E, Evans AC et al. Spread of pathological tau proteins through communicating neurons in human Alzheimer's disease. Nat Commun. 2020;11. · DOI
  6. Varghese M, Santa-Maria I, Ho L, Ward L, Yemul S, Dubner L, et al. Extracellular Tau Paired Helical Filaments Differentially Affect Tau Pathogenic Mechanisms in Mitotic and Post-Mitotic Cells: Implications for Mechanisms of Tau Propagation in the Brain. J Alzheimers Dis. 2016;54:477–96. · DOI
  7. Tejeda HA, Wu J, Kornspun AR, Pignatelli M, Kashtelyan V, Krashes MJ et al. Pathway- and Cell-Specific Kappa-Opioid Receptor Modulation of Excitation-Inhibition Balance Differentially Gates D1 and D2 Accumbens Neuron Activity. Neuron [Internet]. 2017;93:147–63. https://pubmed.ncbi.nlm.nih.gov/28056342/.
  8. Richetin K, Steullet P, Pachoud M, Perbet R, Parietti E, Maheswaran M, et al. Tau accumulation in astrocytes of the dentate gyrus induces neuronal dysfunction and memory deficits in Alzheimer's disease. Nat Neurosci. 2020;23:1567–79. · DOI
  9. Perbet R, Zufferey V, Leroux E, Parietti E, Espourteille J, Culebras L et al. Tau Transfer via Extracellular Vesicles Disturbs the Astrocytic Mitochondrial System. Cells [Internet]. 2023;12. /pmc/articles/PMC10093208/.
  10. Schwab LCCL, Richetin K, Barker RARARA, Déglon N, D??glon N, Déglon N. Formation of hippocampal mHTT aggregates leads to impaired spatial memory, hippocampal activation and adult neurogenesis. Neurobiol Dis [Internet]. 2017;102:105–12. http://linkinghub.elsevier.com/retrieve/pii/S0969996117300529.
  11. Nakano M, Imamura H, Nagai T, Noji H. Ca(2+) regulation of mitochondrial ATP synthesis visualized at the single cell level. ACS Chem Biol [Internet]. 2011;6:709–15. http://dx.doi.org/10.1021/cb100313n. · DOI
  12. Tyanova S, Temu T, Sinitcyn P, Carlson A, Hein MY, Geiger T, et al. The Perseus computational platform for comprehensive analysis of (prote)omics data. Nat Methods. 2016;13:731–40. · DOI · Paper page
  13. Aleksander SA, Balhoff J, Carbon S, Cherry JM, Drabkin HJ, Ebert D et al. The Gene Ontology knowledgebase in 2023. Genetics. 2023;224.
  14. Ashburner M, Ball CA, Blake JA, Botstein D, Butler H, Cherry JM, et al. Gene ontology: tool for the unification of biology. The Gene Ontology Consortium. Nat Genet. 2000;25:25–9. · DOI · Paper page
  15. Rath S, Sharma R, Gupta R, Ast T, Chan C, Durham TJ et al. MitoCarta3.0: an updated mitochondrial proteome now with sub-organelle localization and pathway annotations. Nucleic Acids Res [Internet]. 2021;49:D1541–7. https://pubmed.ncbi.nlm.nih.gov/33174596/.
  16. Calvo SE, Clauser KR, Mootha VK. MitoCarta2.0: an updated inventory of mammalian mitochondrial proteins. Nucleic Acids Res [Internet]. 2016;44:D1251–7. https://pubmed.ncbi.nlm.nih.gov/26450961/.
  17. Cox J, Mann M. 1D and 2D annotation enrichment: a statistical method integrating quantitative proteomics with complementary high-throughput data. BMC Bioinformatics. 2012;13 Suppl 1.
  18. Courade J-P, Angers R, Mairet-Coello G, Pacico N, Tyson K, Lightwood D et al. Epitope determines efficacy of therapeutic anti-Tau antibodies in a functional assay with human Alzheimer Tau. 2018;136:729–45.
  19. Karahuseyinoglu S, Sekerdag E, Aria MM, Cetin Tas Y, Nizamoglu S, Solaroglu I, et al. Three-dimensional neuron–astrocyte construction on matrigel enhances establishment of functional voltage-gated sodium channels. J Neurochem. 2021;156:848–66. · DOI
  20. Espourteille J, Zufferey V, Laurent J-H, Richetin K. Live-imaging of Mitochondrial System in Cultured Astrocytes. J Vis Exp [Internet]. 2021 [cited 2022 Jan 28]; https://pubmed.ncbi.nlm.nih.gov/34866623/.
  21. Robbins M, Clayton E, Kaminski Schierle GS. Synaptic tau: A pathological or physiological phenomenon? Acta Neuropathol Commun. 2021;9:1–30. · DOI
  22. Ondrejcak T, Hu NW, Qi Y, Klyubin I, Corbett GT, Fraser G, et al. Soluble tau aggregates inhibit synaptic long-term depression and amyloid β-facilitated LTD in vivo. Neurobiol Dis. 2019;127:582–90. · DOI
  23. Zhou L, Mcinnes J, Wierda K, Holt M, Herrmann AG, Jackson RJ et al. ARTICLE Tau association with synaptic vesicles causes presynaptic dysfunction. Nat Commun [Internet]. 2017 [cited 2024 Mar 4];8. Available from: www.nature.com/naturecommunications.
  24. Italia M, Ferrari E, Diluca M, Gardoni F. NMDA and AMPA Receptors at Synapses: Novel Targets for Tau and α-Synuclein Proteinopathies. Biomedicines. 2022;10. · DOI
  25. Tai HC, Wang BY, Serrano-Pozo A, Frosch MP, Spires-Jones TL, Hyman BT. Frequent and symmetric deposition of misfolded tau oligomers within presynaptic and postsynaptic terminals in Alzheimer's disease. Acta Neuropathol Commun. 2014;2:1–14.
  26. García-Cabrero AM, Guerrero-López R, Giráldez BG, Llorens-Martín M, Ávila J, Serratosa JM, et al. Hyperexcitability and epileptic seizures in a model of frontotemporal dementia. Neurobiol Dis. 2013;58:200–8. · DOI
  27. Amadoro G, Corsetti V, Stringaro A, Colone M, D'Aguanno S, Meli G, et al. A NH 2 Tau Fragment Targets Neuronal Mitochondria at A.D. Synapses: Possible Implications for Neurodegeneration. J Alzheimer's Dis. 2010;21:445–70. · DOI
  28. Britti E, Ros J, Esteras N, Abramov AY. Tau inhibits mitochondrial calcium efflux and makes neurons vulnerable to calcium-induced cell death. Cell Calcium. 2020;86:102150. · DOI
  29. Reid MJ, Beltran-Lobo P, Johnson L, Perez-Nievas BG, Noble W. Astrocytes in Tauopathies. Front Neurol [Internet]. 2020;11:572850. Available from: www.frontiersin.org. · DOI
  30. Göbel J, Motori E, Bergami M. Spatiotemporal control of mitochondrial network dynamics in astroglial cells. Biochem Biophys Res Commun [Internet]. 2017;1–9. http://linkinghub.elsevier.com/retrieve/pii/S0006291X17313220.
  31. Motori E, Puyal J, Toni N, Ghanem A, Angeloni C, Malaguti M et al. Inflammation-induced alteration of astrocyte mitochondrial dynamics requires autophagy for mitochondrial network maintenance. Cell Metab [Internet]. 2013 [cited 2017 Aug 23];18:844–59. http://linkinghub.elsevier.com/retrieve/pii/S1550413113004543.
  32. Hayakawa K, Esposito E, Wang X, Terasaki Y, Liu Y, Xing C et al. Transfer of mitochondria from astrocytes to neurons after stroke. Nature [Internet]. 2016;539:551–5. http://www.nature.com/doifinder/10.1038/nature19805. · DOI
  33. Scheiblich H, Dansokho C, Mercan D, Schmidt SV, Bousset L, Wischhof L et al. Microglia jointly degrade fibrillar alpha-synuclein cargo by distribution through tunneling nanotubes. Cell [Internet]. 2021;184:5089–5106.e21. https://doi.org/10.1016/j.cell.2021.09.007. · DOI · Paper page

Metadata

Authors
Zufferey, V., Parietti, E., Barve, A., Espourteille, J., Varisco, Y., Fabbri, K., Capotosti, F., Preitner, N., & Richetin, K.
Affiliations
  • Centre Hospitalier Universitaire Vaudois (CH)
  • CHUV: Centre Hospitalier Universitaire Vaudois
  • AC Immune (Switzerland) (CH)
Corresponding author
Richetin, Kevin
Venue
Translational Neurodegeneration
Published
2024-05-15
Volume
14
Issue
1
Pages
13-13
ISSN
2047-9158 (ISSN-L)
OpenAlex
W4408758325
Cited by
9
References
1
Citations by year
2026: 6 · 2025: 3
FWCI
5.79
Type
journal article
Language
en
Open access
Locations
  • Translational Neurodegeneration (publishedVersion, cc-by)
  • Research Square (acceptedVersion, cc-by)
  • Europe PMC (PubMed Central) (publishedVersion, cc-by)
  • PubMed Central (publishedVersion, cc-by)
  • PubMed (publishedVersion)
  • SERVAL (Université de Lausanne) (publishedVersion, cc-by)
  • IRIS (submittedVersion, cc-by)
  • DOAJ (DOAJ: Directory of Open Access Journals) (submittedVersion, cc-by-sa)
  • IRIS Research product catalog (Sapienza University of Rome) (submittedVersion, cc-by)
Funders
  • Novartis Foundation
  • Lawson Foundation
  • Université de Lausanne
  • Centre Hospitalier Universitaire Vaudois
  • Stiftung Synapsis - Alzheimer Forschung Schweiz AFS
  • Novartis Institutes for BioMedical Research (23B126)
Topics
  • Life Sciences › Neuroscience › Cellular and Molecular Neuroscience › Alzheimer's disease research and treatments
  • Life Sciences › Neuroscience › Neurology › Neuroinflammation and Neurodegeneration Mechanisms
  • Life Sciences › Biochemistry, Genetics and Molecular Biology › Molecular Biology › Mitochondrial Function and Pathology
Keywords
extracellular tau, paired helical filaments, astrocytes, mitochondrial dynamics, mitochondrial biogenesis, neuronal connectivity, synaptic vesicle formation, active zone, PGC-1α, tauopathy, neurodegeneration, astrocyte-neuron co-culture, synaptosomes, mitochondrial proteomics
MeSH terms
Animals, Astrocytes, Cells, Cultured, Humans, Mitochondria, Neurons, Synapses, tau Proteins, Coculture Techniques, Rats, Mitochondrial Dynamics

About these checks

Registry, retraction, Cites and statistics results are computed, not judged, with one exception: a printed reference that no index lists is read once by a model before it counts as a citation error. Claims are extracted by a model and kept only when their quote appears verbatim in the text; each cited source is then checked, with a model’s help, for whether it says what the claim relies on. Those verdicts can be wrong — read the claim’s quote and the cited source before relying on one.

Statistics and arithmetic are recomputed, not judged.

Confidence bands are shown only for fields calibrated on our annotated test set. None is calibrated yet, so no band is shown.

What counts as a claim ›How we measure confidence ›How we check this ›

Are you an author, or do you see a problem with this page? Request a review

How to cite

Cite CoChat for the checks on this page, and the paper for its own findings.

This page
CoChat. (2026). Citation check: Divergent consequences of Extracellular tau on the mitochondrial function of astrocytes and neurons. https://app.cochat.ai/papers/10.21203/rs.3.rs-4306467/v1
The paper
Zufferey, V., Parietti, E., Barve, A., Espourteille, J., Varisco, Y., Fabbri, K., Capotosti, F., Preitner, N., & Richetin, K. (2024). Divergent consequences of Extracellular tau on the mitochondrial function of astrocytes and neurons. Translational Neurodegeneration. https://doi.org/10.21203/rs.3.rs-4306467/v1