Student or educator? Sign up with your school email and get 6 months of Pro free.
PreprintCited by 7Carbohydrate Chemistry and SynthesisEnzyme Catalysis and ImmobilizationEnzyme Production and Characterization

The DOI matches its Crossref record; 1 of the 1 references it cites were found in a registry or an index.

Discovery of Solabiose Phosphorylase and its Application for Enzymatic Synthesis of Solabiose from Sucrose and Lactose

Open access
Saburi, Wataru, Nihira, Takanori, Nakai, Hiroyuki, Kitaoka, Motomitsu, Mori, Haruhide·2021·Scientific Reports

Preprint — published as 10.1038/s41598-021-04421-2 · Paper page

Abstract

Glycoside phosphorylases (GPs), which catalyze the reversible phosphorolysis of glycosides, are promising enzymes for the efficient production of glycosides. Various GPs with new catalytic activities, derived from uncharacterized proteins phylogenetically distant from known enzymes, have been discovered in the past decade. In this study, we characterized the PBOR_28850 protein, belonging to glycoside hydrolase family 94, from Paenibacillus borealis. Screening of acceptor substrates for reverse phosphorolysis using α-d-glucose 1-phosphate as the donor substrate revealed that the recombinant PBOR_28850 produced in Escherichia coli specifically utilized d-galactose as an acceptor and produced solabiose (b-d-Glc p-(1→3)-d-Gal). This indicates that PBOR_28850 is a new GP, solabiose phosphorylase. PBOR_28850 catalyzed the phosphorolysis and synthesis of solabiose through a sequential bi-bi mechanism involving the formation of a ternary complex. The production of solabiose from lactose and sucrose has been established. Lactose was hydrolyzed to d-galactose and d-glucose by β-galactosidase. Phosphorolysis of sucrose and synthesis of solabiose were then coupled by adding sucrose, sucrose phosphorylase, and PBOR_28850 to the reaction mixture. Using 210 mmol lactose and 280 mmol sucrose, 207 mmol of solabiose was produced. Yeast treatment degraded the remaining monosaccharides and sucrose without reducing solabiose. Solabiose with a purity of 93.7% was obtained without any chromatographic procedures.

Overview

The claims and statistics of this paper haven’t been checked yet.

Run the check — free, no account needed. It reads the open-access text and checks the sources it cites.

A few free checks a day · papers already verified open instantly · results are public

Integrity signals

Registry

Crossref · 10.21203/rs.3.rs-955939/v1

Cites

1 of 1 references verified0 citation errors · 0 not checkable

Statistics

Figures

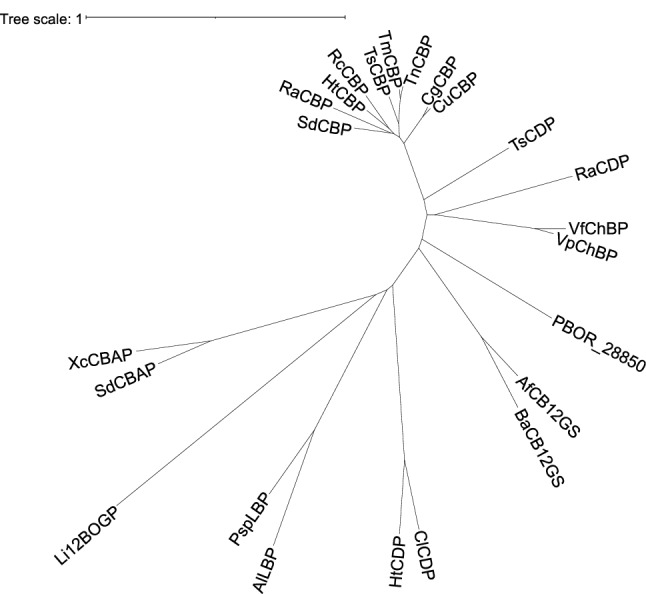
Figure 1 Phylogenetic tree of GH94 enzymes. Multiple sequence alignment was carried out by MAFFT31, and phylogenetic tree was constructed using Interactive Tree of Life version 5.7 (https://itol.embl.de). SdCBP, Saccharophagus degradans CBP (ABD80580.1); RaCBP, Ruminococcus albus CBP (ADU20744.1); HtCBP, Hungateiclostridium thermocellum CBP (ABN51514.1); RcCBP, Ruminiclostridium cellulolyticum CBP (ACL76454.1); TsCBP, Thermoclostridium stercorarium CBP (AAC45510.1); TmCBP, Thermotoga maritima CBP (AAD36910.1); TnCBP, Thermotoga neapolitana CBP (AAB95491.2); CgCBP, Cellulomonas gilvus CBP (BAA28631.1); CuCBP, Cellulomonas uda CBP (AAQ20920.1); TsCDP, T. stercorarium CDP (AAC45511.1); RaCDP, R. albus CDP (ADU22883.1); VfChBP, Vibrio furnissii ChBP (AAG23740.1); VpChBP, Vibrio proteolyticus ChBP (BAC87867.1); AfCB12GS, Agrobacterium fabrum CB12GS (AAK73356.1); BaCB12GS, Brucella abortus CB12GS (ACD71661.1); ClCDP, Cellulosilyticum lentocellum CDP (ADZ85667.1); HtCDP, H. thermocellum CDP (ABN54185.1); AlLBP, Acholeplasma laidlawii LBP (ABX81345.1); PspLBP, Paenibacillus sp. YM1 LBP (BAJ10826.1); Li12BOGP, Listerila innocua 12BOGP; SdCBAP, S. degradans CBAP (ABD80168.1); XcCBAP, Xanthomonas campestris CBAP (AAM43298.1). GenBank accession numbers are shown in parenthesis.
Figure 1 Phylogenetic tree of GH94 enzymes. Multiple sequence alignment was carried out by MAFFT31, and phylogenetic tree was constructed using Interactive Tree of Life version 5.7 (https://itol.embl.de). SdCBP, Saccharophagus degradans CBP (ABD80580.1); RaCBP, Ruminococcus albus CBP (ADU20744.1); HtCBP, Hungateiclostridium thermocellum CBP (ABN51514.1); RcCBP, Ruminiclostridium cellulolyticum CBP (ACL76454.1); TsCBP, Thermoclostridium stercorarium CBP (AAC45510.1); TmCBP, Thermotoga maritima CBP (AAD36910.1); TnCBP, Thermotoga neapolitana CBP (AAB95491.2); CgCBP, Cellulomonas gilvus CBP (BAA28631.1); CuCBP, Cellulomonas uda CBP (AAQ20920.1); TsCDP, T. stercorarium CDP (AAC45511.1); RaCDP, R. albus CDP (ADU22883.1); VfChBP, Vibrio furnissii ChBP (AAG23740.1); VpChBP, Vibrio proteolyticus ChBP (BAC87867.1); AfCB12GS, Agrobacterium fabrum CB12GS (AAK73356.1); BaCB12GS, Brucella abortus CB12GS (ACD71661.1); ClCDP, Cellulosilyticum lentocellum CDP (ADZ85667.1); HtCDP, H. thermocellum CDP (ABN54185.1); AlLBP, Acholeplasma laidlawii LBP (ABX81345.1); PspLBP, Paenibacillus sp. YM1 LBP (BAJ10826.1); Li12BOGP, Listerila innocua 12BOGP; SdCBAP, S. degradans CBAP (ABD80168.1); XcCBAP, Xanthomonas campestris CBAP (AAM43298.1). GenBank accession numbers are shown in parenthesis.CC BY · PubMed Central
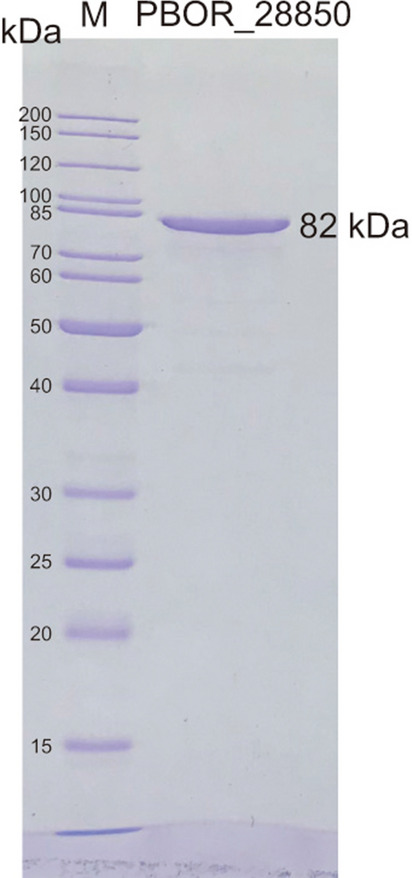
Figure 2 SDS-PAGE of purified PBOR_28850. One microgram of purified PBOR_28850 was analyzed. Lane M, standard of molecular mass. The image of the upper and lower parts of the gel was cropped. The gel image was cropped vertically to eliminate redundant part, but not horizontally. Unprocessed image is shown in Supplementary Fig. S1.
Figure 2 SDS-PAGE of purified PBOR_28850. One microgram of purified PBOR_28850 was analyzed. Lane M, standard of molecular mass. The image of the upper and lower parts of the gel was cropped. The gel image was cropped vertically to eliminate redundant part, but not horizontally. Unprocessed image is shown in Supplementary Fig. S1.CC BY · PubMed Central
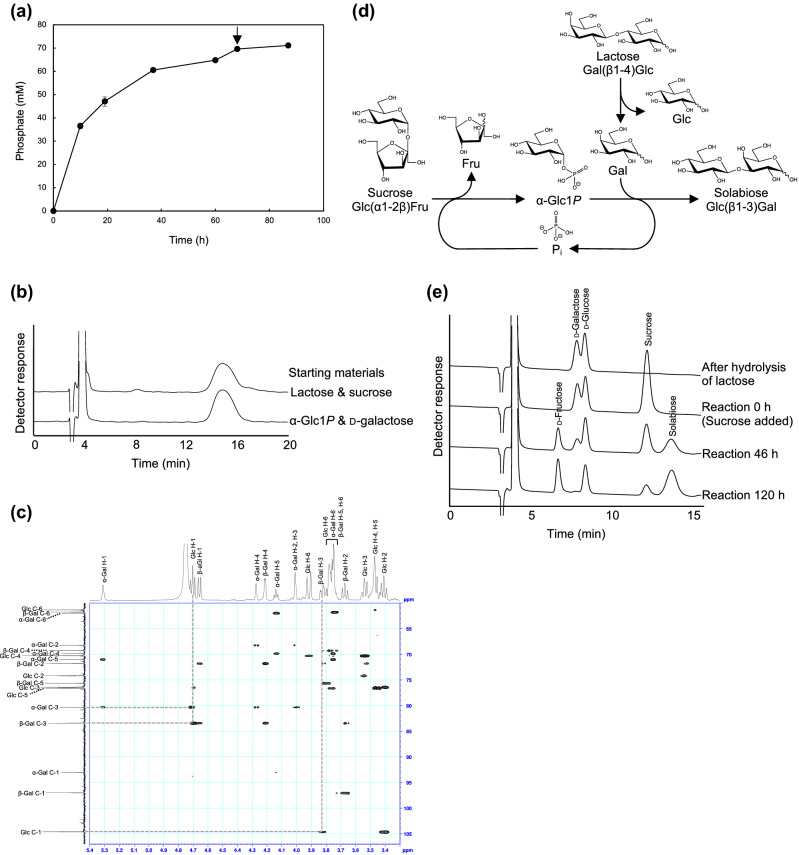
Figure 3 Enzymatic synthesis of solabiose. (a) Reaction time course of the reaction of PBOR_28850 with 100 mM α-Glc1P and d-galactose. Arrow indicates the time of adding the additional enzyme. Values and error bars indicate average and standard deviation for three independent experiments, respectively. (b) HPLC elution profile of solabiose prepared from α-Glc1P and d-galactose and from lactose and sucrose. (c) Heteronuclear multiple bond correlation spectroscopy analysis of solabiose produced from α-Glc1P and d-galactose. Dotted line indicates correlation signals between β-d-glucosyl residue and d-galactose residue. (d) Reaction scheme of enzymatic synthesis of solabiose from lactose and sucrose. β-Galactosidase hydrolyzes lactose to d-galactose and d-glucose. SP phosphorolyzes sucrose to α-Glc1P and d-fructose. α-Glc1P and d-galactose are used in the reverse phosphorolysis catalyzed by PBOR_28850 to produce solabiose. Inorganic phosphate used in the phosphorolysis of sucrose is generated in the reverse phosphorolysis of solabiose. (e) HPLC elution profile of the reaction samples.
Figure 3 Enzymatic synthesis of solabiose. (a) Reaction time course of the reaction of PBOR_28850 with 100 mM α-Glc1P and d-galactose. Arrow indicates the time of adding the additional enzyme. Values and error bars indicate average and standard deviation for three independent experiments, respectively. (b) HPLC elution profile of solabiose prepared from α-Glc1P and d-galactose and from lactose and sucrose. (c) Heteronuclear multiple bond correlation spectroscopy analysis of solabiose produced from α-Glc1P and d-galactose. Dotted line indicates correlation signals between β-d-glucosyl residue and d-galactose residue. (d) Reaction scheme of enzymatic synthesis of solabiose from lactose and sucrose. β-Galactosidase hydrolyzes lactose to d-galactose and d-glucose. SP phosphorolyzes sucrose to α-Glc1P and d-fructose. α-Glc1P and d-galactose are used in the reverse phosphorolysis catalyzed by PBOR_28850 to produce solabiose. Inorganic phosphate used in the phosphorolysis of sucrose is generated in the reverse phosphorolysis of solabiose. (e) HPLC elution profile of the reaction samples.CC BY · PubMed Central
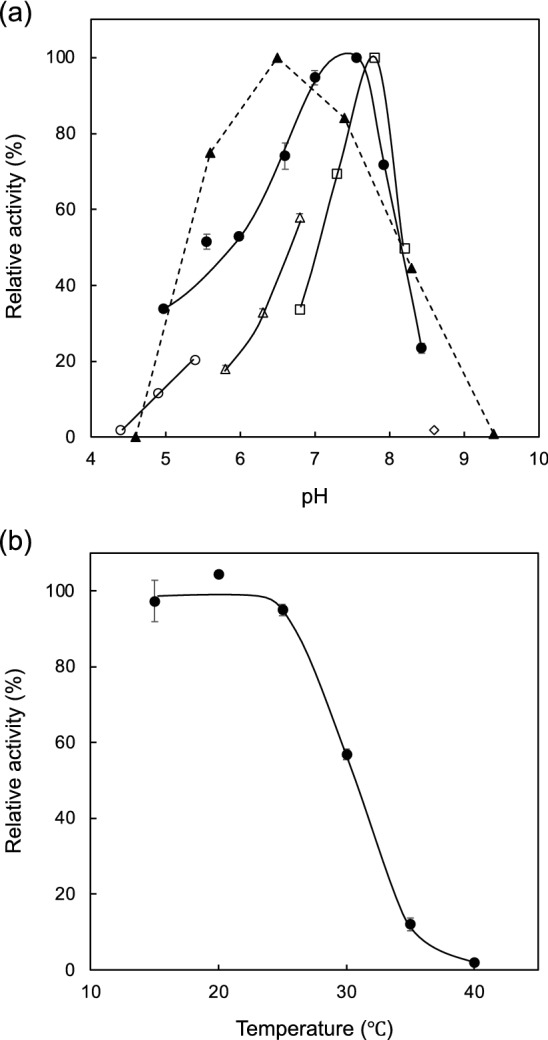
Figure 4 Effects of pH and temperature. (a) Effect of pH. Closed circles show activity of the phosphorolysis. Open symbols indicate activity of reverse phosphorolysis. Circles, triangles, squares, and diamond show the reaction in sodium acetate buffer, MES-NaOH buffer, HEPES–NaOH buffer, and glycine–NaOH buffer, respectively. Closed triangles show residual activity after the pH treatment at pH 4.6–9.4 at 4 °C for 24 h. (b) Temperature stability. Residual activity after the heat treatment at 15–40 °C for 15 min is shown. Values and error bars indicate average and standard deviation for three independent experiments, respectively.
Figure 4 Effects of pH and temperature. (a) Effect of pH. Closed circles show activity of the phosphorolysis. Open symbols indicate activity of reverse phosphorolysis. Circles, triangles, squares, and diamond show the reaction in sodium acetate buffer, MES-NaOH buffer, HEPES–NaOH buffer, and glycine–NaOH buffer, respectively. Closed triangles show residual activity after the pH treatment at pH 4.6–9.4 at 4 °C for 24 h. (b) Temperature stability. Residual activity after the heat treatment at 15–40 °C for 15 min is shown. Values and error bars indicate average and standard deviation for three independent experiments, respectively.CC BY · PubMed Central
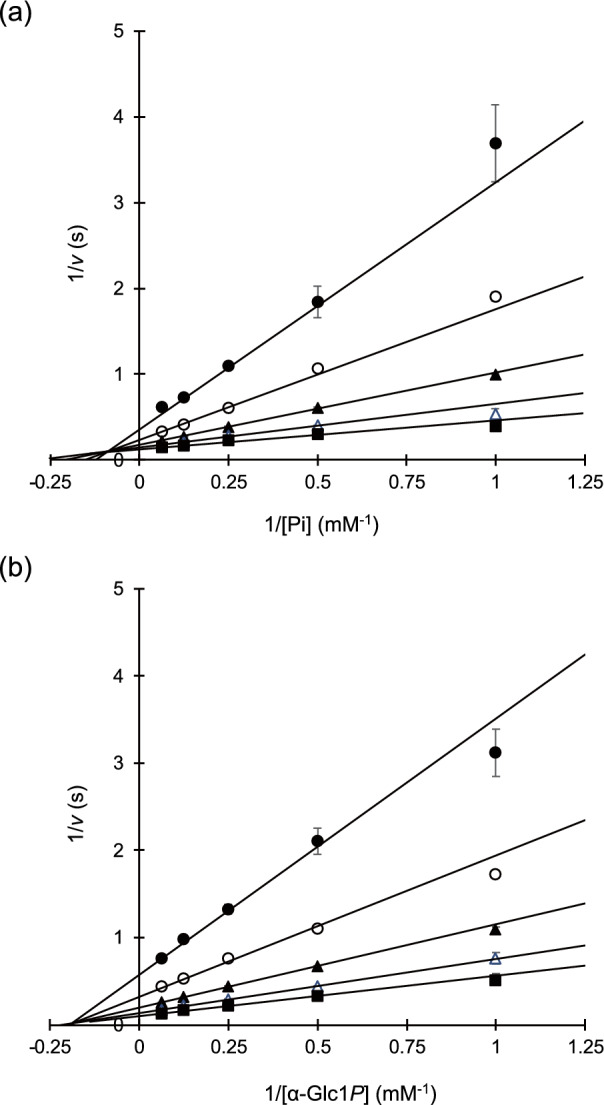
Figure 5 Double reciprocal plots for the phosphorolysis and synthesis of solabiose. (a) Phosphoroylsis of solabiose. Reaction rates at 1, 2, 4, 8, and 16 mM inorganic phosphate in the presence of 1 (filled circles), 2 (open circles), 4 (filled triangles), 8 (open triangles), and 16 mM solabiose (filled squares) are shown. (b) Synthesis of solabiose. Reaction rates at 1, 2, 4, 8, and 16 mM α-Glc1P in the presence of 1 mM (filled circles), 2 mM (open circles), 4 mM (filled triangles), 8 mM (open triangles), and 16 mM d-galactose (filled squares) are shown. Average of three independent experimental values are plotted. Error bars indicate standard deviation of the values.
Figure 5 Double reciprocal plots for the phosphorolysis and synthesis of solabiose. (a) Phosphoroylsis of solabiose. Reaction rates at 1, 2, 4, 8, and 16 mM inorganic phosphate in the presence of 1 (filled circles), 2 (open circles), 4 (filled triangles), 8 (open triangles), and 16 mM solabiose (filled squares) are shown. (b) Synthesis of solabiose. Reaction rates at 1, 2, 4, 8, and 16 mM α-Glc1P in the presence of 1 mM (filled circles), 2 mM (open circles), 4 mM (filled triangles), 8 mM (open triangles), and 16 mM d-galactose (filled squares) are shown. Average of three independent experimental values are plotted. Error bars indicate standard deviation of the values.CC BY · PubMed Central
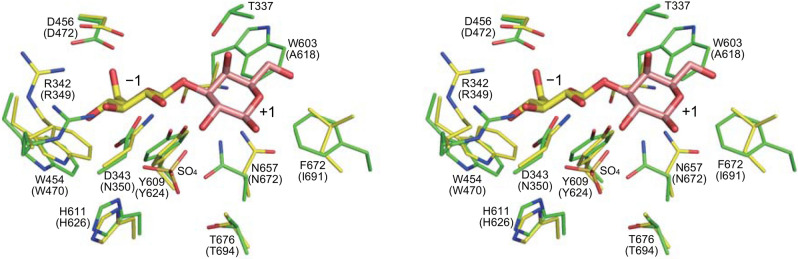
Figure 6 Predicted structure of PBOR_28850. Structure of PBOR_28850 was predicted by AlphaFold26. The model structure of PBOR_28850 (green) is superimposed onto S. degradans CBAP in complex with 3-O-β-d-glucopyranosyl-α-d-glucopyranuronic acid (yellow; PDB entry, 4ZLI). To predict the binding mode of solabiose in PBOR_28850, β-d-galactose in ideal form (PDB entry, GAL), shown in pale orange, is overlapped onto the α-d-glucopyranuronic acid residue (α-d-glucopyranuronic acid residue is not shown).
Figure 6 Predicted structure of PBOR_28850. Structure of PBOR_28850 was predicted by AlphaFold26. The model structure of PBOR_28850 (green) is superimposed onto S. degradans CBAP in complex with 3-O-β-d-glucopyranosyl-α-d-glucopyranuronic acid (yellow; PDB entry, 4ZLI). To predict the binding mode of solabiose in PBOR_28850, β-d-galactose in ideal form (PDB entry, GAL), shown in pale orange, is overlapped onto the α-d-glucopyranuronic acid residue (α-d-glucopyranuronic acid residue is not shown).CC BY · PubMed Central
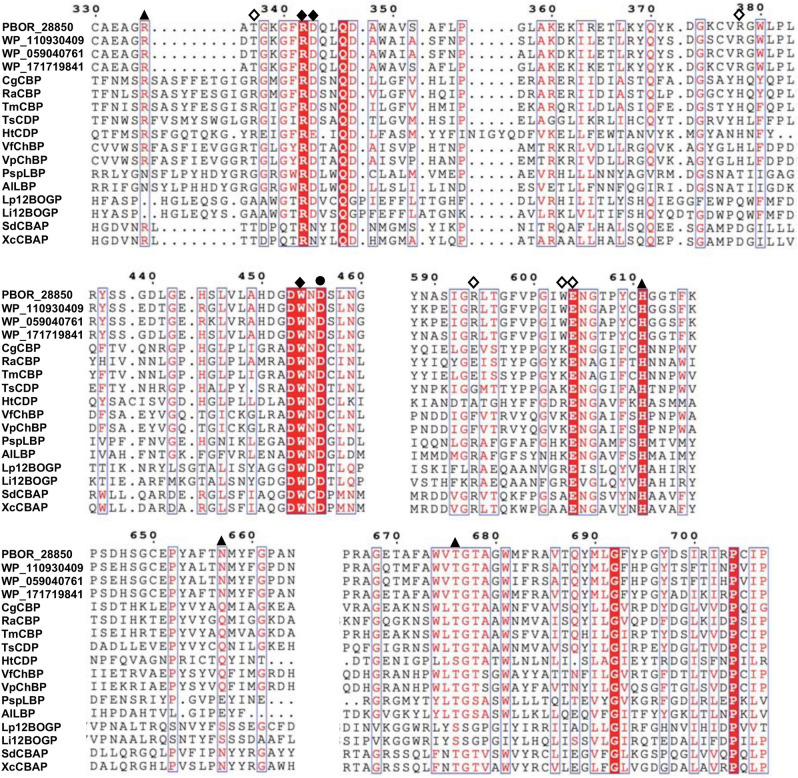
Figure 7 Comparison of amino acid sequences of GH94 enzymes. Multiple sequence alignment was constructed using MAFFT-DASH31. Filled circle indicates the general acid catalyst for the phosphorolysis of substrates. The residues shown by filled triangles are responsible for binding to phosphate. Filled and open diamonds indicate residues involved in the formation of subsites −1 and + 1, respectively. Amino acid numbers of PBOR_28850 are shown above the figure. WP_110930409, WP_059040761, and WP_WP_171719841 from P. bouchesdurhonensis, P. rubinfantis, and P. phytohabitans, respectively, are homologues of PBOR_28850. CgCBP, C. gilvus CBP; RaCBP, R. albus CBP; TmCBP, T. maritima CBP; TsCDP, T. stercorarium CDP; HtCDP, H. thermocellum CDP; VfChBP, V. furnissii ChBP; VpChBP, V. proteolyticus ChBP; PspLBP, Paenibacillus sp. YM1 LBP; AlLBP, A. laidlawii LBP; Lp12BOGP, Lachnoclostridium phytofermentans 12BOGP (GenBank number, ABX41081.1); Li12BOGP, L. innocua 12BOGP; SdCBAP, S. degradans CBAP; and XcCBAP, X. campestris CBAP.
Figure 7 Comparison of amino acid sequences of GH94 enzymes. Multiple sequence alignment was constructed using MAFFT-DASH31. Filled circle indicates the general acid catalyst for the phosphorolysis of substrates. The residues shown by filled triangles are responsible for binding to phosphate. Filled and open diamonds indicate residues involved in the formation of subsites −1 and + 1, respectively. Amino acid numbers of PBOR_28850 are shown above the figure. WP_110930409, WP_059040761, and WP_WP_171719841 from P. bouchesdurhonensis, P. rubinfantis, and P. phytohabitans, respectively, are homologues of PBOR_28850. CgCBP, C. gilvus CBP; RaCBP, R. albus CBP; TmCBP, T. maritima CBP; TsCDP, T. stercorarium CDP; HtCDP, H. thermocellum CDP; VfChBP, V. furnissii ChBP; VpChBP, V. proteolyticus ChBP; PspLBP, Paenibacillus sp. YM1 LBP; AlLBP, A. laidlawii LBP; Lp12BOGP, Lachnoclostridium phytofermentans 12BOGP (GenBank number, ABX41081.1); Li12BOGP, L. innocua 12BOGP; SdCBAP, S. degradans CBAP; and XcCBAP, X. campestris CBAP.CC BY · PubMed Central

Verification

Claims the paper makes

The claims and statistics of this paper haven’t been checked yet.

Run the check — free, no account needed. It reads the open-access text and checks the sources it cites.

A few free checks a day · papers already verified open instantly · results are public

Self-check

Percentages, sums and reported differences re-computed from the paper’s own numbers.

The self-check needs the paper’s full text.

Citations

Cites

Metadata

Authors
Saburi, W., Nihira, T., Nakai, H., Kitaoka, M., & Mori, H.
Affiliations
  • Hokkaido University (JP)
  • Niigata University (JP)
Corresponding author
Saburi, Wataru
Venue
Scientific Reports
Published
2021-10-20
Volume
12
Issue
1
Pages
259-259
ISSN
2045-2322 (ISSN-L)
OpenAlex
W4226055960
Cited by
7
References
1
Citations by year
2025: 2 · 2024: 3 · 2022: 2
FWCI
0.67
Type
journal article
Language
en
Open access
Locations
  • Scientific Reports (publishedVersion, cc-by)
  • Research Square (acceptedVersion, cc-by)
  • PubMed Central (publishedVersion, cc-by)
  • PubMed (publishedVersion)
  • DOAJ (DOAJ: Directory of Open Access Journals) (submittedVersion, cc-by-sa)
  • Hokkaido University Collection of Scholarly and Academic Papers (Hokkaido University) (submittedVersion)
  • Institutional Repositories DataBase (IRDB) (submittedVersion)
Funders
  • Hokkaido University
  • Japan Society for the Promotion of Science (19K22263)
Topics
  • Physical Sciences › Chemistry › Organic Chemistry › Carbohydrate Chemistry and Synthesis
  • Life Sciences › Biochemistry, Genetics and Molecular Biology › Molecular Biology › Enzyme Catalysis and Immobilization
  • Life Sciences › Biochemistry, Genetics and Molecular Biology › Biotechnology › Enzyme Production and Characterization
Keywords
sucrose, lactose, sucrose phosphorylase, ternary complex, beta-galactosidase
MeSH terms
Bacterial Proteins, Binding Sites, Catalysis, Disaccharides, Phosphorylases, Hydrolysis, Kinetics, Lactose, Substrate Specificity, Sucrose, Catalytic Domain, Paenibacillus

About these checks

Registry, retraction, Cites and statistics results are computed, not judged, with one exception: a printed reference that no index lists is read once by a model before it counts as a citation error. Claims are extracted by a model and kept only when their quote appears verbatim in the text; each cited source is then checked, with a model’s help, for whether it says what the claim relies on. Those verdicts can be wrong — read the claim’s quote and the cited source before relying on one.

Statistics and arithmetic are recomputed, not judged.

Confidence bands are shown only for fields calibrated on our annotated test set. None is calibrated yet, so no band is shown.

What counts as a claim ›How we measure confidence ›How we check this ›

Are you an author, or do you see a problem with this page? Request a review

Data sources

Bibliographic data: Semantic Scholar, OpenAlex, Crossref.

Contains information from the Semantic Scholar Academic Graph Datasets, made available under the ODC Attribution License (ODC-BY 1.0).

Semantic Scholar’s data is described in: Kinney, R., et al. (2023). The Semantic Scholar Open Data Platform. arXiv:2301.10140.