

Understanding Marginal Structural Models for Time-Varying Exposures: Pitfalls and Tips
Open accessThe DOI matches its Crossref record; 81 of the 82 references it cites were found in a registry or an index.
Abstract
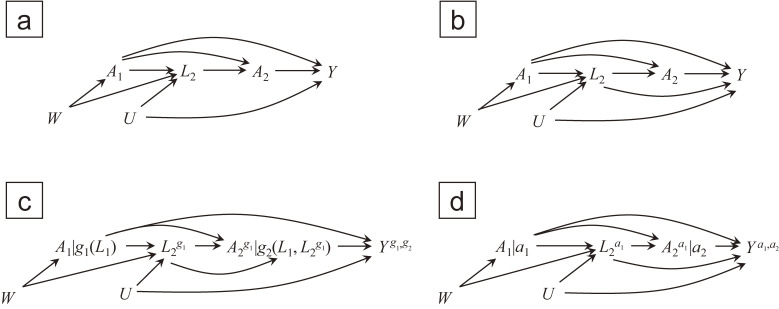
Epidemiologists are increasingly encountering complex longitudinal data, in which exposures and their confounders vary during follow-up. When a prior exposure affects the confounders of the subsequent exposures, estimating the effects of the time-varying exposures requires special statistical techniques, possibly with structural (ie, counterfactual) models for targeted effects, even if all confounders are accurately measured. Among the methods used to estimate such effects, which can be cast as a marginal structural model in a straightforward way, one popular approach is inverse probability weighting. Despite the seemingly intuitive theory and easy-to-implement software, misunderstandings (or "pitfalls") remain. For example, one may mistakenly equate marginal structural models with inverse probability weighting, failing to distinguish a marginal structural model encoding the causal parameters of interest from a nuisance model for exposure probability, and thereby failing to separate the problems of variable selection and model specification for these distinct models. Assuming the causal parameters of interest are identified given the study design and measurements, we provide a step-by-step illustration of generalized computation of standardization (called the g-formula) and inverse probability weighting, as well as the specification of marginal structural models, particularly for time-varying exposures. We use a novel hypothetical example, which allows us access to typically hidden potential outcomes. This illustration provides steppingstones (or "tips") to understand more concretely the estimation of the effects of complex time-varying exposures.
Overview
The claims and statistics of this paper haven’t been checked yet.
Free: it reads the open-access text and checks the first 5 claims that cite a source we can check. Create a free account to check every claim.
Integrity signals
Registry
Cites
Statistics
Figures

Verification
Claims the paper makes
The claims and statistics of this paper haven’t been checked yet.
Free: it reads the open-access text and checks the first 5 claims that cite a source we can check. Create a free account to check every claim.
Claims other papers make about this one
Each is checked against this paper’s own text: does it say what the citing paper says it does?
The cited source says what the claim attributes to it.
In the citing paper
“Other innovations in confounding adjustment methods include Bayesian approaches for trajectory modeling [96, 97], machine learning to estimate weights for IPW and doubly robust estimators [98-100], and IPW approaches driven by latent variables or marginal structure models to facilitate a better understanding of selection into treatment [100-102].”
From Difference-in-Differences for Health Policy and Practice: A Review of Modern Methods (2025) · cites this paper as [101]
Self-check
Percentages, sums and reported differences re-computed from the paper’s own numbers.
The self-check needs the paper’s full text.
Citations
Cites
The central role of the propensity score in observational studies for causal effects
ROSENBAUM, P. R., & RUBIN, D. B. (1983) · Biometrika · doi:10.1093/biomet/70.1.41 · Cited by 31,241
Marginal Structural Models and Causal Inference in Epidemiology
Robins, J. M., Hernán, M. Á., & Brumback, B. (2000) · Epidemiology · doi:10.1097/00001648-200009000-00011 · Cited by 5,581
Causal Diagrams for Epidemiologic Research
Greenland, S., Pearl, J., & Robins, J. M. (1999) · Epidemiology · doi:10.1097/00001648-199901000-00008 · Cited by 3,728 · cited 6×
“(1) or inverse probability weighting (2).”
BackgroundMethodInfluentialAir Pollution and Hospital Admissions for Heart Disease in Eight U.S. Counties
Schwartz, J. (1999) · Epidemiology · doi:10.1097/00001648-199901000-00005 · Cited by 3,038
A structural approach to selection bias
Hernán, M. A., Hernández-Díaz, S., & Robins, J. M. (2004) · Epidemiology · doi:10.1097/01.ede.0000135174.63482.43 · Cited by 2,844
Estimation of Regression Coefficients When Some Regressors are not Always Observed
Robins, J. M., Rotnitzky, A., & Zhao, L. P. (1994) · Journal of the American Statistical Association · doi:10.1080/01621459.1994.10476818 · Cited by 2,823
Constructing Inverse Probability Weights for Marginal Structural Models
Cole, S. R., & Hernan, M. A. (2008) · American Journal of Epidemiology · doi:10.1093/aje/kwn164 · Cited by 2,796
Robins, J. (1986) · Mathematical Modelling · doi:10.1016/0270-0255(86)90088-6 · Cited by 2,451
Causal diagrams for empirical research
PEARL, J. (1995) · Biometrika · doi:10.1093/biomet/82.4.669 · Cited by 2,355
Doubly robust estimation in missing data and causal inference models
Bang, H., & Robins, J. M. (2005) · Biometrics · doi:10.1111/j.1541-0420.2005.00377.x · Cited by 1,998
Research works printed but not linked: 5
- 4. Rothman KJ, Greenland S, Lash TL, eds. Modern Epidemiology, 3rd ed. Philadelphia, PA: Lippincott Williams and Wilkins; 2008.
- 32. Richardson TS, Robins JM. Single world intervention graphs: a primer. Second UAI workshop on causal structure learning, Bellevue, Washington. 2013.
- 34. Glymour MM. Using causal diagrams to understand common problems in social epidemiology. In: Oakes JM, Kaufman JS, eds. Methods in Social Epidemiology. 2nd ed. San Francisco, CA: Jossey-Bass; 2017:458–492.
- 38. Robins JM. The analysis of randomized and non-randomized AIDS treatment trials using a new approach to causal inference in longitudinal studies. In: Sechrest L, Freeman H, Mulley A, eds. Health Service Research Methodology: A Focus on AIDS. Washington DC: U.S. Public Health Service, National Center for Health Services Research; 1989:113–159.
- 66. Pearl J. Direct and indirect effects. In: Proceedings of the Seventeenth Conference on Uncertainty in Artificial Intelligence. San Francisco, CA: Morgan Kaufmann; 2001:411–420.
Cited by
Using Propensity Scores for Causal Inference: Pitfalls and Tips
Shiba, K., & Kawahara, T. (2021) · Journal of Epidemiology · doi:10.2188/jea.je20210145 · Cited by 182
Causal inference and effect estimation using observational data
Igelström, E., Craig, P., Lewsey, J., Lynch, J. W., Pearce, A., & Katikireddi, S. V. (2022) · Journal of Epidemiology & Community Health · doi:10.1136/jech-2022-219267 · Cited by 129
“39 40 G-estimation (using structural nested mean models ) predicts the counterfactual outcome at each time point given no exposure from that point onwards, conditional on prior values of the exposure and confounders.”
Kusama, T., Takeuchi, K., Kiuchi, S., Aida, J., & Osaka, K. (2023) · Journal of the American Geriatrics Society · doi:10.1111/jgs.18707 · Cited by 36
“16,29 Figure 1 shows the hypothesized causal diagram for the two-time-point exposure data investigated in this study.”
BackgroundDe-escalating adjuvant durvalumab treatment duration in stage III non-small cell lung cancer
Bryant, A. K., Sankar, K. N., Zhao, L., Strohbehn, G. W., Elliott, D., Moghanaki, D. M., Kelley, M. J., Ramnath, N., & Green, M. D. (2022) · European Journal of Cancer · doi:10.1016/j.ejca.2022.04.033 · Cited by 30
McGinty, E. E., Seewald, N. J., Bandara, S. N., Cerdá, M., Daumit, G. L., Eisenberg, M. D., Griffin, B. A., Igusa, T., Jackson, J. W., Kennedy‐Hendricks, A., et al. (2022) · Prevention Science · doi:10.1007/s11121-022-01427-8 · Cited by 29
Metadata
- Authors
- Shinozaki, T., & Suzuki, E.
- Affiliations
- Tokyo University of Science (JP)
- Okayama University (JP)
- Venue
- Journal of Epidemiology
- Publisher
- Japan Epidemiological Association
- Published
- 2020-09-05
- Volume
- 30
- Issue
- 9
- Pages
- 377-389
- ISSN
- 0917-5040 (ISSN-L)
- 1349-9092
- PMC
- PMC7429147
- OpenAlex
- W3043336983
- Cited by
- 44
- References
- 82
- Citations by year
- 2026: 11 · 2025: 10 · 2024: 2 · 2023: 6 · 2022: 11 · 2021: 4
- FWCI
- 3.70
- Type
- journal article
- Language
- en
- Open access
- gold
- doi.org
- Licence
- cc-by
- Locations
- Journal of Epidemiology (publishedVersion, cc-by)
- PubMed Central (publishedVersion, cc-by)
- PubMed (publishedVersion)
- DOAJ (DOAJ: Directory of Open Access Journals) (submittedVersion, cc-by-sa)
- Funders
- Japan Society for the Promotion of Science (20K10471, 20K11716)
- Topics
- Physical Sciences › Mathematics › Statistics and Probability › Advanced Causal Inference Techniques
- Physical Sciences › Mathematics › Statistics and Probability › Statistical Methods in Epidemiology
- Physical Sciences › Mathematics › Statistics and Probability › Statistical Methods and Bayesian Inference
- Keywords
- marginal structural models, time-varying exposure, inverse probability weighting, g-formula, causal inference, counterfactual modeling, feature selection, model specification, longitudinal data
- MeSH terms
- Humans, Models, Structural, Probability, Reference Standards, Time Factors, Models, Statistical, Causality
About these checks
Registry, retraction, Cites and statistics results are computed, not judged, with one exception: a printed reference that no index lists is read once by a model before it counts as a citation error. Claims are extracted by a model and kept only when their quote appears verbatim in the text; each cited source is then checked, with a model’s help, for whether it says what the claim relies on. Those verdicts can be wrong — read the claim’s quote and the cited source before relying on one.
Statistics and arithmetic are recomputed, not judged.
Confidence bands are shown only for fields calibrated on our annotated test set. None is calibrated yet, so no band is shown.
What counts as a claim ›How we measure confidence ›How we check this ›
Are you an author, or do you see a problem with this page? Request a review
How to cite
Cite CoChat for the checks on this page, and the paper for its own findings.
- This page
- CoChat. (2026). Citation check: Understanding Marginal Structural Models for Time-Varying Exposures: Pitfalls and Tips. https://app.cochat.ai/papers/10.2188/jea.je20200226
- The paper
- Shinozaki, T., & Suzuki, E. (2020). Understanding Marginal Structural Models for Time-Varying Exposures: Pitfalls and Tips. Journal of Epidemiology. https://doi.org/10.2188/jea.je20200226
Data sources
Bibliographic data: Semantic Scholar, OpenAlex, Crossref.
Contains information from the Semantic Scholar Academic Graph Datasets, made available under the ODC Attribution License (ODC-BY 1.0).
Semantic Scholar’s data is described in: Kinney, R., et al. (2023). The Semantic Scholar Open Data Platform. arXiv:2301.10140.
