

Increased Genetic Risk for β-Cell Failure Is Associated With β-Cell Function Decline in People With Prediabetes
Open accessThe DOI matches its Crossref record; 36 of the 36 references it cites were found in a registry or an index; 19 of the 19 sources its claims cite were checked for support.
Abstract
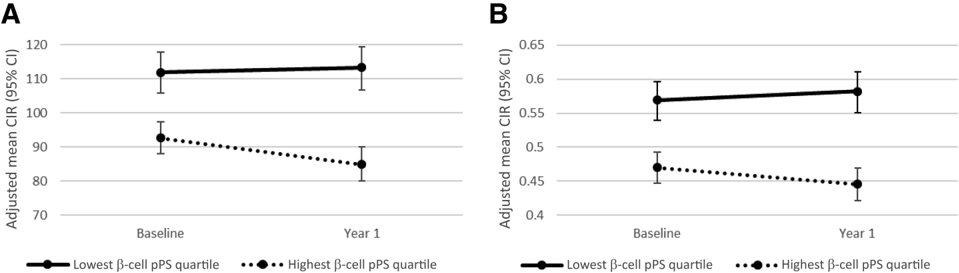
Partitioned polygenic scores (pPS) have been developed to capture pathophysiologic processes underlying type 2 diabetes (T2D). We investigated the association of T2D pPS with diabetes-related traits and T2D incidence in the Diabetes Prevention Program. We generated five T2D pPS (β-cell, proinsulin, liver/lipid, obesity, lipodystrophy) in 2,647 participants randomized to intensive lifestyle, metformin, or placebo arms. Associations were tested with general linear models and Cox regression with adjustment for age, sex, and principal components. Sensitivity analyses included adjustment for BMI. Higher β-cell pPS was associated with lower insulinogenic index and corrected insulin response at 1-year follow-up with adjustment for baseline measures (effect per pPS SD -0.04, P = 9.6 × 10⁻⁷, and -8.45 μU/mg, P = 5.6 × 10⁻⁶, respectively) and with increased diabetes incidence with adjustment for BMI at nominal significance (hazard ratio 1.10 per SD, P = 0.035). The liver/lipid pPS was associated with reduced 1-year baseline-adjusted triglyceride levels (effect per SD -4.37, P = 0.001). There was no significant interaction between T2D pPS and randomized groups. The remaining pPS were associated with baseline measures only. We conclude that despite interventions for diabetes prevention, participants with a high genetic burden of the β-cell cluster pPS had worsening in measures of β-cell function.
Overview
CoChat Summary
TL;DR
In the Diabetes Prevention Program, higher partitioned polygenic score (pPS) for β-cell failure was associated with worse baseline and 1-year β-cell function despite lifestyle or metformin intervention. The findings suggest diabetes prevention interventions may not optimally preserve β-cell function in people with genetic susceptibility to β-cell dysfunction.
Key findings
- Among 2,647 DPP participants, higher β-cell pPS was associated with lower 1-year baseline-adjusted corrected insulin response (CIR; effect per SD −0.042 [95% CI −0.058, −0.025], P = 9.6 × 10⁻⁷) and insulinogenic index (IGR; −8.498 μU/mg [−12.166, −4.830], P = 5.6 × 10⁻⁶).
- Higher β-cell pPS was also associated with increased diabetes incidence in the BMI-adjusted model at nominal significance (hazard ratio 1.10 per SD [95% CI 1.00, 1.20], P = 0.035), not meeting the study-wide significance threshold.
- Higher liver/lipid pPS was associated with reduced 1-year baseline-adjusted triglyceride levels (effect per SD −4.37 [−6.98, −1.76], P = 1.0 × 10⁻³).
- No significant interaction was found between any T2D pPS and randomized treatment group; the remaining pPS were associated with baseline measures only.
Methods
- Secondary analysis of the U.S. multicenter randomized DPP trial, including 2,647 participants with genotyping and baseline and 1-year measurements who were randomized to intensive lifestyle, metformin, or placebo.
- Five T2D pPS (β-cell, proinsulin, obesity, lipodystrophy, liver/lipid) were generated from previously identified T2D genetic clusters.
- Generalized linear models tested associations with baseline and 1-year traits adjusted for baseline values, age, sex, and top 10 principal components; Cox proportional hazards models tested diabetes incidence. Sensitivity analyses adjusted for BMI and restricted to self-reported White race; Bonferroni α = 0.001 was used for 10 novel outcomes.
Limitations
- The paper states limited sample size from an existing clinical study impacted power, and the DPP population’s narrow weight range may have reduced ability to replicate some baseline associations.
- The paper states the genetic clusters were developed in studies of predominantly European genetic ancestry, with additional efforts underway for more diverse ancestral groups.
- The paper states that although significant associations were identified, effect sizes were small, suggesting cluster pPS stratification would not be clinically useful at this point.
Model-written summary. Check it against the paper before relying on it.
Integrity signals
Registry
Cites
Statistics
Figures

Verification
Claims the paper makes
5 Valid · 3 Not valid · 0 Not checked · 58 Own results and interpretations
Some cited sources support this claim and some don’t — read each source’s verdict below.
In the paper
“this underlying mechanism may be due to deregulated triglyceride processing in the liver leading to a liver-mediated form of insulin resistance (24,30,31)”
What the sources say
- Partly supportedcites [24] Kozlitina, 2014, Exome-wide association study identifies a TM6SF2 variant that confers susceptibility to nonalcoholic fatty liver disease, Nat Genet sourceExperimental — accuracy not yet measured
The paper’s main text (indexed as Abstract; page unavailable) links increased liver triglycerides and lower plasma triglycerides to impaired VLDL secretion, supporting the liver-processing part of the proposed mechanism. It does not establish that this leads to liver-mediated insulin resistance; instead, it reports that the TM6SF2 variant was not associated with HOMA-IR. (LLM, conf=0.88)
- Partly supportedcites [30] Smagris, 2016, Inactivation of Tm6sf2, a gene defective in fatty liver disease, impairs lipidation but not secretion of very low density lipoproteins, J Biol Chem sourceExperimental — accuracy not yet measured
The Results report impaired hepatic VLDL-triglyceride secretion in Tm6sf2 knockout mice, supporting a link between altered liver triglyceride processing and circulating lipids. But the Discussion says plasma triglyceride levels were unchanged in these mice, and the Results report no difference in fasting glucose or insulin; the paper does not establish a liver-mediated form of insulin resistance. Page numbers were not available in our copy. (LLM, conf=0.85)
- Disputedcites [31] Smagris, 2015, Pnpla3I148M knockin mice accumulate PNPLA3 on lipid droplets and develop hepatic steatosis, Hepatology sourceExperimental — accuracy not yet measured
The Results (page unavailable) report that PNPLA3-148M did not affect the development of insulin resistance in mice. The Discussion (page unavailable) likewise says the study found no association between the variant and insulin resistance. Although the paper discusses altered hepatic triglyceride handling, it does not support the proposed progression to liver-mediated insulin resistance; it reports the opposite. (LLM, conf=0.87)
Checked by a reasoning model — may be wrong.
hedgedstates a possible cause- Asserted: passes — The authors put it forward as true.
- Checkable: passes — It can be checked against evidence.
- Load-bearing: passes — The paper’s conclusions depend on it.
- Based: passes — The paper gives a reason why it holds.
- Partly supported
Some cited sources support this claim and some don’t — read each source’s verdict below.
In the paper
“The alleles at these loci that increase T2D risk are interestingly associated with reduced serum triglyceride levels”
What the sources say
- Partly supportedcites [24] Kozlitina, 2014, Exome-wide association study identifies a TM6SF2 variant that confers susceptibility to nonalcoholic fatty liver disease, Nat Genet sourceExperimental — accuracy not yet measured
The paper’s Abstract reports that the TM6SF2 Glu167Lys variant is associated with lower plasma triglyceride levels in three cohorts. It does not establish that this variant increases T2D risk or that T2D-risk alleles across the liver/lipid cluster loci have lower triglyceride levels. (LLM, conf=0.85)
- Partly supportedcites [30] Smagris, 2016, Inactivation of Tm6sf2, a gene defective in fatty liver disease, impairs lipidation but not secretion of very low density lipoproteins, J Biol Chem sourceExperimental — accuracy not yet measured
The Introduction (page unavailable) reports that a TM6SF2 variant is associated with reduced plasma lipid levels, which supports the lipid direction for one locus. It does not identify those lipids specifically as serum triglycerides or say that the variant—or alleles at multiple loci—increases T2D risk. The Discussion (page unavailable) also reports similar plasma triglyceride levels in knockout and wild-type mice, rather than a reduction in that model. (LLM, conf=0.83)
- Disputedcites [31] Smagris, 2015, Pnpla3I148M knockin mice accumulate PNPLA3 on lipid droplets and develop hepatic steatosis, Hepatology sourceExperimental — accuracy not yet measured
The Discussion (page unavailable) says that the PNPLA3 I148M variant was not associated with diabetes in the human population studies it discusses, contrary to the claim that it increases T2D risk. The Results (page unavailable) also report no apparent plasma-lipid differences in the knockin mice, rather than reduced circulating triglycerides. A reference title mentions lower serum triglycerides and greater T2D susceptibility in obese PNPLA3-148M carriers, but the paper does not present that as a finding across the claimed loci. (LLM, conf=0.84)
Checked by a reasoning model — may be wrong.
plainstates an association- Asserted: passes — The authors put it forward as true.
- Checkable: passes — It can be checked against evidence.
- Load-bearing: passes — The paper’s conclusions depend on it.
- Based: passes — The paper gives a reason why it holds.
- Partly supported
The cited sources that could be checked couldn’t confirm or dispute this claim.
In the paper
“We have high suspicion that it is a true association because all the individual alleles in the pPS are associated with T2D risk (by design) and the β-cell cluster pPS has been shown in prior work to have the strongest association with prevalent T2D of any cluster (11).”
What the sources say
- Could not verifycites [11] DiCorpo, 2022, Type 2 diabetes partitioned polygenic scores associate with disease outcomes in 454,193 individuals across 13 cohorts, Diabetes Care sourceExperimental — accuracy not yet measured
The citation is attached to the assertion that the β-cell cluster pPS has the strongest association with prevalent T2D. The Conclusions (page unavailable) instead say it is the cluster most strongly associated with fasting glucose and HbA1c; the searched passages do not establish its ranking for prevalent T2D. The citing authors’ suspicion about diabetes incidence is their own inference, not a conclusion attributed to this source. (LLM, conf=0.76)
hedgedstates an association- Asserted: passes — The authors put it forward as true.
- Checkable: passes — It can be checked against evidence.
- Load-bearing: unclear — It is unclear whether the paper’s conclusions depend on it.
- Based: passes — The paper gives a reason why it holds.
- Could not verify
Every source the paper cites for this claim was checked and supports it.
In the paper
“Indeed, higher diabetes incidence in all treatment groups was found among individuals with lower measures of insulin secretory response at baseline in the DPP (22).”
What the sources say
- Supportedcites [22] Diabetes Prevention Program Research Group, 2005, Role of insulin secretion and sensitivity in the evolution of type 2 diabetes in the Diabetes Prevention Program: effects of lifestyle intervention and metformin, Diabetes source
The Discussion states that diabetes development was negatively related to baseline estimates of insulin secretion and that estimated secretion predicted diabetes similarly in each treatment group. The Figure 4 caption also says baseline metabolic variables significantly predicted progression in all treatment groups, with exceptions that do not include the insulin-secretion measures. (LLM, conf=0.94)
plainstates an association- Asserted: passes — The authors put it forward as true.
- Checkable: passes — It can be checked against evidence.
- Load-bearing: unclear — It is unclear whether the paper’s conclusions depend on it.
- Based: passes — The paper gives a reason why it holds.
- Supported
The cited sources support only part of this claim — read each source’s verdict below.
In the paper
“The liver/lipid cluster includes loci GCKR, PNPLA3, and TM6SF2, which have been shown through functional experiments to relate to liver lipid metabolism (24–31).”
What the sources say
- Supportedcites [24] Kozlitina, 2014, Exome-wide association study identifies a TM6SF2 variant that confers susceptibility to nonalcoholic fatty liver disease, Nat Genet source
The paper’s experimental findings (section labeled Abstract; page unavailable) show that knocking down Tm6sf2 in mouse liver increased liver triglyceride content and reduced VLDL secretion. This supports the functional link between TM6SF2 and liver lipid metabolism for which this paper is cited among references 24–31. (LLM, conf=0.92)
- Partly supportedcites [25] Romeo, 2008, Genetic variation in PNPLA3 confers susceptibility to nonalcoholic fatty liver disease, Nat Genet sourceExperimental — accuracy not yet measured
The paper reports a strong association between PNPLA3 variation and hepatic fat content and, in its Abstract (page not given), describes published in vitro experiments showing PNPLA3 activity against triglycerides. It also says the protein’s specific role in liver lipid metabolism was unknown and that experiments on the variants identified in this study were still in progress. This source supports the PNPLA3 part of the multi-citation sentence, but not the implication that functional experiments had established its role in the liver. (LLM, conf=0.87)
- Partly supportedcites [26] Speliotes, 2011, Genome-wide association analysis identifies variants associated with nonalcoholic fatty liver disease that have distinct effects on metabolic traits, PLoS Genet sourceExperimental — accuracy not yet measured
The Discussion links GCKR to substrates for liver lipogenesis and PNPLA3 to triglyceride breakdown, citing prior functional work. It does not include TM6SF2 among the loci it identifies or establish the stated three-locus cluster; its own analysis is primarily genetic association rather than functional experiments (Discussion; Results, page not provided). (LLM, conf=0.88)
- Partly supportedcites [27] Beer, 2009 sourceExperimental — accuracy not yet measured
The Results and Discussion (page unavailable) report functional experiments on GCKR and link altered glucokinase regulation to hepatic metabolism and higher triglycerides; the proposed lipogenesis mechanism is a prediction. This paper does not establish the claim about PNPLA3 or TM6SF2, or identify the three loci as a cluster. (LLM, conf=0.88)
- Partly supportedcites [28] Raimondo, 2015, Glucokinase regulatory protein: complexity at the crossroads of triglyceride and glucose metabolism, Curr Opin Lipidol sourceExperimental — accuracy not yet measured
The Conclusion (page not provided) links GCKR’s gene product, GKRP, to hepatic triglyceride metabolism and reports functional analyses of its activity. The paper does not establish the claimed liver/lipid cluster or address PNPLA3 and TM6SF2, so it supports only the GCKR portion of the sentence. (LLM, conf=0.88)
- Supportedcites [29] Mahdessian, 2014, TM6SF2 is a regulator of liver fat metabolism influencing triglyceride secretion and hepatic lipid droplet content, Proc Natl Acad Sci U S A source
The TM6SF2 function section reports functional studies in human hepatoma cells showing that TM6SF2 influences triglyceride-rich lipoprotein secretion and hepatic lipid droplet content. This supports the TM6SF2 portion of the multi-cited sentence; the source is not being relied on individually for GCKR or PNPLA3. (LLM, conf=0.91)
- Supportedcites [30] Smagris, 2016, Inactivation of Tm6sf2, a gene defective in fatty liver disease, impairs lipidation but not secretion of very low density lipoproteins, J Biol Chem source
The Results report a functional experiment in Tm6sf2 knockout mice: VLDL triglyceride secretion was markedly lower than in wild-type littermates. This supports the cited paper’s role in the citation group as evidence that TM6SF2 relates to liver lipid metabolism. (LLM, conf=0.90)
- Supportedcites [31] Smagris, 2015, Pnpla3I148M knockin mice accumulate PNPLA3 on lipid droplets and develop hepatic steatosis, Hepatology source
The Results report a functional experiment in Pnpla3 knockin mice: liver triglyceride content was higher and PNPLA3 accumulated on hepatic lipid droplets. This supports the PNPLA3 portion of the claim. The citation is one of a group attached to the three-locus statement; this paper need not establish the GCKR or TM6SF2 portions. (LLM, conf=0.91)
boostedstates an association- Asserted: passes — The authors put it forward as true.
- Checkable: passes — It can be checked against evidence.
- Load-bearing: passes — The paper’s conclusions depend on it.
- Based: passes — The paper gives a reason why it holds.
- Supported
35 more claims · 1 with their cited sources checked
Create a free account to see all 66 claims and every source verdict.
- It may state two separate claims as one. 12
- Probably not a substantial claim. 11
- Not yet classified. 4
Self-check
Percentages, sums and reported differences re-computed from the paper’s own numbers.
Each contradiction between two passages listed here was confirmed by an independent check.
Rated minor: it would not touch a result — a value no result rests on, a p-value that stays on the same side of the significance level, or a conflict that is clerical, resolved elsewhere in the paper, or outside its own findings.
In the paper
§ Increased Genetic Risk for b-Cell Failure Is Associated With b-Cell Function Decline in People With Prediabetes
“hazard ratio 1.10 per SD, P = 0.035”
§ Increased Genetic Risk for b-Cell Failure Is Associated With b-Cell Function Decline in People With Prediabetes > T2D pPS Are Associated With Relevant Clinical Characteristics at Baseline
“hazard ratio 1.10 per weighted allele [95% CI 1.00, 1.20], P = 0.035”
Rated minor: it would not touch a result — a value no result rests on, a p-value that stays on the same side of the significance level, or a conflict that is clerical, resolved elsewhere in the paper, or outside its own findings.
In the paper
§ Results
“HbA 1c Baseline, % −0.0006 0.943 0.0160 0.104 −0.0067 0.491 0.0075 0.430 0.0058 0.530”
§ Results
“Baseline, mmol/mol −23.504 −23.3220 −23.571 −23.4150 −23.434”
Rated minor: it would not touch a result — a value no result rests on, a p-value that stays on the same side of the significance level, or a conflict that is clerical, resolved elsewhere in the paper, or outside its own findings.
In the paper
§ Abstract
“lower insulinogenic index and corrected insulin response at 1-year follow-up with adjustment for baseline measures (effect per pPS SD −0.04, P = 9.6 × 10⁻⁷, and −8.45 μU/mg, P = 5.6 × 10⁻⁶, respectively)”
§ Results
“IGR (μU/mg) Baseline −9.1105 6.4 × 10 −7 −2.2354 0.244 −3.1251 0.090 2.9536 0.113 1.5114 0.411 1-year adj baseline −8.4978 5.6 × 10 −6 −2.7241 0.160 0.2252 0.910 −0.0259 0.100 0.1498 0.940 CIR Baseline −0.0465 1.5 × 10 −8 −0.0155 0.073 −0.0114 0.178 0.0149 0.072 −0.0008 0.913 1-year adj baseline −0.0417 9.6 × 10 −7”
Citations
Cites
Matthews, D. R., Hosker, J. P., Rudenski, A. S., Naylor, B. A., Treacher, D. F., & Turner, R. C. (1985) · Diabetologia · doi:10.1007/bf00280883 · Cited by 31,502
Reduction in the incidence of type 2 diabetes with lifestyle intervention or metformin
(2002) · New England Journal of Medicine · doi:10.1056/nejmoa012512 · Cited by 19,011
A global reference for human genetic variation
The 1000 Genomes Project Consortium, authors, C., Auton, A., Abecasis, G. R., Steering committee, Altshuler, D. M., Durbin, R. M., Abecasis, G. R., Bentley, D. R., Chakravarti, A., et al. (2015) · Nature · doi:10.1038/nature15393 · Cited by 18,247
Self-citationHowie, B. N., Donnelly, P., & Marchini, J. (2009) · PLoS Genetics · doi:10.1371/journal.pgen.1000529 · Cited by 3,928
Genetic variation in PNPLA3 confers susceptibility to nonalcoholic fatty liver disease
Romeo, S., Kozlitina, J., Xing, C., Pertsemlidis, A., Cox, D., Pennacchio, L. A., Boerwinkle, E., Cohen, J. C., & Hobbs, H. H. (2008) · Nature Genetics · doi:10.1038/ng.257 · Cited by 3,416
Prevalence of and Trends in Diabetes Among Adults in the United States, 1988-2012
Menke, A., Casagrande, S., Geiss, L., & Cowie, C. C. (2015) · JAMA · doi:10.1001/jama.2015.10029 · Cited by 2,362
Improved whole-chromosome phasing for disease and population genetic studies
Delaneau, O., Zagury, J.-F., & Marchini, J. (2013) · Nature Methods · doi:10.1038/nmeth.2307 · Cited by 1,315
Kozlitina, J., Smagris, E., Stender, S., Nordestgaard, B. G., Zhou, H. H., Tybjærg-Hansen, A., Vogt, T. F., Hobbs, H. H., & Cohen, J. C. (2014) · Nature Genetics · doi:10.1038/ng.2901 · Cited by 1,234
Speliotes, E. K., Yerges-Armstrong, L. M., Wu, J., Hernaez, R., Kim, L. J., Palmer, C. D., Gudnason, V., Eiriksdottir, G., Garcia, M. E., Launer, L. J., et al. (2011) · PLoS Genetics · doi:10.1371/journal.pgen.1001324 · Cited by 984
(1999) · Diabetes Care · doi:10.2337/diacare.22.4.623 · Cited by 725
Cited by
The role of the beta cell in type 2 diabetes: new findings from the last 5 years
Yau, B., Ghislain, J. J., Kebede, M. A., Hughes, J. W., & Poitout, V. (2025) · Diabetologia · doi:10.1007/s00125-025-06499-z · Cited by 51
Diabetes mellitus polygenic risk scores: heterogeneity and clinical translation
Ortega, H. I., Udler, M. S., Gloyn, A. L., & Sharp, S. A. (2025) · Nature Reviews Endocrinology · doi:10.1038/s41574-025-01132-w · Cited by 32
“A 2024 analysis in the same study 156 showed that those with a high β-cell pPS had reduced β-cell function at baseline and a continued decline in β-cell function over 1 year.”
Self-citationBeyond Glucose—Rethinking Prediabetes for Precision Prevention
Wagner, R. J., Selvin, E., Sehgal, R., Prystupa, K., Misra, S., Fritsche, A., & Heni, M. (2025) · Diabetes Care · doi:10.2337/dci25-0054 · Cited by 29
Is the Current Lifestyle Modification Approach to Diabetes Prevention in the U.S. a Success?
Echouffo-Tcheugui, J. B., Chakkalakal, R. J., & Ali, M. K. (2025) · Diabetes Care · doi:10.2337/dci24-0040 · Cited by 11
Zhu, B. J. (2026) · Frontiers in Endocrinology · doi:10.3389/fendo.2025.1753393 · Cited by 3
Metadata
- Authors
- Billings, L. K., Jablonski, K. A., Pan, Q., Florez, J. C., Franks, P. W., Goldberg, R. B., Hivert, M.-F., Kahn, S. E., Knowler, W. C., Lee, C. G., Merino, J., Huerta-Chagoya, A., Mercader, J. M., Raghavan, S., Shi, Z., Srinivasan, S., Xu, J., & Udler, M. S.
- Affiliations
- Endeavor Health (US)
- George Washington University (US)
- 8Diabetes Unit, Massachusetts General Hospital, Boston, MA
- Harvard University (US)
- University of Miami (US)
- University of Washington (US)
- National Institutes of Health (US)
- Broad Institute (US)
- 12Center for Genomic Medicine and Diabetes Unit, Endocrine Division, Department of Medicine, Massachusetts General Hospital, Boston, MA
- VA Eastern Colorado Health Care System (US)
- University of California, San Francisco (US)
- Corresponding author
- Billings, Liana K.
- Udler, Miriam S.
- ORCID
- Venue
- Diabetes
- Publisher
- American Diabetes Association
- Published
- 2024-05-17
- Volume
- 73
- Issue
- 8
- Pages
- 1352-1360
- ISSN
- 0012-1797 (ISSN-L)
- PMC
- PMC11262049
- OpenAlex
- W4397002598
- Cited by
- 11
- References
- 30
- Citations by year
- 2026: 5 · 2025: 6
- FWCI
- 2.91
- Type
- journal article
- Language
- en
- Open access
- green
- www.ncbi.nlm.nih.gov
- Locations
- Diabetes (publishedVersion)
- PubMed Central (publishedVersion)
- Europe PMC (PubMed Central) (publishedVersion)
- PubMed (publishedVersion)
- Research at the University of Copenhagen (University of Copenhagen) (publishedVersion, other-oa)
- Lund University Publications (Lund University) (submittedVersion)
- Funders
- American Diabetes Association (7-21-JDFM-005)
- Nutrition Obesity Research Center at Harvard (P30 DK040561)
- National Institutes of Health (UG1 HD107691)
- US Department of Veterans Affairs (IK2-CX001907)
- National Institute of Diabetes and Digestive and Kidney Diseases (K23DK114551, U01 DK048339, U01 DK048349, U01 DK048375, U01 DK048377, U01 DK048380, U01 DK048381, U01 DK048387, U01 DK048397, U01 DK048400, U01 DK048404, U01 DK048406, U01 DK048407, U01 DK048411, U01 DK048412, U01 DK048413, U01 DK048434, U01 DK048437, U01 DK048443, U01 DK048468, U01 DK048485, U01 DK048489, U01 DK048514)
- Boettcher Foundation (Webb Waring Biomedical Research Award)
- NIH (UG1 HD107691)
- NorthShore University HealthSystem (NorthShore Auxiliary Scholars Award)
- Topics
- Life Sciences › Biochemistry, Genetics and Molecular Biology › Genetics › Genetic Associations and Epidemiology
- Life Sciences › Biochemistry, Genetics and Molecular Biology › Genetics › Diabetes and associated disorders
- Health Sciences › Medicine › Endocrinology, Diabetes and Metabolism › Pancreatic function and diabetes
- Keywords
- type 2 diabetes, beta-cell function, prediabetes, insulinogenic index, type 2 diabetes incidence, Diabetes Prevention Program, metformin, lifestyle intervention, triglycerides, genetic risk, beta-cell failure
- MeSH terms
- Adult, Diabetes Mellitus, Type 2, Female, Humans, Male, Middle Aged, Prediabetic State, Incidence, Genetic Predisposition to Disease, Multifactorial Inheritance, Insulin-Secreting Cells
About these checks
Registry, retraction, Cites and statistics results are computed, not judged, with one exception: a printed reference that no index lists is read once by a model before it counts as a citation error. Claims are extracted by a model and kept only when their quote appears verbatim in the text; each cited source is then checked, with a model’s help, for whether it says what the claim relies on. Those verdicts can be wrong — read the claim’s quote and the cited source before relying on one.
The claim verdicts this report counts are experimental: their accuracy is not yet measured.
A language model drew the claims from the paper on 2026-09-28, under version 3 of the claim definition (model deepseek-v4.1-flash, prompt extract-v3).
A second model labelled each claim on 2026-09-28 (model jev-1.13-20260917, definition revision gold-guideline-v0.2).
Cited sources are checked with a language model’s help (gpt-6-sol).
Statistics and arithmetic are recomputed, not judged.
Confidence bands are shown only for fields calibrated on our annotated test set. None is calibrated yet, so no band is shown.
What counts as a claim ›How we measure confidence ›How we check this ›
Are you an author, or do you see a problem with this page? Request a review
Data sources
Bibliographic data: Semantic Scholar, OpenAlex, Crossref.
Contains information from the Semantic Scholar Academic Graph Datasets, made available under the ODC Attribution License (ODC-BY 1.0).
Semantic Scholar’s data is described in: Kinney, R., et al. (2023). The Semantic Scholar Open Data Platform. arXiv:2301.10140.
