PreprintCited by 337Computational Drug Discovery MethodsMachine Learning in Materials ScienceMachine Learning in Healthcare

The DOI matches its Crossref record; 1 of the 1 references it cites were found in a registry or an index.

Exposing the limitations of molecular machine learning with activity cliffs.

Open access
van Tilborg, Derek, Alenicheva, Alisa, Grisoni, Francesca·2022·Journal of Chemical Information and Modeling

Preprint — published as 10.1021/acs.jcim.2c01073 · Paper page

Abstract

Machine learning has become a crucial tool in drug discovery and chemistry at large, e.g., to predict molecular properties, such as bioactivity, with high accuracy. However, activity cliffs – pairs of molecules that are highly similar in their structure but exhibit large differences in potency – have been underinvestigated for their effect on model performance. Not only are these edge cases informative for molecule discovery and optimization, but models that are well-equipped to accurately predict the potency of activity cliffs have an increased potential for prospective applications. Our work aims to fill the current knowledge gap on best-practice machine learning methods in the presence of activity cliffs. We benchmarked a total of 720 machine and deep learning models on curated bioactivity data from 30 macromolecular targets for their performance on activity cliff compounds. While all methods struggled in the presence of activity cliffs, machine learning approaches based on molecular descriptors outperformed more complex deep learning methods. Our findings highlight large case-by-case differences in performance, advocating for (a) the inclusion of dedicated “activity-cliff-centered” metrics during model development and evaluation, and (b) the development of novel algorithms to better predict the properties of activity cliffs. To this end, the methods, metrics, and results of this study have been encapsulated into an open-access benchmarking platform named MoleculeACE (Activity Cliff Estimation, available on GitHub at: https://github.com/molML/MoleculeACE). MoleculeACE is designed to steer the community towards addressing the pressing but overlooked limitation of molecular machine learning models posed by activity cliffs.

Overview

The claims and statistics of this paper haven’t been checked yet.

Run the check — free, no account needed. It reads the open-access text and checks the sources it cites.

A few free checks a day · papers already verified open instantly · results are public

Integrity signals

Registry

Crossref · 10.26434/chemrxiv-2022-mfq52-v3

Cites

1 of 1 references verified0 citation errors · 0 not checkable

Statistics

Figures

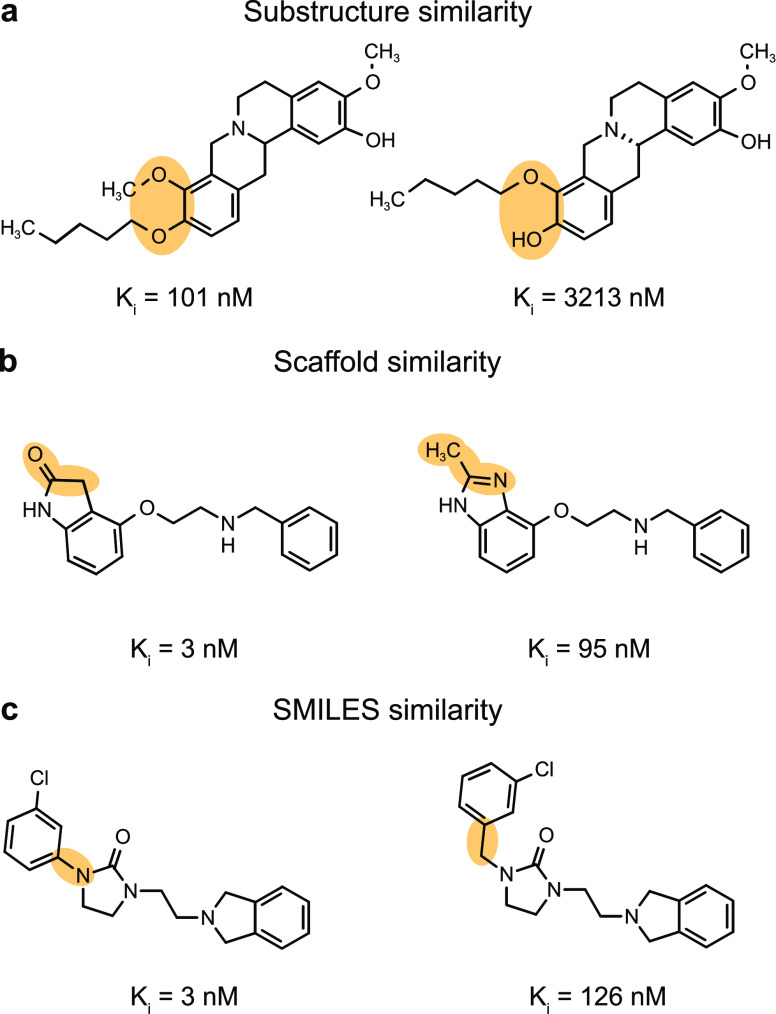
Figure 1 Selected examples of activity cliffs (on dopamine D3 receptor, D3R). (a) General substructure similarity (Tanimoto coefficient on ECFP). (b) Scaffold similarity that quantifies the similarity between molecular cores or scaffold decorations (Tanimoto coefficient on scaffold ECFP). (c) SMILES similarity that detects string insertions, deletions, and translocations (scaled Levenshtein distance).
Figure 1 Selected examples of activity cliffs (on dopamine D3 receptor, D3R). (a) General substructure similarity (Tanimoto coefficient on ECFP). (b) Scaffold similarity that quantifies the similarity between molecular cores or scaffold decorations (Tanimoto coefficient on scaffold ECFP). (c) SMILES similarity that detects string insertions, deletions, and translocations (scaled Levenshtein distance).CC BY · PubMed Central
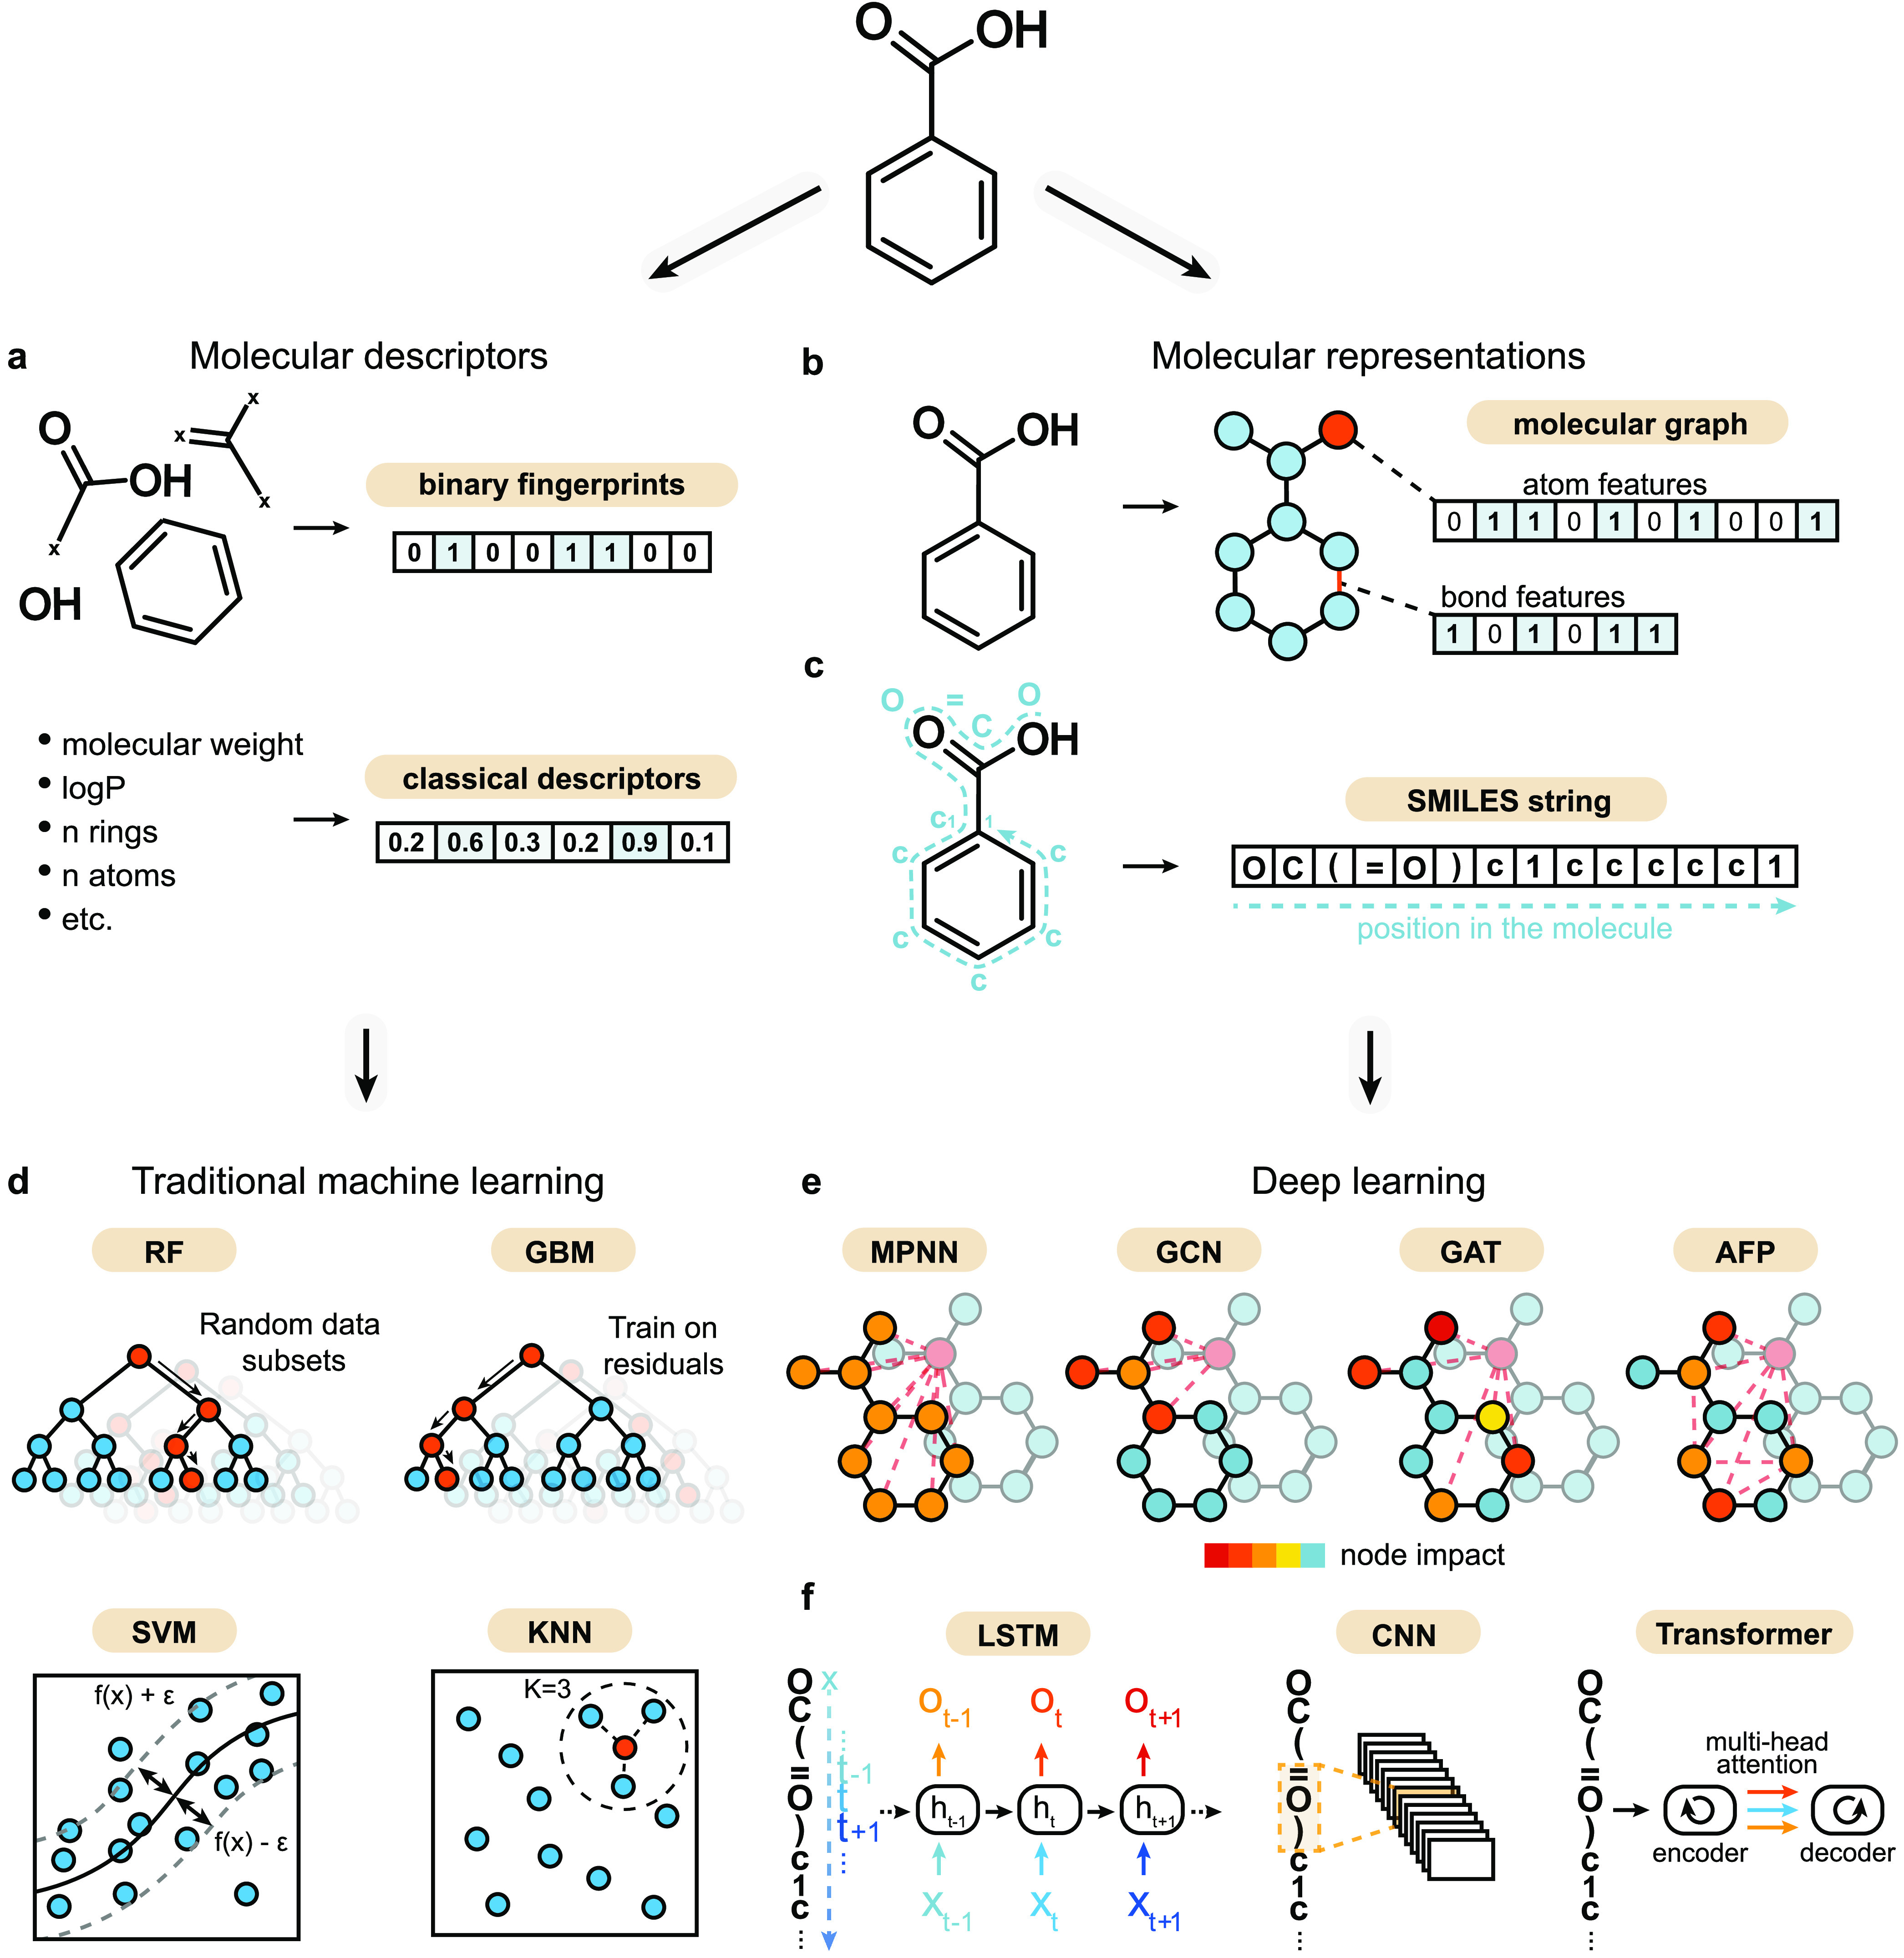
Figure 2 Machine learning strategies. (a) Simplified representation of molecular descriptors, which capture predefined molecular features. Both binary fingerprints and traditional molecular descriptors are used in this work. (b) Molecular graph, in which atoms are represented as nodes (with corresponding node features) and bonds are represented as edges (with corresponding edge features, if any). (c) SMILES strings, which capture two-dimensional information (atom and bond type and molecular topology) into a string. (d) Selected traditional machine learning algorithms that are trained on molecular descriptors: random forest (RF), gradient boosting (GBM), support vector regression (SVM), and K-nearest neighbor (KNN). (e) Deep learning methods. Four graph neural networks that can learn from molecular graphs were used: message passing neural network (MPNN), graph convolutional network (GCN), graph attention network (GAT), and attentive fingerprint (AFP). Node colors indicate the impact of other nodes during feature aggregation (indicated by dashed lines). Three SMILES-based methods that can learn from sequential data were used: long short-term memory networks (LSTM), one-dimensional (1D) convolutional neural networks (CNN), and transformers.
Figure 2 Machine learning strategies. (a) Simplified representation of molecular descriptors, which capture predefined molecular features. Both binary fingerprints and traditional molecular descriptors are used in this work. (b) Molecular graph, in which atoms are represented as nodes (with corresponding node features) and bonds are represented as edges (with corresponding edge features, if any). (c) SMILES strings, which capture two-dimensional information (atom and bond type and molecular topology) into a string. (d) Selected traditional machine learning algorithms that are trained on molecular descriptors: random forest (RF), gradient boosting (GBM), support vector regression (SVM), and K-nearest neighbor (KNN). (e) Deep learning methods. Four graph neural networks that can learn from molecular graphs were used: message passing neural network (MPNN), graph convolutional network (GCN), graph attention network (GAT), and attentive fingerprint (AFP). Node colors indicate the impact of other nodes during feature aggregation (indicated by dashed lines). Three SMILES-based methods that can learn from sequential data were used: long short-term memory networks (LSTM), one-dimensional (1D) convolutional neural networks (CNN), and transformers.CC BY · PubMed Central
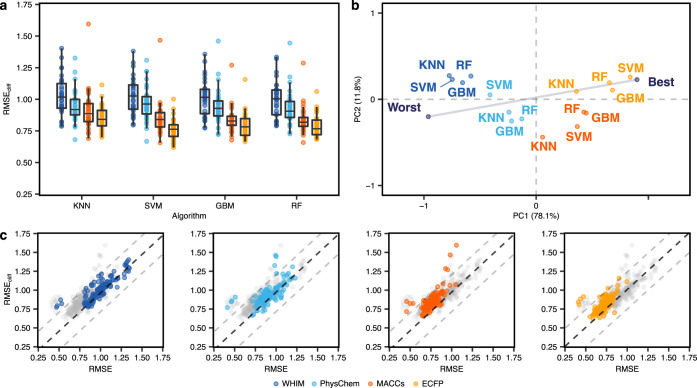
Figure 3 Performance of traditional machine learning methods. (a) RMSE on activity cliff compounds using different machine learning algorithms and molecular descriptors (indicated by colors). (b) Global ranking of all methods using PCA (first two principal components, PC1 and PC2), scaled between best and worst performance. Every point captures a different combination of the machine learning method and the descriptor it relied on and is obtained by considering the corresponding RMSEcliff on all data sets. “Worst” and “Best” indicated the worst and best performance obtained across all data sets, respectively. Percentages represent the variance explained by each principal component. (c) Comparison between the error on activity cliff compounds (RMSEcliff) and the error on all compounds (RMSE) for all methods. Black dashed lines indicate RMSE = RMSEcliff, while gray dashed lines indicate a difference of ±0.5 log units between RMSEcliff and RMSE.
Figure 3 Performance of traditional machine learning methods. (a) RMSE on activity cliff compounds using different machine learning algorithms and molecular descriptors (indicated by colors). (b) Global ranking of all methods using PCA (first two principal components, PC1 and PC2), scaled between best and worst performance. Every point captures a different combination of the machine learning method and the descriptor it relied on and is obtained by considering the corresponding RMSEcliff on all data sets. “Worst” and “Best” indicated the worst and best performance obtained across all data sets, respectively. Percentages represent the variance explained by each principal component. (c) Comparison between the error on activity cliff compounds (RMSEcliff) and the error on all compounds (RMSE) for all methods. Black dashed lines indicate RMSE = RMSEcliff, while gray dashed lines indicate a difference of ±0.5 log units between RMSEcliff and RMSE.CC BY · PubMed Central
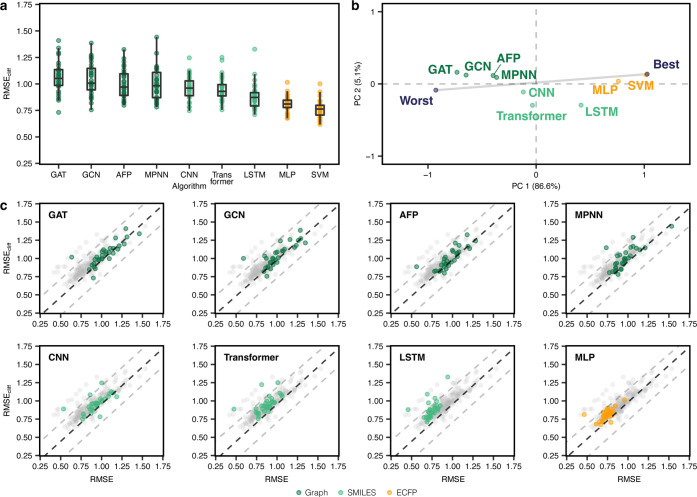
Figure 4 Performance of deep learning methods. (a) RMSE on activity cliff compounds on different deep learning strategies. SVM is reported as a reference. (b) Global ranking of all methods using PCA (first two principal components, PC1 and PC2), scaled between best and worst performance. Every point captures the performance of a different machine learning approach obtained by considering the corresponding RMSEcliff on all data sets. “Worst” and “Best” indicated the worst and best performance obtained across all data sets, respectively. Percentages indicate the explained variance by each principal component. (c) Prediction error on activity cliff compounds (RMSEcliff) compared to all compounds (RMSE) for all methods.
Figure 4 Performance of deep learning methods. (a) RMSE on activity cliff compounds on different deep learning strategies. SVM is reported as a reference. (b) Global ranking of all methods using PCA (first two principal components, PC1 and PC2), scaled between best and worst performance. Every point captures the performance of a different machine learning approach obtained by considering the corresponding RMSEcliff on all data sets. “Worst” and “Best” indicated the worst and best performance obtained across all data sets, respectively. Percentages indicate the explained variance by each principal component. (c) Prediction error on activity cliff compounds (RMSEcliff) compared to all compounds (RMSE) for all methods.CC BY · PubMed Central
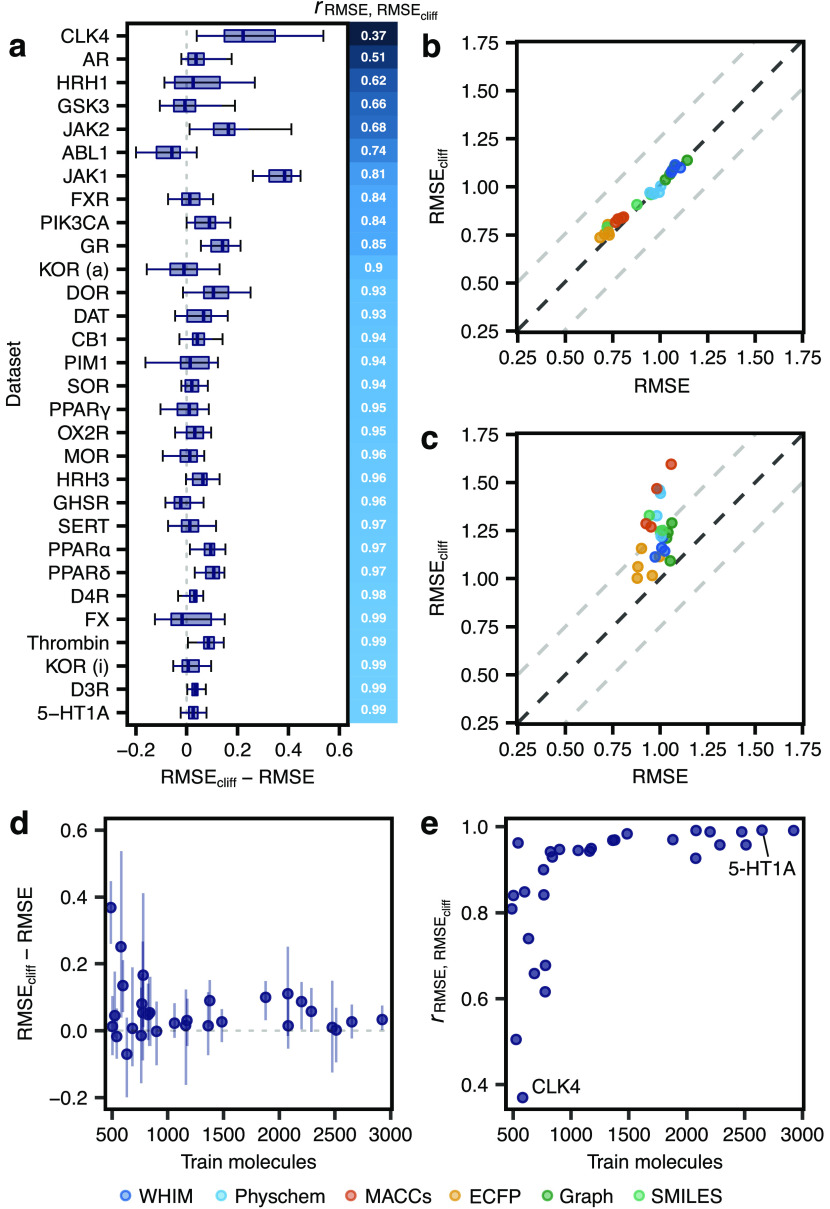
Figure 5 Comparing overall model performance and performance on activity cliff compounds. (a) Method-wide differences between overall RMSE and RMSEcliff for all targets ordered by Pearson correlation (r) between RMSE and RMSEcliff. Error bars indicate the lowest and highest RMSEcliff. (b) Comparison between RMSE and RMSEcliff of all methods on 5-HT1A. (c) Comparison between RMSE and RMSEcliff of all methods on CLK4. (d) Effect of the number of training molecules on the difference between RMSE and RMSEcliff. Error bars indicate the lowest and highest RMSEcliff. (e) Relationship between the number of training molecules and the Pearson correlation (r) of RMSE and RMSEcliff.
Figure 5 Comparing overall model performance and performance on activity cliff compounds. (a) Method-wide differences between overall RMSE and RMSEcliff for all targets ordered by Pearson correlation (r) between RMSE and RMSEcliff. Error bars indicate the lowest and highest RMSEcliff. (b) Comparison between RMSE and RMSEcliff of all methods on 5-HT1A. (c) Comparison between RMSE and RMSEcliff of all methods on CLK4. (d) Effect of the number of training molecules on the difference between RMSE and RMSEcliff. Error bars indicate the lowest and highest RMSEcliff. (e) Relationship between the number of training molecules and the Pearson correlation (r) of RMSE and RMSEcliff.CC BY · PubMed Central

Verification

Claims the paper makes

The claims and statistics of this paper haven’t been checked yet.

Run the check — free, no account needed. It reads the open-access text and checks the sources it cites.

A few free checks a day · papers already verified open instantly · results are public

Self-check

Percentages, sums and reported differences re-computed from the paper’s own numbers.

The self-check needs the paper’s full text.

Citations

Cites

Metadata

Authors
van Tilborg, D., Alenicheva, A., & Grisoni, F.
Affiliations
  • University Medical Center Utrecht (NL)
  • JetBrains Research. Saint Petersburg, Russia.
Corresponding author
Grisoni, Francesca
Venue
Journal of Chemical Information and Modeling
Published
2022-08-30
Volume
62
Issue
23
Pages
5938-5951
ISSN
1549-9596 (ISSN-L)
OpenAlex
W4310603653
Cited by
337
References
1
Citations by year
2026: 100 · 2025: 114 · 2024: 64 · 2023: 50 · 2022: 9
FWCI
32.06
Type
journal article
Language
en
Open access
Locations
  • Journal of Chemical Information and Modeling (publishedVersion, cc-by)
  • ChemRxiv (acceptedVersion, cc-by-nc)
  • PubMed Central (publishedVersion, cc-by)
  • PubMed (publishedVersion)
  • TU/e Research Portal (submittedVersion, cc-by)
Funders
  • Technische Universiteit Eindhoven
  • Universitair Medisch Centrum Utrecht
  • JetBrains Research
Topics
  • Life Sciences › Pharmacology, Toxicology and Pharmaceutics › Drug Discovery › Computational Drug Discovery Methods
  • Physical Sciences › Materials Science › Materials Chemistry › Machine Learning in Materials Science
  • Physical Sciences › Computer Science › Artificial Intelligence › Machine Learning in Healthcare
Keywords
activity cliffs, molecular machine learning, bioactivity prediction, molecular descriptors, deep learning, model benchmarking, drug discovery
MeSH terms
Machine Learning, Algorithms, Models, Molecular, Structure-Activity Relationship, Drug Discovery

About these checks

Registry, retraction, Cites and statistics results are computed, not judged, with one exception: a printed reference that no index lists is read once by a model before it counts as a citation error. Claims are extracted by a model and kept only when their quote appears verbatim in the text; each cited source is then checked, with a model’s help, for whether it says what the claim relies on. Those verdicts can be wrong — read the claim’s quote and the cited source before relying on one.

Statistics and arithmetic are recomputed, not judged.

Confidence bands are shown only for fields calibrated on our annotated test set. None is calibrated yet, so no band is shown.

What counts as a claim ›How we measure confidence ›How we check this ›

Are you an author, or do you see a problem with this page? Request a review