

The DOI matches its Crossref record; 2 of the 2 references it cites were found in a registry or an index.
Evaluation of TOCSY mixing for sensitivity-enhancement in solid-state NMR and application of 4D experiments for side-chain assignments of the full-length 30 kDa membrane protein GlpG
Open accessPreprint — published as 10.1007/s10858-024-00454-7 · Paper page
Abstract
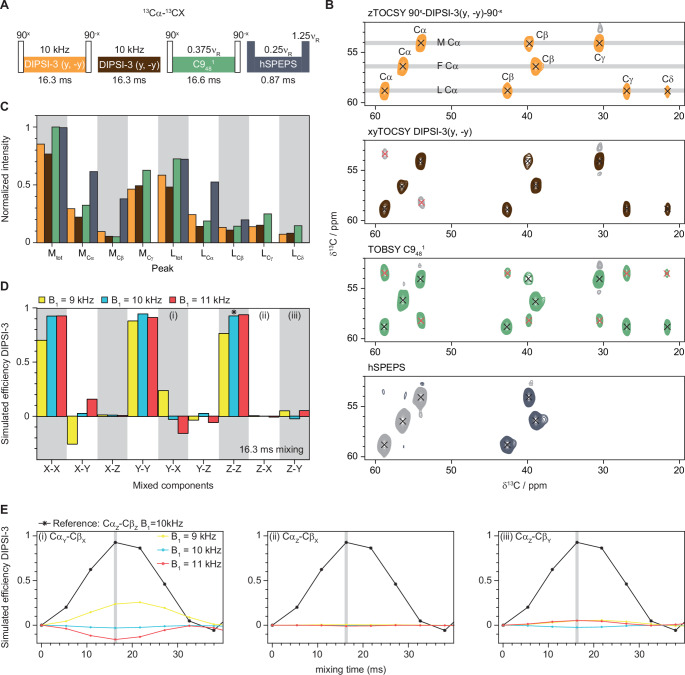
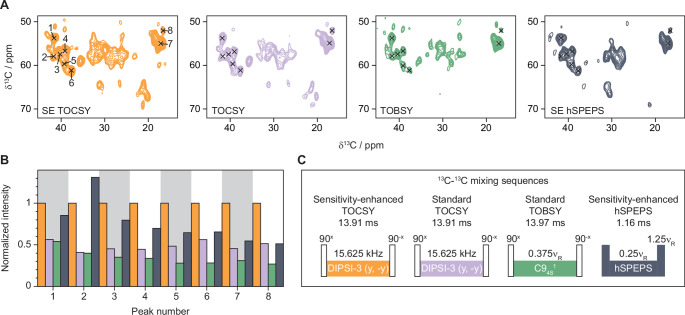
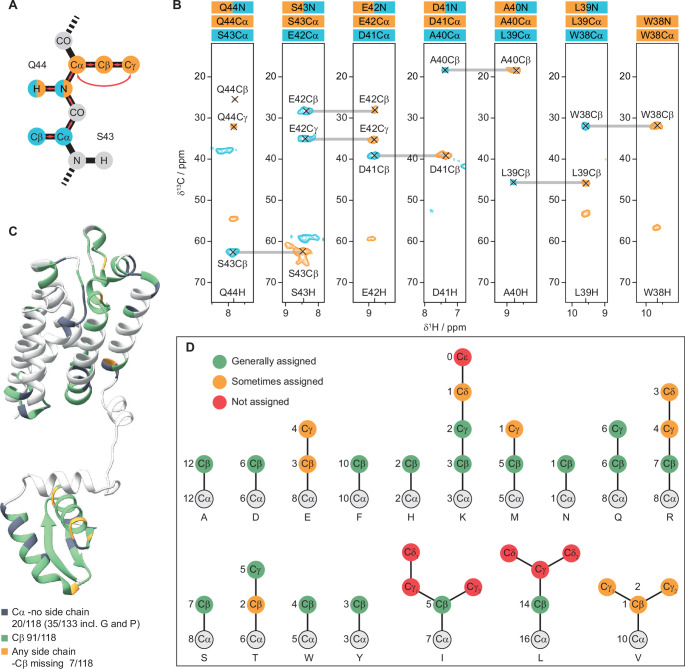
Chemical shift assignments of large membrane proteins by solid-state NMR experiments are challenging. Recent advancements in sensitivity-enhanced pulse sequences, have made it feasible to acquire 1H-detected 4D spectra of these challenging protein samples within reasonable timeframes. However, obtaining unambiguous assignments remains difficult without access to side-chain chemical shifts. Drawing inspiration from sensitivity-enhanced TOCSY experiments in solution NMR, we have explored the potential of 13C-13C TOCSY mixing as a viable option for triple sensitivity-enhanced 4D experiments aimed at side-chain assignments in solid-state NMR. Through simulations and experimental trials, we have identified optimal conditions to achieve uniform transfer efficiency for both transverse components and to minimize undesired cross-transfers. Our experiments, conducted on the 30 kDa membrane protein GlpG embedded in E. coli liposomes, have demonstrated enhanced sensitivity compared to the most effective dipolar and J-coupling-based 13C-13C mixing sequences. Notably, a non-uniformly sampled 4D hCXCANH spectrum with exceptionally high sensitivity was obtained in just a few days using a 600 MHz spectrometer equipped with a 1.3 mm probe operating at a magic angle spinning rate of 55 kHz.
Overview
The claims and statistics of this paper haven’t been checked yet.
Run the check — free, no account needed. It reads the open-access text and checks the sources it cites.
Integrity signals
Registry
Cites
Statistics
Figures
Verification
Claims the paper makes
The claims and statistics of this paper haven’t been checked yet.
Run the check — free, no account needed. It reads the open-access text and checks the sources it cites.
Self-check
Percentages, sums and reported differences re-computed from the paper’s own numbers.
The self-check needs the paper’s full text.
Citations
Cites
Highly accurate protein structure prediction with AlphaFold
Jumper, J., Evans, R., Pritzel, A., Green, T., Figurnov, M., Ronneberger, O., Tunyasuvunakool, K., Bates, R., Žídek, A., Potapenko, A., et al. (2021) · Nature · doi:10.1038/s41586-021-03819-2 · Cited by 43,764
Varadi, M., Bertoni, D., Magana, P., Paramval, U., Pidruchna, I., Radhakrishnan, M., Tsenkov, M., Nair, S., Mirdita, M., Yeo, J., et al. (2024) · Nucleic Acids Research · doi:10.1093/nar/gkad1011 · Cited by 2,052
Metadata
- Authors
- Öster, C., Chevelkov, V., & Lange, A.
- Affiliations
- Leibniz-Forschungsinstitut für Molekulare Pharmakologie (DE)
- Humboldt-Universität zu Berlin (DE)
- Corresponding author
- Öster, Carl
- Lange, Adam
- Venue
- Journal of Biomolecular NMR
- Publisher
- American Chemical Society (ACS)
- Published
- 2024-08-16
- Volume
- 79
- Issue
- 1
- Pages
- 25-34
- ISSN
- 0925-2738 (ISSN-L)
- PMC
- PMC11832555
- OpenAlex
- W4406721611
- Cited by
- 5
- References
- 2
- Citations by year
- 2026: 2 · 2025: 3
- FWCI
- 1.26
- Type
- journal article
- Language
- en
- Open access
- hybrid
- doi.org
- Locations
- Journal of Biomolecular NMR (publishedVersion, cc-by)
- ChemRxiv (acceptedVersion, cc-by)
- PubMed Central (publishedVersion, cc-by)
- PubMed (publishedVersion)
- edoc Publication server (Humboldt University of Berlin) (submittedVersion, cc-by)
- edoc Publication server (Humboldt University of Berlin) (cc-by)
- Funders
- Deutsche Forschungsgemeinschaft (EXC 2008/1 (UniSysCat) - 390540038)
- Topics
- Physical Sciences › Chemistry › Spectroscopy › Advanced NMR Techniques and Applications
- Life Sciences › Biochemistry, Genetics and Molecular Biology › Molecular Biology › Protein Structure and Dynamics
- Life Sciences › Biochemistry, Genetics and Molecular Biology › Molecular Biology › Lipid Membrane Structure and Behavior
- Keywords
- sensitivity enhancement, side-chain assignment, membrane proteins, GlpG, transfer efficiency, dipolar coupling, spin-spin coupling, chemical shift assignment
- MeSH terms
- Carbon Isotopes, Escherichia coli, Membrane Proteins, Nuclear Magnetic Resonance, Biomolecular, Escherichia coli Proteins
About these checks
Registry, retraction, Cites and statistics results are computed, not judged, with one exception: a printed reference that no index lists is read once by a model before it counts as a citation error. Claims are extracted by a model and kept only when their quote appears verbatim in the text; each cited source is then checked, with a model’s help, for whether it says what the claim relies on. Those verdicts can be wrong — read the claim’s quote and the cited source before relying on one.
Statistics and arithmetic are recomputed, not judged.
Confidence bands are shown only for fields calibrated on our annotated test set. None is calibrated yet, so no band is shown.
What counts as a claim ›How we measure confidence ›How we check this ›
Are you an author, or do you see a problem with this page? Request a review
How to cite
Cite CoChat for the checks on this page, and the paper for its own findings.
- This page
- CoChat. (2026). Citation check: Evaluation of TOCSY mixing for sensitivity-enhancement in solid-state NMR and application of 4D experiments for side-chain assignments of the full-length 30 kDa membrane protein GlpG. https://app.cochat.ai/papers/10.26434/chemrxiv-2024-f6qmr
- The paper
- Öster, C., Chevelkov, V., & Lange, A. (2024). Evaluation of TOCSY mixing for sensitivity-enhancement in solid-state NMR and application of 4D experiments for side-chain assignments of the full-length 30 kDa membrane protein GlpG. Journal of Biomolecular NMR. https://doi.org/10.26434/chemrxiv-2024-f6qmr
Data sources
Bibliographic data: Semantic Scholar, OpenAlex, Crossref.
Contains information from the Semantic Scholar Academic Graph Datasets, made available under the ODC Attribution License (ODC-BY 1.0).
Semantic Scholar’s data is described in: Kinney, R., et al. (2023). The Semantic Scholar Open Data Platform. arXiv:2301.10140.
