

The DOI matches its Crossref record; 29 of the 30 references it cites were found in a registry or an index.
Multicenter Epidemiologic Study of Coronavirus Disease-Associated Mucormycosis, India
Open accessAbstract
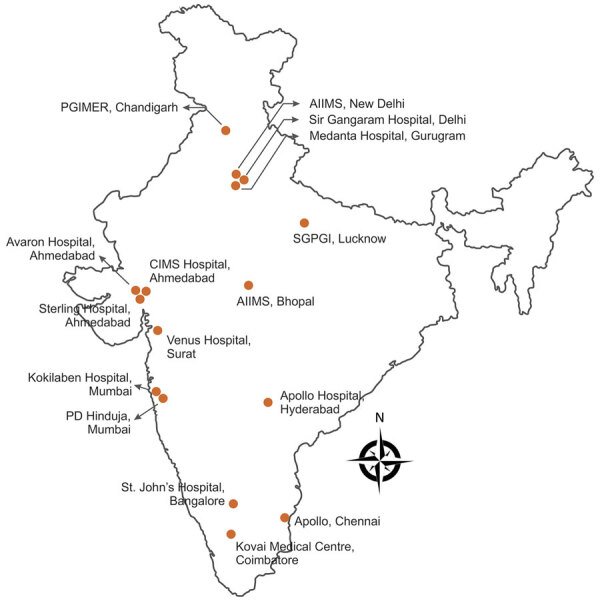
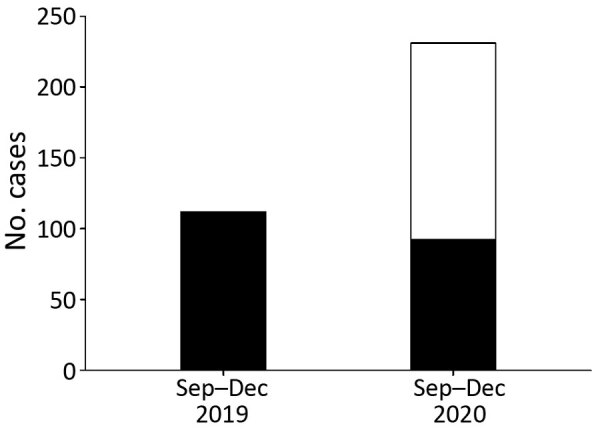
econdary infections are known to complicate the clinical course of coronavirus disease .Bacterial infections are the most common secondary infections, but increasing reports of systemic fungal infections are causing concern.In the early part of the COVID-19 pandemic, <1% of secondary infections reported in COVID-19 patients were fungal (1,2).Preexisting conditions, indiscriminate use of antimicrobial and glucocorticoid drugs, and lapses in infection control practices are putative factors contributing to the emergence of systemic fungal infections in severe COVID-19 cases (3).After incidence of candidemia and invasive aspergillosis in COVID-19 patients increased (4,5), awareness of possible fungal co-infections increased among clinicians and microbiologists.One study reported invasive fungal infections in ≈6% of hospitalized COVID-19 patients (6).Occasional reports of COVID-19-associated mucormycosis (CAM) from various centers (7,8) and a series of 18 cases from a city in South India increased our concerns about CAM (9).India has a high burden of mucormycosis among patients with uncontrolled diabetes mellitus, and many severe COVID-19 patients have diabetes (8,10).India also is one of the countries worst affected by the COVID-19 pandemic.Thus, we would expect India to have many CAM cases.We conducted a nationwide multicenter study to evaluate the epidemiology and outcomes of CAM and compare the results with cases of mucormycosis unrelated to COVID-19 (non-CAM).
Overview
The claims and statistics of this paper haven’t been checked yet.
Run the check — free, no account needed. It reads the open-access text and checks the sources it cites.
Integrity signals
Registry
Cites
Statistics
Figures
Verification
Claims the paper makes
The claims and statistics of this paper haven’t been checked yet.
Run the check — free, no account needed. It reads the open-access text and checks the sources it cites.
Claims other papers make about this one
Each is checked against this paper’s own text: does it say what the citing paper says it does?
In the citing paper
“In India, a steep increase of mucormycosis cases was observed during the COVID-19 pandemic [88,89], driven by specific immunological mechanisms that predispose COVID-19 patients to mucormycosis [87], as well as overuse of systemic corticosteroids and an increase in the population with undiagnosed or uncontrolled diabetes [88].”
From Race and ethnicity: Risk factors for fungal infections? (2023) · cites this paper as [89]
Self-check
Percentages, sums and reported differences re-computed from the paper’s own numbers.
The self-check needs the paper’s full text.
Citations
Cites
Cornely, O. A., Alastruey‐Izquierdo, A., Arenz, D., Chen, S. C. ‐., Dannaoui, É., a, B. H., Hoenigl, M., Jensen, H. E., Lagrou, K., Lewis, R. E., et al. (2019) · The Lancet Infectious Diseases · doi:10.1016/s1473-3099(19)30312-3 · Cited by 1,843
Self-citationJeong, W., Keighley, C., Wolfe, R. S., Lee, W. L., Slavin, M. A., Kong, D. C. M., & Chen, S. C.-A. (2018) · Clinical Microbiology and Infection · doi:10.1016/j.cmi.2018.07.011 · Cited by 1,105
Global Epidemiology of Mucormycosis
Prakash, H., & Chakrabarti, A. (2019) · Journal of Fungi · doi:10.3390/jof5010026 · Cited by 955
Self-citationViral and host factors related to the clinical outcome of COVID-19
Zhang, X., Tan, Y., Ling, Y., Lü, G., Liu, F., Yi, Z., Jia, X., Wu, M., Shi, B., Xu, S., et al. (2020) · Nature · doi:10.1038/s41586-020-2355-0 · Cited by 874
Levin, A. T., Hanage, W. P., Owusu-Boaitey, N., Cochran, K. B., Walsh, S. P., & Meyerowitz-Katz, G. (2020) · European Journal of Epidemiology · doi:10.1007/s10654-020-00698-1 · Cited by 844
Pijls, B. G. C. W., Jolani, S., Atherley, A., Derckx, R. T., Dijkstra, J. I. R., Franssen, G. H. L. M., Hendriks, S., Richters, A., Jellema, A., Zalpuri, S., et al. (2021) · BMJ Open · doi:10.1136/bmjopen-2020-044640 · Cited by 596
Garg, D. K., Muthu, V., Sehgal, I. S., Ramachandran, R., Kaur, H., Bhalla, A., Puri, G. D., Chakrabarti, A., & Agarwal, R. (2021) · Mycopathologia · doi:10.1007/s11046-021-00528-2 · Cited by 589
Self-citationSARS-CoV-2 infects and replicates in cells of the human endocrine and exocrine pancreas
Müller, J. A., Groß, R. M., Conzelmann, C., Krüger, J., Merle, U., Steinhart, J., Weil, T., Koepke, L., Bozzo, C. P., Read, C., et al. (2021) · Nature Metabolism · doi:10.1038/s42255-021-00347-1 · Cited by 564
Patel, A. K., Kaur, H., Xess, I., Michael, J. S., Savio, J., Rudramurthy, S. M., Singh, R., Shastri, P. S., Umabala, P., Sardana, R., et al. (2019) · Clinical Microbiology and Infection · doi:10.1016/j.cmi.2019.11.021 · Cited by 407
Self-citationA prospective multicenter study on mucormycosis in India: Epidemiology, diagnosis, and treatment
Prakash, H., Ghosh, A. K., Rudramurthy, S. M., Singh, P., Xess, I., Savio, J., Pamidimukkala, U., Jillwin, J., Varma, S. C., Das, A., et al. (2018) · Medical Mycology · doi:10.1093/mmy/myy060 · Cited by 392
Self-citation
Cited by
Sorted by citations
Global incidence and mortality of severe fungal disease
Denning, D. W. (2024) · The Lancet Infectious Diseases · doi:10.1016/s1473-3099(23)00692-8 · Cited by 1,640
COVID-19-associated fungal infections
Hoenigl, M., Seidel, D., Sprute, R., Cunha, C., Oliverio, M., Goldman, G. H., Ibrahim, A. S., & Carvalho, A. (2022) · Nature Microbiology · doi:10.1038/s41564-022-01172-2 · Cited by 482
Muthu, V., Rudramurthy, S. M., Chakrabarti, A., & Agarwal, R. (2021) · Mycopathologia · doi:10.1007/s11046-021-00584-8 · Cited by 244
Self-citationRudramurthy, S. M., Hoenigl, M., Meis, J. F. G. M., Cornely, O. A., Muthu, V., Gangneux, J., Perfect, J. R., Chakrabarti, A., & ISHAM, E. A. (2021) · Mycoses · doi:10.1111/myc.13335 · Cited by 214
Self-citationThe WHO fungal priority pathogens list: a crucial reappraisal to review the prioritisation
Casalini, G., Giacomelli, A., & Antinori, S. (2024) · The Lancet Microbe · doi:10.1016/s2666-5247(24)00042-9 · Cited by 217
Metadata
- Authors
- Patel, A., Agarwal, R., Rudramurthy, S. M., Shevkani, M., Xess, I., Sharma, R., Savio, J., Sethuraman, N., Madan, S., Shastri, P., Thangaraju, D., Marak, R., Tadepalli, K., Savaj, P., Sunavala, A., Gupta, N., Singhal, T., Muthu, V., Chakrabarti, A., & Network3, M.
- Affiliations
- Sterling Hospitals (IN)
- Medanta The Medicity (IN)
- Corresponding author
- Chakrabarti, Arunaloke
- ORCID
- Venue
- Emerging Infectious Diseases
- Published
- 2021-09
- Volume
- 27
- Issue
- 9
- Pages
- 2349-2359
- ISSN
- 1080-6040 (ISSN-L)
- 1080-6059
- PMC
- PMC8386807
- OpenAlex
- W3164172839
- Cited by
- 479
- References
- 30
- Citations by year
- 2026: 26 · 2025: 35 · 2024: 60 · 2023: 114 · 2022: 163 · 2021: 81
- FWCI
- 33.10
- Type
- journal article
- Language
- en
- Open access
- diamond
- doi.org
- Licence
- cc-by
- Locations
- Emerging infectious diseases (publishedVersion, cc-by)
- PubMed Central (publishedVersion, cc-by)
- PubMed (publishedVersion)
- DOAJ (DOAJ: Directory of Open Access Journals) (submittedVersion, cc-by-sa)
- Topics
- Health Sciences › Medicine › Infectious Diseases › Antifungal resistance and susceptibility
- Health Sciences › Medicine › Infectious Diseases › COVID-19 Clinical Research Studies
- Health Sciences › Medicine › Infectious Diseases › Infectious Diseases and Mycology
- Keywords
- COVID-19-associated mucormycosis, mucormycosis, SARS-CoV-2, secondary fungal infection, invasive fungal infections, clinical outcomes, diabetes mellitus, glucocorticoid use
- MeSH terms
- COVID-19, SARS-CoV-2, Antifungal Agents, Humans, India, Mucormycosis, Retrospective Studies, Pandemics
About these checks
Registry, retraction, Cites and statistics results are computed, not judged, with one exception: a printed reference that no index lists is read once by a model before it counts as a citation error. Claims are extracted by a model and kept only when their quote appears verbatim in the text; each cited source is then checked, with a model’s help, for whether it says what the claim relies on. Those verdicts can be wrong — read the claim’s quote and the cited source before relying on one.
Statistics and arithmetic are recomputed, not judged.
Confidence bands are shown only for fields calibrated on our annotated test set. None is calibrated yet, so no band is shown.
What counts as a claim ›How we measure confidence ›How we check this ›
Are you an author, or do you see a problem with this page? Request a review
