Cited by 25

The DOI matches its Crossref record.

Long Non-coding RNA Maternally Expressed 3 Increases the Expression of Neuron-Specific Genes by Targeting miR-128-3p in All-Trans Retinoic Acid-Induced Neurogenic Differentiation From Amniotic Epithelial Cells

Gao, Yuhua, Zhang, Ranxi, Wei, Guanghe, Dai, Shanshan, Zhang, Xue, Yang, Wancai, Li, Xiangchen, Bai, Chunyu·2019·Frontiers in Cell and Developmental Biology

Overview

The claims and statistics of this paper haven’t been checked yet.

Run the check — free, no account needed. It reads the open-access text and checks the sources it cites.

A few free checks a day · papers already verified open instantly · results are public

Integrity signals

Registry

Crossref · 10.3389/fcell.2019.00342

Cites

Statistics

Figures

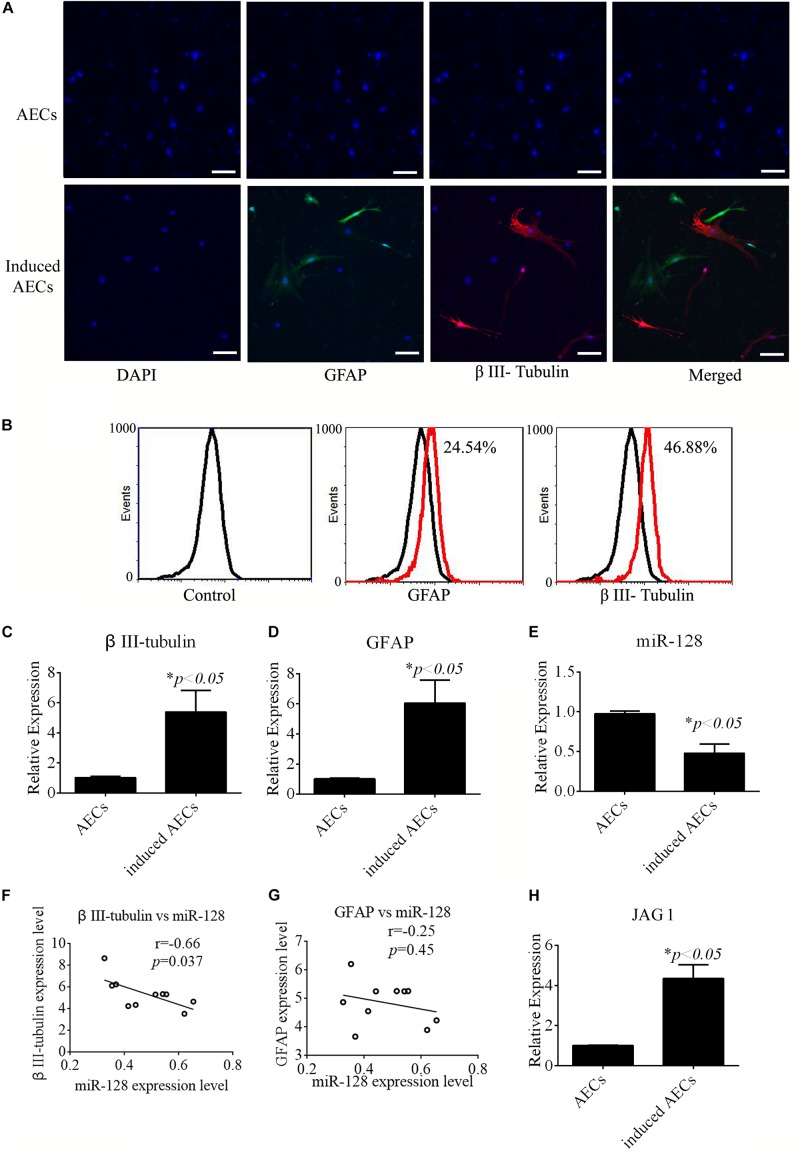
FIGURE 1 Neurogenic differentiation derived from amniotic epithelial cells (AECs). AECs were induced with all-trans retinoic acid (ATRA) for 18 days. (A,B) Neurogenic markers were detected by immunofluorescence staining and flow cytometry. Neuron-specific genes (β III-tubulin) and astrocyte-specific genes (glial fibrillary acidic protein: GFAP) were detected. Scale bar = 100 μm. (C–E) RT-qPCR was used to determine the relative expression of β III-tubulin, GFAP, and miR-128-3p in non-induced AECs and induced AECs. (F,G) Comparative analysis of miR-128-3p and β III-tubulin or GFAP in neurogenic differentiation. (H) The expression of Jagged 1 (JAG1), a putative target for miR-128-3p in neurogenic differentiation, was significantly altered in induced AECs. ∗P < 0.05.
FIGURE 1 Neurogenic differentiation derived from amniotic epithelial cells (AECs). AECs were induced with all-trans retinoic acid (ATRA) for 18 days. (A,B) Neurogenic markers were detected by immunofluorescence staining and flow cytometry. Neuron-specific genes (β III-tubulin) and astrocyte-specific genes (glial fibrillary acidic protein: GFAP) were detected. Scale bar = 100 μm. (C–E) RT-qPCR was used to determine the relative expression of β III-tubulin, GFAP, and miR-128-3p in non-induced AECs and induced AECs. (F,G) Comparative analysis of miR-128-3p and β III-tubulin or GFAP in neurogenic differentiation. (H) The expression of Jagged 1 (JAG1), a putative target for miR-128-3p in neurogenic differentiation, was significantly altered in induced AECs. ∗P < 0.05.CC BY · PubMed Central
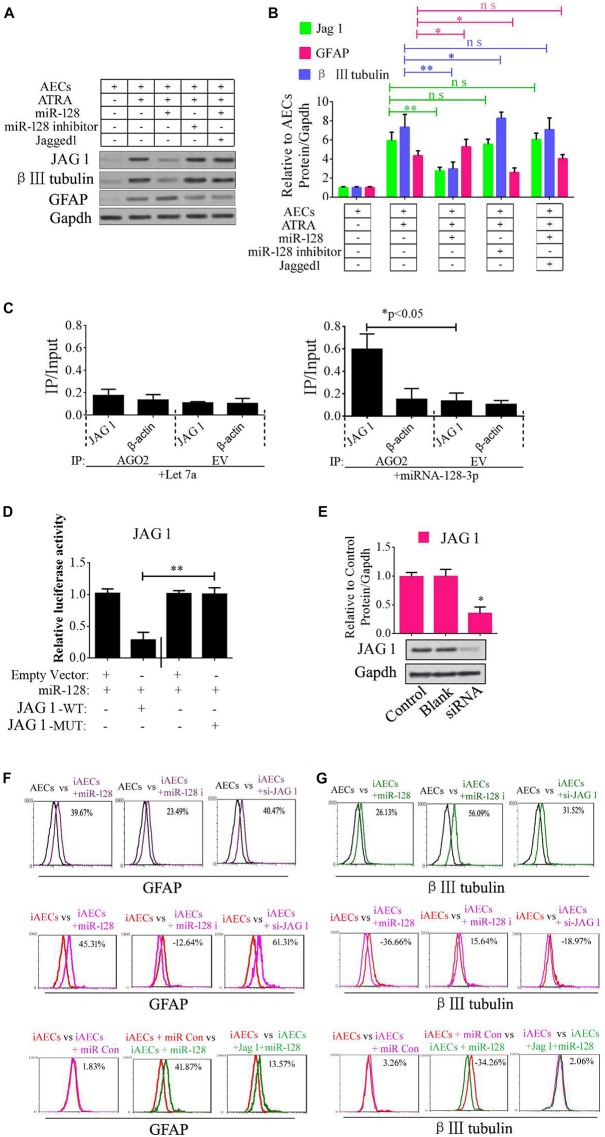
FIGURE 2 Role of miR-128-3p in neurogenic differentiation from AECs. (A,B) Neurocyte markers were tested using Western blotting after AECs were exposed to miR-128-3p, miR-128-3p inhibitor, and Jagged 1, respectively. Protein abundance was analyzed using ImageJ tools. The data revealed that Jagged1 could rescue the β III-tubulin expression after overexpressed miR-128 in AECs. ∗P < 0.05; ∗∗P < 0.01; ns, non-significant. (C) Immunoprecipitation of Myc-tagged Argonaute 2 (AGO2) from AECs co-transfected with Myc-AGO2 and either miR-128-3p or Let-7a (negative control). The empty vector (EV) served as the Myc-AGO2-related negative control. Jag 1 and β-actin mRNA levels were quantified using qPCR, and the relative immunoprecipitate (IP)/input (cell total RNA) values were plotted. ∗P < 0.05. (D) The effect of miR-128-3p on JAG1 expression was evaluated using luciferase reporter assays. ∗∗P < 0.01. (E) Western blot analysis of JAG1 expression was performed following siRNA targeting. Protein abundance was analyzed using ImageJ tools. Glyceraldehyde-3-phosphate dehydrogenase (GAPDH) was used as an endogenous control and Scramble was used as a control. Western blot images are representative of at least three independent replicates. ∗P < 0.05. (F,G) Neurocyte markers were tested using flow cytometry after induced AECs were exposed to various small RNAs or Jagged 1. iAECs, induced AECs; miR-128 i, miR-128 inhibitor; miR Con, miR-128 mimics control.
FIGURE 2 Role of miR-128-3p in neurogenic differentiation from AECs. (A,B) Neurocyte markers were tested using Western blotting after AECs were exposed to miR-128-3p, miR-128-3p inhibitor, and Jagged 1, respectively. Protein abundance was analyzed using ImageJ tools. The data revealed that Jagged1 could rescue the β III-tubulin expression after overexpressed miR-128 in AECs. ∗P < 0.05; ∗∗P < 0.01; ns, non-significant. (C) Immunoprecipitation of Myc-tagged Argonaute 2 (AGO2) from AECs co-transfected with Myc-AGO2 and either miR-128-3p or Let-7a (negative control). The empty vector (EV) served as the Myc-AGO2-related negative control. Jag 1 and β-actin mRNA levels were quantified using qPCR, and the relative immunoprecipitate (IP)/input (cell total RNA) values were plotted. ∗P < 0.05. (D) The effect of miR-128-3p on JAG1 expression was evaluated using luciferase reporter assays. ∗∗P < 0.01. (E) Western blot analysis of JAG1 expression was performed following siRNA targeting. Protein abundance was analyzed using ImageJ tools. Glyceraldehyde-3-phosphate dehydrogenase (GAPDH) was used as an endogenous control and Scramble was used as a control. Western blot images are representative of at least three independent replicates. ∗P < 0.05. (F,G) Neurocyte markers were tested using flow cytometry after induced AECs were exposed to various small RNAs or Jagged 1. iAECs, induced AECs; miR-128 i, miR-128 inhibitor; miR Con, miR-128 mimics control.CC BY · PubMed Central
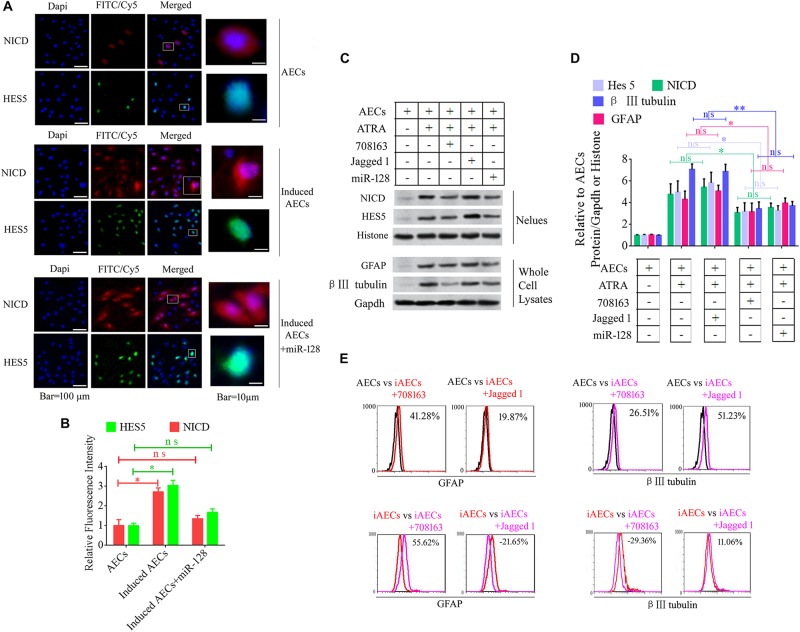
FIGURE 3 Notch pathway inhibition by miR-128-3p decreases the expression of neurocyte markers in neurogenic differentiation. (A) Immunofluorescence staining illustrates activation of the Notch pathway based on the nuclear expression of intercellular activated notch 1 (Notch intracellular domain: NICD) and Hes 5 after ATRA induction and miR-128 addition. (B) Fluorescence intensity was analyzed using ImageJ tools. (C,D) Western blot data of NICD and HES5 expression after JAG1, BMS-708163, or miR-128 overexpression treatment. Protein abundance was analyzed using ImageJ tools. ∗P < 0.05; ∗∗P < 0.01; ns, non-significant. (E) Neurocyte markers were tested using flow cytometry in induced AECs exposed to 708163 (an inhibitor of the Notch pathway) or Jagged 1 (activator for the Notch pathway). iAECs, induced AECs.
FIGURE 3 Notch pathway inhibition by miR-128-3p decreases the expression of neurocyte markers in neurogenic differentiation. (A) Immunofluorescence staining illustrates activation of the Notch pathway based on the nuclear expression of intercellular activated notch 1 (Notch intracellular domain: NICD) and Hes 5 after ATRA induction and miR-128 addition. (B) Fluorescence intensity was analyzed using ImageJ tools. (C,D) Western blot data of NICD and HES5 expression after JAG1, BMS-708163, or miR-128 overexpression treatment. Protein abundance was analyzed using ImageJ tools. ∗P < 0.05; ∗∗P < 0.01; ns, non-significant. (E) Neurocyte markers were tested using flow cytometry in induced AECs exposed to 708163 (an inhibitor of the Notch pathway) or Jagged 1 (activator for the Notch pathway). iAECs, induced AECs.CC BY · PubMed Central
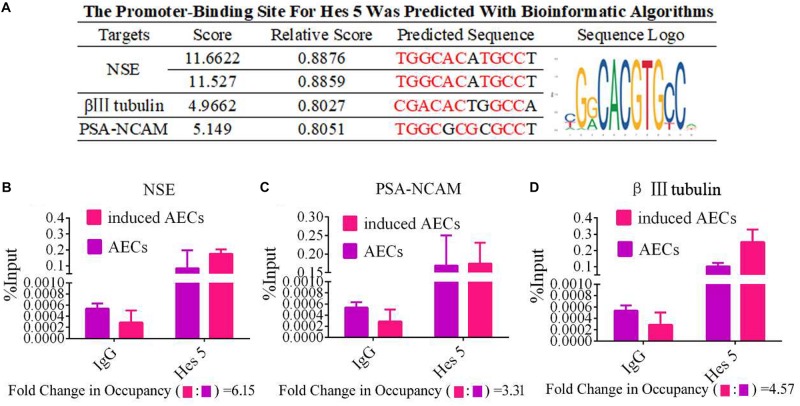
FIGURE 4 HES5 promotes transcription of the neurocyte marker genes β III-tubulin, NSE, and PSA-NCAM via physical interactions with their promoters. (A) HES5 promoter-binding sites were predicted using bioinformatics algorithms in the promoter region of β III-tubulin, NSE, and PSA-NCAM. Predicted sequences were calculated according to the relative frequency of promotor sequences, which have the potential to bind Hes 5 but do not completely conform to the sequence logo of Hes 5. Consensus sequences are shown in red. (B–D) The amount of HES5 enriched within neurocyte marker gene promoter regions in normal and induced AECs was quantified by ChIP-coupled real-time PCR. The percentage of input was calculated according to threshold cycle values. The negative control for Hes 5 binding sites is shown in the Supplementary Material. Data are presented as the mean ± SD (three independent experiments).
FIGURE 4 HES5 promotes transcription of the neurocyte marker genes β III-tubulin, NSE, and PSA-NCAM via physical interactions with their promoters. (A) HES5 promoter-binding sites were predicted using bioinformatics algorithms in the promoter region of β III-tubulin, NSE, and PSA-NCAM. Predicted sequences were calculated according to the relative frequency of promotor sequences, which have the potential to bind Hes 5 but do not completely conform to the sequence logo of Hes 5. Consensus sequences are shown in red. (B–D) The amount of HES5 enriched within neurocyte marker gene promoter regions in normal and induced AECs was quantified by ChIP-coupled real-time PCR. The percentage of input was calculated according to threshold cycle values. The negative control for Hes 5 binding sites is shown in the Supplementary Material. Data are presented as the mean ± SD (three independent experiments).CC BY · PubMed Central
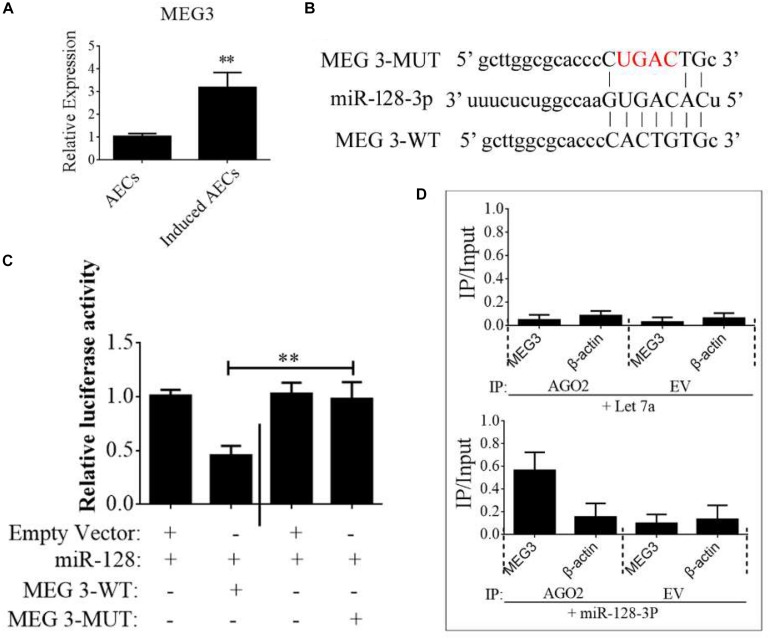
FIGURE 5 lncRNA MEG3 targets miR-128-3p in neurogenic differentiation from AECs. (A) The expression of MEG3 was analyzed in normal and induced AECs using RT-qPCR. (B) The binding site between MEG3 and miR-128-3p was predicted using bioinformatics algorithms and subsequently mutated to verify interactions. (C) Full-length MEG3 (WT) and sequences containing different mutated variants of the miR-128-3p binding site (MUT) were tested to determine the effect on miR-15/16 expression. The pRL-40 vector alone was used as an internal control. Results are expressed as relative luciferase activity and represent the mean ± SD of at least three replicates. (D) Immunoprecipitation of Myc-tagged Argonaute 2 (AGO2) from AECs co-transfected with Myc-AGO2 and either miR-128-3p or Let-7a (negative control). Empty vector (EV) served as the Myc-AGO2-related negative control. MEG3 and β-actin mRNA levels were quantified using qPCR, and relative immunoprecipitate (IP)/input (cell total RNA) values were plotted. ∗P < 0.05; ∗∗P < 0.01.
FIGURE 5 lncRNA MEG3 targets miR-128-3p in neurogenic differentiation from AECs. (A) The expression of MEG3 was analyzed in normal and induced AECs using RT-qPCR. (B) The binding site between MEG3 and miR-128-3p was predicted using bioinformatics algorithms and subsequently mutated to verify interactions. (C) Full-length MEG3 (WT) and sequences containing different mutated variants of the miR-128-3p binding site (MUT) were tested to determine the effect on miR-15/16 expression. The pRL-40 vector alone was used as an internal control. Results are expressed as relative luciferase activity and represent the mean ± SD of at least three replicates. (D) Immunoprecipitation of Myc-tagged Argonaute 2 (AGO2) from AECs co-transfected with Myc-AGO2 and either miR-128-3p or Let-7a (negative control). Empty vector (EV) served as the Myc-AGO2-related negative control. MEG3 and β-actin mRNA levels were quantified using qPCR, and relative immunoprecipitate (IP)/input (cell total RNA) values were plotted. ∗P < 0.05; ∗∗P < 0.01.CC BY · PubMed Central
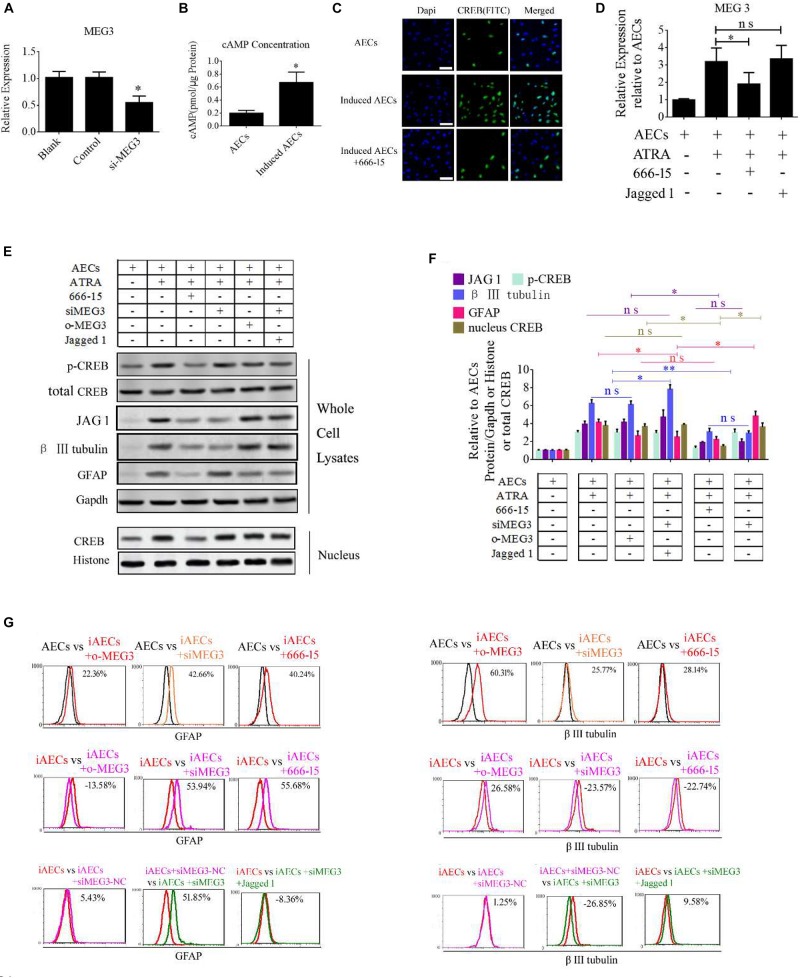
FIGURE 6 ATRA increases the expression of MEG3 through the cAMP/CREB pathway to modulate neurogenic differentiation. (A) A siRNA for MEG3 (si-MEG3) effectively depressed the expression of MEG3 in induced AECs (P < 0.05). (B) The concentration of cAMP was detected between normal significantly increased in induced compared with normal AECs (P < 0.05). (C) Expression of cAMP response element-binding protein (CREB) was detected under ATRA or 666-15 (a CREB inhibitor) treatment using immunofluorescence staining. (D) MEG3 expression was analyzed under 666-15 or Jagged 1 treatment by RT-qPCR. (E,F) Expression of β III-tubulin and GFAP were as assessed using Western blotting. (G) β III-tubulin and GFAP expression was analyzed following single or assorted overexpression of MEG3 (o-MEG3), si-MEG3 or 666-15 treatment in induced AECs. iAECs, induced AECs; siMEG3-NC, siMEG3 negative control. ∗P < 0.05; ∗∗P < 0.01; ns, non-significant.
FIGURE 6 ATRA increases the expression of MEG3 through the cAMP/CREB pathway to modulate neurogenic differentiation. (A) A siRNA for MEG3 (si-MEG3) effectively depressed the expression of MEG3 in induced AECs (P < 0.05). (B) The concentration of cAMP was detected between normal significantly increased in induced compared with normal AECs (P < 0.05). (C) Expression of cAMP response element-binding protein (CREB) was detected under ATRA or 666-15 (a CREB inhibitor) treatment using immunofluorescence staining. (D) MEG3 expression was analyzed under 666-15 or Jagged 1 treatment by RT-qPCR. (E,F) Expression of β III-tubulin and GFAP were as assessed using Western blotting. (G) β III-tubulin and GFAP expression was analyzed following single or assorted overexpression of MEG3 (o-MEG3), si-MEG3 or 666-15 treatment in induced AECs. iAECs, induced AECs; siMEG3-NC, siMEG3 negative control. ∗P < 0.05; ∗∗P < 0.01; ns, non-significant.CC BY · PubMed Central
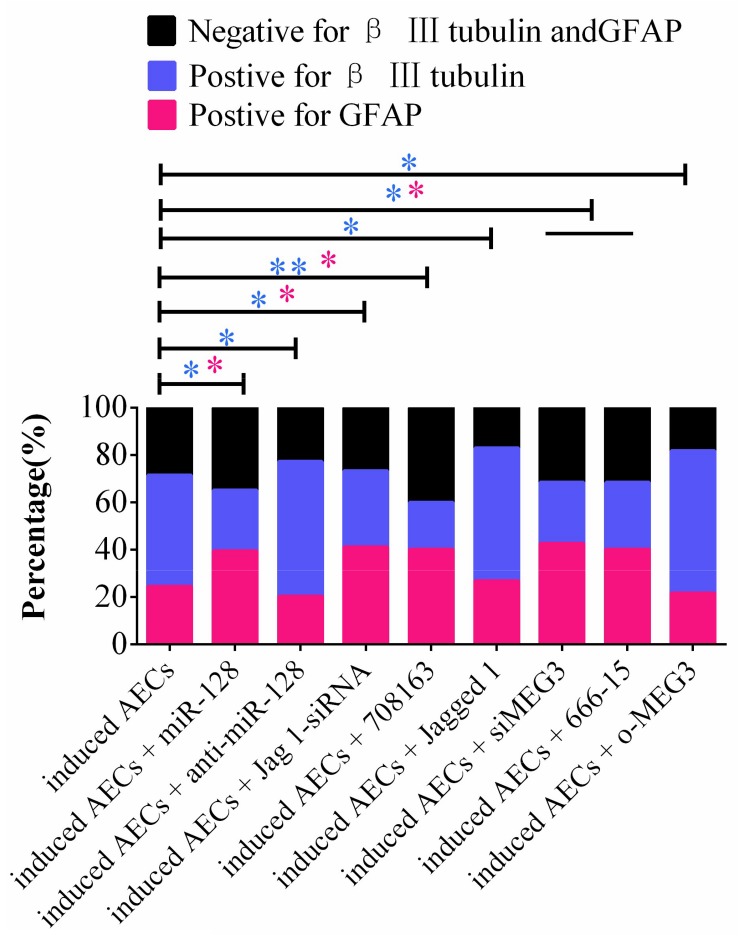
FIGURE 7 Statistical analysis of FCM data in miR-128-3p and its upstream or downstream genes affecting neurogenic differentiation. miR-128-3p reduces the amount of neurons and increases the amount of gliocytes by targeting JAG1 to prevent Notch pathway activation, which may enhance the transcription of neuron-specific markers. MEG3 increases the amount of neurons and reduces the amount of gliocytes via targeting miR-128-3p to activate the Notch pathway (∗P < 0.05; ∗∗P < 0.01; blue asterisk: neurons; pink asterisk: gliocyte).
FIGURE 7 Statistical analysis of FCM data in miR-128-3p and its upstream or downstream genes affecting neurogenic differentiation. miR-128-3p reduces the amount of neurons and increases the amount of gliocytes by targeting JAG1 to prevent Notch pathway activation, which may enhance the transcription of neuron-specific markers. MEG3 increases the amount of neurons and reduces the amount of gliocytes via targeting miR-128-3p to activate the Notch pathway (∗P < 0.05; ∗∗P < 0.01; blue asterisk: neurons; pink asterisk: gliocyte).CC BY · PubMed Central
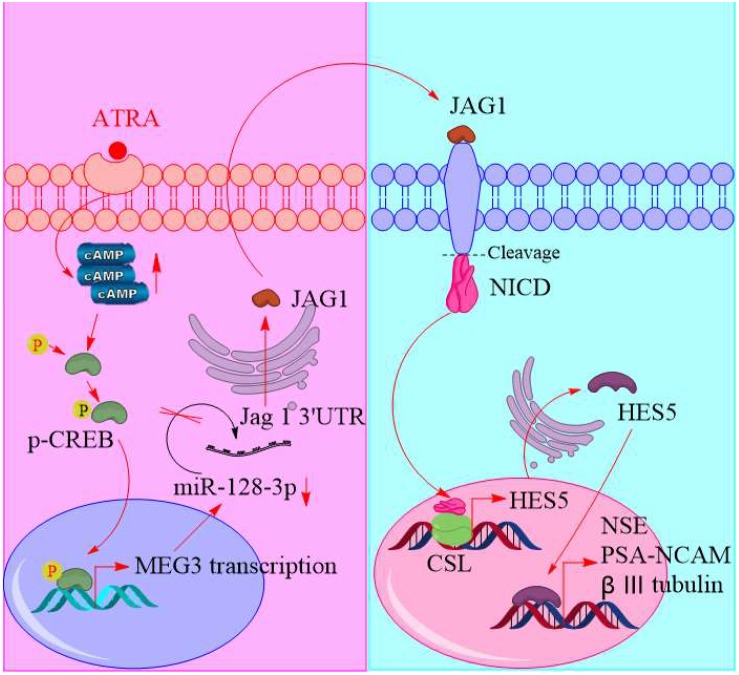
FIGURE 8 Schematic of promoting neurogenic differentiation from human amniotic epithelial cells.
FIGURE 8 Schematic of promoting neurogenic differentiation from human amniotic epithelial cells.CC BY · PubMed Central

Verification

Claims the paper makes

The claims and statistics of this paper haven’t been checked yet.

Run the check — free, no account needed. It reads the open-access text and checks the sources it cites.

A few free checks a day · papers already verified open instantly · results are public

Claims other papers make about this one

Each is checked against this paper’s own text: does it say what the citing paper says it does?

Self-check

Percentages, sums and reported differences re-computed from the paper’s own numbers.

The self-check needs the paper’s full text.

Citations

Cites

No references could be resolved yet.

Research works printed but not linked: 23

  1. Bai, 2019, MiR-15/16 mediate crosstalk between the MAPK and Wnt/beta-catenin pathways during hepatocyte differentiation from amniotic epithelial cells., Biochim. Biophys. Acta Gene Regul. Mech., 1862, 567, 10.1016/j.bbagrm.2019.02.003 · DOI
  2. Bofill-De Ros, 2019, IsomiRs: expanding the miRNA repression toolbox beyond the seed., Biochim. Biophys. Acta Gene Regul. Mech., 10.1016/j.bbagrm.2019.03.005 · DOI · Paper page
  3. Das, 2019, Circular RNAs in myogenesis., Biochim. Biophys. Acta Gene Regul. Mech., 10.1016/j.bbagrm.2019.02.011 · DOI
  4. Davenport, 2016, Anterior-Posterior patterning of definitive endoderm generated from human embryonic stem cells depends on the differential signaling of retinoic acid. Wnt-, and BMP-Signaling., Stem Cells, 34, 2635, 10.1002/stem.2428 · DOI
  5. Gao, 2016, Combination of melatonin and Wnt-4 promotes neural cell differentiation in bovine amniotic epithelial cells and recovery from spinal cord injury., J. Pineal Res., 60, 303, 10.1111/jpi.12311 · DOI
  6. Ji, 2018, Role of long non-coding RNAs in metabolic control., Biochim. Biophys. Acta Gene Regul. Mech., 10.1016/j.bbagrm.2018.12.006 · DOI
  7. Khan, 2018, JASPAR 2018: update of the open-access database of transcription factor binding profiles and its web framework., Nucleic Acids Res., 46, D260, 10.1093/nar/gkx1126 · DOI
  8. Kong, 2018, Generation of motor neurons requires spatiotemporal coordination between retinoic acid and Mib-mediated Notch signaling., Anim. Cells Syst., 22, 76, 10.1080/19768354.2018.1443494 · DOI
  9. Lan, 2018, Long non-coding RNA MEG3 prevents vascular endothelial cell senescence by impairing miR-128-dependent Girdin down-regulation., Am. J. Physiol. Cell Physiol., 316, C830, 10.1152/ajpcell.00262.2018 · DOI
  10. Mark, 2015, Role of retinoic acid receptor (RAR) signaling in post-natal male germ cell differentiation., Biochim. Biophys. Acta, 1849, 84, 10.1016/j.bbagrm.2014.05.019 · DOI
  11. Osathanon, 2017, Notch signaling partly regulates the osteogenic differentiation of retinoic acid-treated murine induced pluripotent stem cells., J. Oral Sci., 59, 405, 10.2334/josnusd.16-0552 · DOI
  12. Samarut, 2015, ZebRA: an overview of retinoic acid signaling during zebrafish development., Biochim. Biophys. Acta, 1849, 73, 10.1016/j.bbagrm.2014.05.030 · DOI
  13. Suwa, 2016, Retinoic acid enhances progesterone production via the cAMP/PKA signaling pathway in immature rat granulosa cells., Biochem. Biophys. Rep., 8, 62, 10.1016/j.bbrep.2016.08.013 · DOI
  14. Vargas-Medrano, 2019, Up-regulation of protective neuronal MicroRNAs by FTY720 and novel FTY720-derivatives., Neurosci. Lett., 690, 178, 10.1016/j.neulet.2018.10.040 · DOI
  15. Volvert, 2012, MicroRNAs tune cerebral cortical neurogenesis., Cell Death Differ., 19, 1573, 10.1038/cdd.2012.96 · DOI
  16. Xavier-Neto, 2015, Signaling through retinoic acid receptors in cardiac development: doing the right things at the right times., Biochim. Biophys. Acta, 1849, 94, 10.1016/j.bbagrm.2014.08.003 · DOI
  17. Yi, 2018, Effect of microRNA-128 on cisplatin resistance of glioma SHG-44 cells by targeting JAG1., J. Cell. Biochem., 119, 3162, 10.1002/jcb.26469 · DOI
  18. Zhang, 2019, C1q-TNF-related protein-3 attenuates pressure overload-induced cardiac hypertrophy by suppressing the p38/CREB pathway and p38-induced ER stress., Cell Death Dis., 10, 10.1038/s41419-019-1749-0 · DOI
  19. Zhang, 2016, MiRNA-128 regulates the proliferation and neurogenesis of neural precursors by targeting PCM1 in the developing cortex., eLife, 5, 10.7554/eLife.11324 · DOI · Paper page
  20. Zhang, 2014, Amyloid precursor protein regulates neurogenesis by antagonizing miR-574-5p in the developing cerebral cortex., Nat. Commun., 5, 10.1038/ncomms4330 · DOI
  21. Zhao, 2006, Cyclic AMP stimulates MEG3 gene expression in cells through a cAMP-response element (CRE) in the MEG3 proximal promoter region., Int. J. Biochem. Cell Biol., 38, 1808, 10.1016/j.biocel.2006.05.004 · DOI
  22. Zhao, 2004, Rapid induction of cAMP/PKA pathway during retinoic acid-induced acute promyelocytic leukemia cell differentiation., Leukemia, 18, 285, 10.1038/sj.leu.2403226 · DOI
  23. Zhu, 2019, CREB-upregulated lncRNA MEG3 promotes hepatic gluconeogenesis by regulating miR-302a-3p-CRTC2 axis., J. Cell. Biochem., 120, 4192, 10.1002/jcb.27706 · DOI

Cited by

Sorted by citations

See all 25

Metadata

Authors
Gao, Y., Zhang, R., Wei, G., Dai, S., Zhang, X., Yang, W., Li, X., & Bai, C.
Venue
Frontiers in Cell and Developmental Biology
Published
2019-12-23
Volume
7
ISSN
2296-634X
Cited by
25
References
0

About these checks

Registry, retraction, Cites and statistics results are computed, not judged, with one exception: a printed reference that no index lists is read once by a model before it counts as a citation error. Claims are extracted by a model and kept only when their quote appears verbatim in the text; each cited source is then checked, with a model’s help, for whether it says what the claim relies on. Those verdicts can be wrong — read the claim’s quote and the cited source before relying on one.

Statistics and arithmetic are recomputed, not judged.

Confidence bands are shown only for fields calibrated on our annotated test set. None is calibrated yet, so no band is shown.

What counts as a claim ›How we measure confidence ›How we check this ›

Are you an author, or do you see a problem with this page? Request a review

How to cite

Cite CoChat for the checks on this page, and the paper for its own findings.

This page
CoChat. (2026). Citation check: Long Non-coding RNA Maternally Expressed 3 Increases the Expression of Neuron-Specific Genes by Targeting miR-128-3p in All-Trans Retinoic Acid-Induced Neurogenic Differentiation From Amniotic Epithelial Cells. https://app.cochat.ai/papers/10.3389/fcell.2019.00342
The paper
Gao, Y., Zhang, R., Wei, G., Dai, S., Zhang, X., Yang, W., Li, X., & Bai, C. (2019). Long Non-coding RNA Maternally Expressed 3 Increases the Expression of Neuron-Specific Genes by Targeting miR-128-3p in All-Trans Retinoic Acid-Induced Neurogenic Differentiation From Amniotic Epithelial Cells. Frontiers in Cell and Developmental Biology. https://doi.org/10.3389/fcell.2019.00342