

The DOI matches its Crossref record; 52 of the 52 references it cites were found in a registry or an index.
Vaginal Dysbiotic Microbiome in Women With No Symptoms of Genital Infections
Open accessAbstract
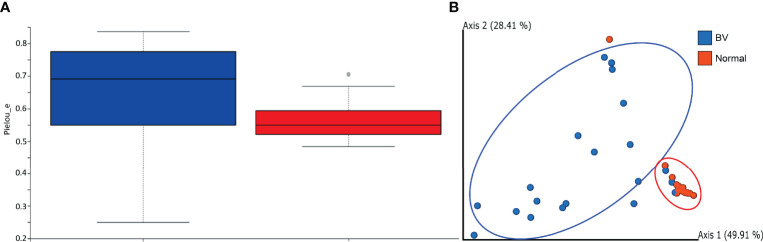
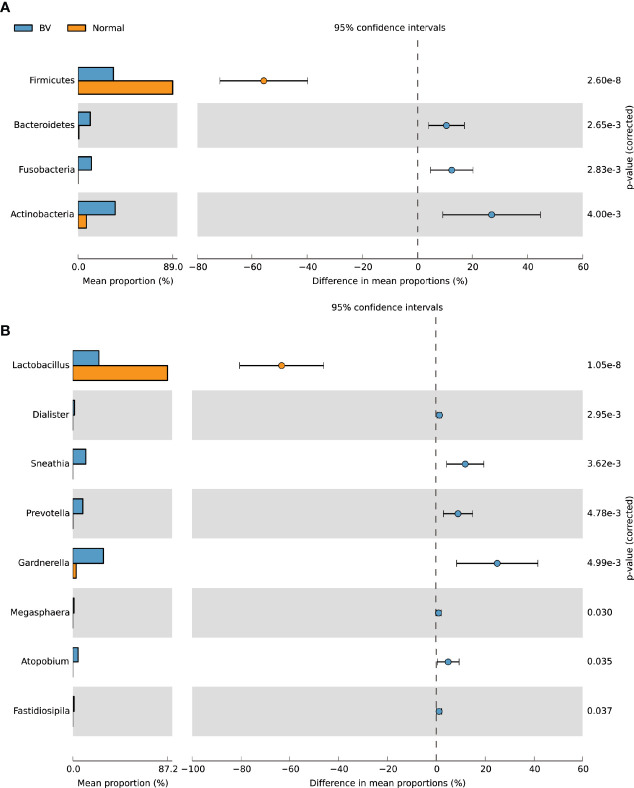
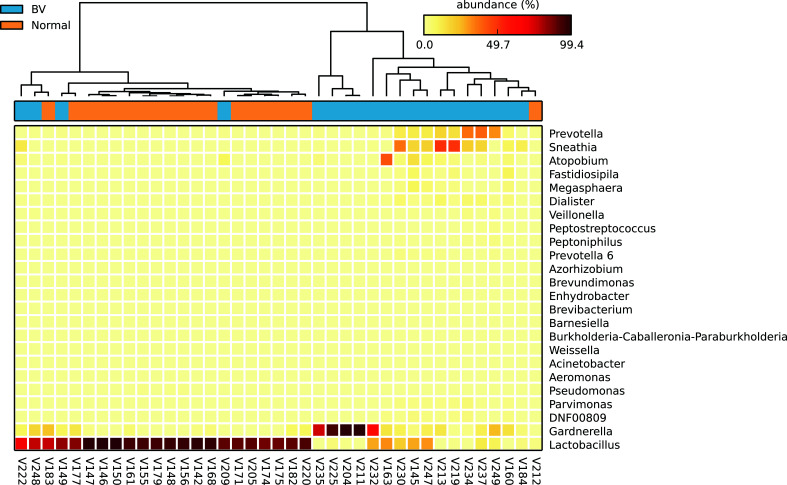
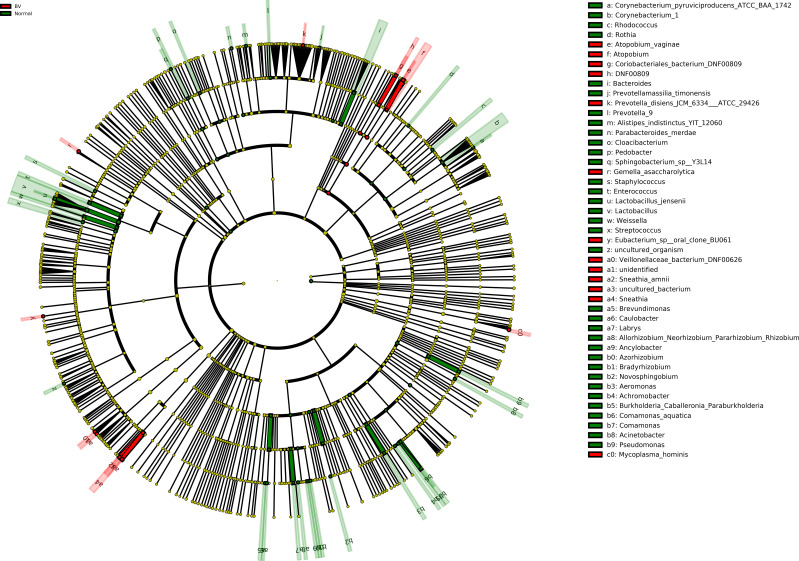
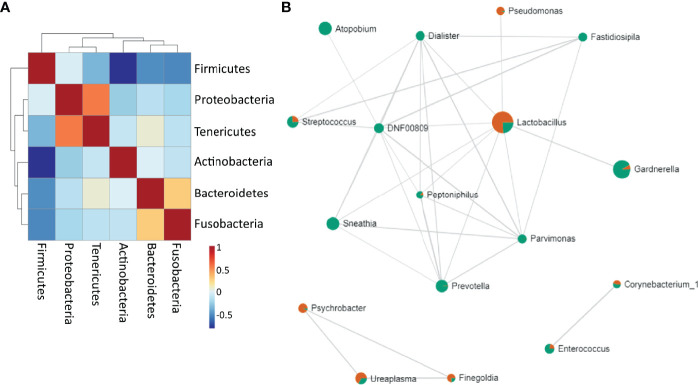
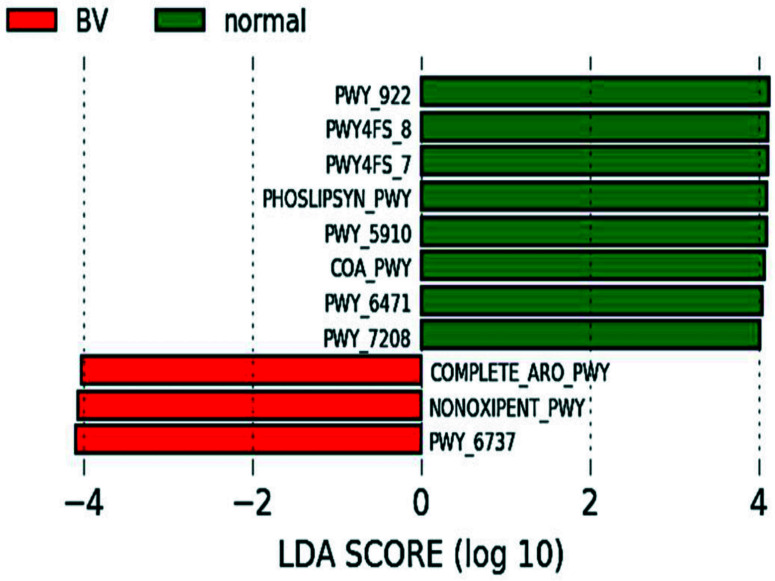
The vaginal microbiome plays a critical role in determining the progression of female genital tract infections; however, little is known about the vaginal microbiota of Indian women. We aimed to investigate the vaginal microbial architecture of women with asymptomatic bacterial vaginosis (BV) (n=20) and normal microbiota (n=19). Microbial diversity was analyzed in vaginal swabs from regularly menstruating women (18-45yrs) by 16S rRNA V3-V4 amplicon (MiSeq Illumina) sequencing. Rarefaction analysis showed a higher number of species in normal flora compared to BV. Alpha diversity as measured by Pielou’s evenness revealed microbial diversity was significantly greater in BV samples than normal microbiota (p= 0.0165). Beta diversity comparison using UniFrac metrics indicated distinct microbial communities clustering between normal and BV flora. Firmicutes were the major phyla observed in vaginal specimens of normal microbiota whereas Actinobacteria, Fusobacteria, Bacteroidetes were significantly abundant in BV samples. Notably, the relative abundance of Lactobacillus was significantly high in normal microbiota. Conversely Gardnerella , Sneathia , Prevotella , Atopobium , Ureaplasma , Dialister significantly dominated dysbiotic microbiota. Relative frequency of Lactobacillus decreased significantly in BV (6%) as compared to normal microbiota (35.2%). L. fermentum, L. gasseri, L. iners, L. jensenii, L. mucosae, L. ruminis, L. salivarius , L. coleohominis was more exclusively present in normal microbiota. L. iners was detected from both the groups with a relative frequency of 50.4% and 17.2% in normal and BV microbiota respectively. Lefse analysis indicated Atopobium vaginae, Sneathia amnii, Mycoplasma hominis Prevotella disiens in the vaginal microbiota as a biomarker for dysbiosis and L. jensenii as a biomarker of a healthy microbiota . Firmicutes were negatively correlated to Tenericutes, Actinobacteria, Bacteroidetes , and Fusobacteria . Proteobacteria positively correlated to Tenericute s, and Bacteroidetes were shown to be positively correlated to Fusobacteria. Predicted functional analysis indicated differences in the functional profiles between BV and normal microbiota. Normal microbiota utilized pathways essential for phosphatidylglycerol biosynthesis I & II, peptidoglycan biosynthesis, geranylgeranyl diphosphate biosynthesis I, mevalonate pathway, CoA biosynthesis pathway I and pyrimidine nucleotide salvage; whereas BV bacteria had characteristic aromatic amino acid biosynthesis, pentose phosphate pathway, carbohydrate degradation. In conclusion, women with asymptomatic BV have vaginal microbiota significantly different than women with normal microbiota. Furthermore, the study provides insights into the vaginal microbial structure of Indian women that will enable us to explore the prospective candidates for restoring the vaginal microbiota.
Overview
The claims and statistics of this paper haven’t been checked yet.
Run the check — free, no account needed. It reads the open-access text and checks the sources it cites.
Integrity signals
Registry
Cites
Statistics
Figures
Verification
Claims the paper makes
The claims and statistics of this paper haven’t been checked yet.
Run the check — free, no account needed. It reads the open-access text and checks the sources it cites.
Claims other papers make about this one
Each is checked against this paper’s own text: does it say what the citing paper says it does?
The source backs part of the claim, not all of it — or backs it for a different population, condition or comparison.
In the citing paper
“a dysbiotic vaginal microbiome (VMB), characterized by increased microbial diversity and a reduction in Lactobacillus spp. has been associated with vaginal inflammation, an increased incidence of sexually transmitted infections (STI) and clinical conditions such as bacterial vaginosis (BV) [4, 6–8].”
From Feasibility, safety and tolerability of estrogen and/or probiotics for improving vaginal health in Canadian African, Caribbean, and Black women: A pilot phase 1 clinical trial (2025) · cites this paper as [6]
Experimental — accuracy not yet measured
Self-check
Percentages, sums and reported differences re-computed from the paper’s own numbers.
The self-check needs the paper’s full text.
Citations
Cites
Reproducible, interactive, scalable and extensible microbiome data science using QIIME 2
Bolyen, E., Rideout, J. R., Dillon, M. R., Bokulich, N. A., Abnet, C. C., Al-Ghalith, G. A., Alexander, H., Alm, E. J., Arumugam, M., Asnicar, F., et al. (2019) · Nature Biotechnology · doi:10.1038/s41587-019-0209-9 · Cited by 23,742
Metagenomic biomarker discovery and explanation
Segata, N., Izard, J., Waldron, L., Gevers, D., Miropolsky, L., Garrett, W. S., & Huttenhower, C. (2011) · Genome Biology · doi:10.1186/gb-2011-12-6-r60 · Cited by 16,192
PICRUSt2 for prediction of metagenome functions
Douglas, G. M., Maffei, V. J., Zaneveld, J. R., Yurgel, S. N., Brown, J. R., Taylor, C. M., Huttenhower, C., & Langille, M. G. I. (2020) · Nature Biotechnology · doi:10.1038/s41587-020-0548-6 · Cited by 6,709
Vaginal microbiome of reproductive-age women
Ravel, J., Gajer, P., Abdo, Z., Schneider, G. M., Koenig, S. S. K., McCulle, S. L., Karlebach, S., Gorle, R., Russell, J., Tacket, C. O., et al. (2011) · Proceedings of the National Academy of Sciences · doi:10.1073/pnas.1002611107 · Cited by 4,254
STAMP: statistical analysis of taxonomic and functional profiles
Parks, D. H., Tyson, G. W., Hugenholtz, P., & Beiko, R. G. (2014) · Bioinformatics · doi:10.1093/bioinformatics/btu494 · Cited by 4,246
Nugent, R. P., Krohn, M. A., & Hillier, S. L. (1991) · Journal of Clinical Microbiology · doi:10.1128/jcm.29.2.297-301.1991 · Cited by 3,332
Amsel, R., Totten, P. A., Spiegel, C. A., Chen, K. C. S., Eschenbach, D. A., & Holmes, K. K. (1983) · The American Journal of Medicine · doi:10.1016/0002-9343(83)91112-9 · Cited by 2,412
Dhariwal, A., Chong, J., Habib, S. M., King, I. L., Agellon, L. B., & Xia, J. (2017) · Nucleic Acids Research · doi:10.1093/nar/gkx295 · Cited by 1,946
Chen, C., Song, X., Wei, W., Zhong, H., Dai, J., Lan, Z., Li, F., Yu, X., Feng, Q., Wang, Z., et al. (2017) · Nature Communications · doi:10.1038/s41467-017-00901-0 · Cited by 1,010
Romero, R., Hassan, S. S., Gajer, P., Tarca, A. L., Fadrosh, D. W., Nikita, L., Galuppi, M., Lamont, R. F., Chaemsaithong, P., Miranda, J., et al. (2014) · Microbiome · doi:10.1186/2049-2618-2-4 · Cited by 852
Cited by
Sorted by citations
Vaginal microbiota are associated with in vitro fertilization during female infertility
Wang, T., Li, P., Bai, X., Tian, S., Yang, M., Leng, D., Kui, H., Zhang, S., Yan, X., Qu, Z., et al. (2024) · iMeta · doi:10.1002/imt2.185 · Cited by 55
Wang, Y., Zhang, Z., Du, M., Ji, X., Liu, X., Zhao, C., Pang, X., Jin, E., Wen, A., Li, S., et al. (2024) · Frontiers in Immunology · doi:10.3389/fimmu.2024.1460127 · Cited by 41
Norenhag, J., Edfeldt, G., Stålberg, K., García, F. R., Hugerth, L. W., Engstrand, L. G., Fransson, E., Du, J., Schuppe‐Koistinen, I., & Olovsson, M. (2024) · Scientific Reports · doi:10.1038/s41598-024-61942-2 · Cited by 38
Du, M., Liu, X., Ji, X., Wang, Y., Liu, X., Zhao, C., Jin, E., Gu, Y., Wang, H., & Zhang, F. (2025) · Frontiers in Nutrition · doi:10.3389/fnut.2024.1494348 · Cited by 34
Shabayek, S., Abdellah, A. M., Salah, M., Ramadan, M., & Fahmy, N. (2022) · BMC Microbiology · doi:10.1186/s12866-022-02730-8 · Cited by 34
Lactobacilli metabolites restore E-cadherin and suppress MMP9 in cervical cancer cells
Pawar, K., & Aranha, C. C. (2022) · Current Research in Toxicology · doi:10.1016/j.crtox.2022.100088 · Cited by 32
Self-citationLópez-Filloy, M., Cortez, F. J., Gheit, T., y Cruz, O. C., Cruz-Talonia, F., Chávez-Torres, M., Arteaga-Gómez, C., Mancilla‐Herrera, I., Montesinos, J. J., Cortés-Morales, V. A., et al. (2022) · Frontiers in Cellular and Infection Microbiology · doi:10.3389/fcimb.2022.884272 · Cited by 31
The microbiome in recurrent pregnancy loss – A scoping review
Vomstein, K., Krog, M. C., Wrønding, T., & Nielsen, H. S. (2024) · Journal of Reproductive Immunology · doi:10.1016/j.jri.2024.104251 · Cited by 27
Beyond the Hayflick limit: How microbes influence cellular aging
Abavisani, M., Faraji, S., Ebadpour, N., Karav, S., & Sahebkar, A. (2025) · Ageing Research Reviews · doi:10.1016/j.arr.2025.102657 · Cited by 24
Zhang, J., Yu, D., Wang, T., Gao, N., Shi, L., Wang, Y., Huo, Y., Ji, Z., Li, J., Zhang, X., et al. (2024) · Microbiology Spectrum · doi:10.1128/spectrum.02480-23 · Cited by 22
Edinburgh postpartum depression scores are associated with vaginal and gut microbiota in pregnancy
Nel, N. H., Marafie, A., Bassis, C. M., Sugino, K. Y., Nzerem, A. C., Knickmeyer, R. R., McKee, K. S., & Comstock, S. S. (2024) · Journal of Affective Disorders · doi:10.1016/j.jad.2024.10.086 · Cited by 17
Integrating microbiome insights into cervical cancer
Bautista, J., Sardi, P. C., Paguay-Caisabanda, I., Gancino-Guevara, K., & López‐Cortés, A. (2026) · Frontiers in Medicine · doi:10.3389/fmed.2026.1766052 · Cited by 13
Horn, E. J., van Hille, R. P., Oyekola, O., & Welz, P. J. (2022) · Microorganisms · doi:10.3390/microorganisms10112305 · Cited by 9
Development of a New Biomarker Model for Predicting Preterm Birth in Cervicovaginal Fluid
Lee, J.-Y., Seo, S., Shin, B., Hong, S. H., Kwon, E., Park, S., Hur, Y. M., Lee, D., Kim, Y. J., & Han, S. B. (2022) · Metabolites · doi:10.3390/metabo12080734 · Cited by 9
Alhamlan, F. S., Al-Badawi, I. A., Al-Qahtani, A. A., Awartani, K. A., Obeid, D. A., & Tulbah, A. M. (2024) · Frontiers in Microbiology · doi:10.3389/fmicb.2024.1489942 · Cited by 8
Characterization of vaginal microbiomes in clinician-collected bacterial vaginosis diagnosed samples
Brochu, H. N., Zhang, Q., Song, K., Wang, L., Deare, E. A., Williams, J., Icenhour, C. R., & Iyer, L. K. (2025) · Microbiology Spectrum · doi:10.1128/spectrum.02582-24 · Cited by 8
Hallmarks of Bacterial Vaginosis
Pérez-Ibave, D. C., Burciaga-Flores, C. H., García-Mejía, X., Alcorta-Núñez, F., Solís‐Coronado, O., González-Escamilla, M., Vidal-Gutiérrez, Ó., & Garza-Rodríguez, M. L. (2025) · Diagnostics · doi:10.3390/diagnostics15091090 · Cited by 8
Gill, B., Schwecht, I., Rahman, N., Dhawan, T., Verschoor, C. P., Nazli, A., & Kaushic, C. (2023) · American Journal of Reproductive Immunology · doi:10.1111/aji.13781 · Cited by 8
Zhang, J., Yu, D., Zhang, L., Wang, T., & Yan, J. (2024) · Forensic Science International Genetics · doi:10.1016/j.fsigen.2024.103170 · Cited by 8
Tang, Y., Wang, X., Huang, J., Jiang, Y., & Yu, F. (2024) · Frontiers in Cellular and Infection Microbiology · doi:10.3389/fcimb.2024.1471027 · Cited by 8
Mapping the vaginal microbiota variations in women from a community clinic in Mumbai, India
Tandon, D., Shah, N., Goriwale, M., Karandikar, K., Begum, S., Patil, A. D., Munne, K., Kamat, S., Aranha, C. C., & Bhor, V. M. (2023) · Indian Journal of Medical Microbiology · doi:10.1016/j.ijmmb.2023.100393 · Cited by 7
Self-citationBacterial vaginosis: advancing insights into microbial dysbiosis
Liu, D., Zhang, X., Zhao, X., Che, X., Song, W., & Wu, G. (2025) · Critical Reviews in Microbiology · doi:10.1080/1040841x.2025.2537923 · Cited by 6
Gill, B., Wessels, J. M., Hayes, C. L., Ratcliffe, J., Wokuri, J., Ball, E., Reid, G., Kaul, R., Rana, J., Alkhaifi, M., et al. (2025) · PLoS ONE · doi:10.1371/journal.pone.0315576 · Cited by 5
Exploring the female genital tract mycobiome in young South African women using metaproteomics
Gangiah, T. K., Alisoltani, A., Potgieter, M. G., Bell, L., Ross, E. J., Iranzadeh, A., McDonald, Z., Allali, I., Dabee, S., Barnabas, S. L., et al. (2025) · Microbiome · doi:10.1186/s40168-025-02066-1 · Cited by 5
Gautam, N. J., Jimenez, N. R., Łaniewski, P., Cui, H., Roe, D. J., Chase, D. M., & Herbst‐Kralovetz, M. M. (2025) · Quality of Life Research · doi:10.1007/s11136-025-04031-9 · Cited by 4
Preechasuth, K., Brazier, L., Khamduang, W., Hongjaisee, S., Wangsaeng, N., & Ngo‐Giang‐Huong, N. (2024) · Microorganisms · doi:10.3390/microorganisms12071298 · Cited by 2
Vaginal Microbiota Patterns Associated with Yeast Infection in Mexican Women, a Pilot Study
Pineda-Díaz, J., Miranda-Brito, C., Juárez-Castelán, C. J., Piña-Escobedo, A., Lázaro-Pérez, N. D. S., de la Cruz-Munguía, A., Ramírez-Sánchez, D., Gómez-Meraz, Y., Vélez-Ixta, J. M., & Garcı́a-Mena, J. (2025) · BioTech · doi:10.3390/biotech14020031 · Cited by 2
Das, S. K., & Konwar, B. K. (2025) · Probiotics and Antimicrobial Proteins · doi:10.1007/s12602-025-10574-7 · Cited by 2
Goswami, A., Ghosh, S., Bandyopadhyay, A., Saha, R. G., Sengupta, P., Bhuniya, U., & Mandal, P. (2024) · Indian Journal of Microbiology · doi:10.1007/s12088-024-01320-8 · Cited by 2
Association of Pregnancy and HIV Status With Molecular-Bacterial Vaginosis in Indian Women
Tuddenham, S., Shafiq, M., Mathad, J. S., Alexander, M., Naik, S., Kulkarni, V., Deshpande, P., Humphrys, M. S., Holm, J. B., Khan, N., et al. (2023) · JAIDS Journal of Acquired Immune Deficiency Syndromes · doi:10.1097/qai.0000000000003215 · Cited by 2
Shende, S., Das, R., Joshi, S., Yanamandra, S., Taji, N., & Karyakarte, R. P. (2025) · Cureus · doi:10.7759/cureus.89872 · Cited by 1
Han, R., Gao, C., Yan, P., Tian, Y., Yu, Y., Li, H., Li, S., & Wang, Y. (2025) · Journal of Clinical Biochemistry and Nutrition · doi:10.3164/jcbn.25-99 · Cited by 1
Sun, T., Zheng, Q., Huang, R., Yang, L., Liu, Z., Zhang, Z., Liu, X., Yang, H., Li, X., Tong, J., et al. (2025) · mSystems · doi:10.1128/msystems.00023-25 · Cited by 1
Saini, G., Yadav, R., Bagga, R., Arora, A., & Sethi, S. K. (2026) · Scientific Reports · doi:10.1038/s41598-026-40140-2 · Cited by 1
The implications and mechanisms of vaginal microbiota metabolites on cervical cancer progression
Wang, W., & Yu, T. (2026) · Frontiers in Cellular and Infection Microbiology · doi:10.3389/fcimb.2026.1886165 · Cited by 1
The Influence of Vaginal Microbiome and Clinical Factors on HPV Clearance: A Prospective StudyPreprint
Yang, Z., Wu, H., Wang, X., Tong, G., Huang, Z., Wang, J., Jiang, Y., Cao, M., Wang, Y., Deng, X., et al. (2022) · medRxiv · doi:10.1101/2022.11.20.22281206 · Cited by 1
Identification of Bacterial Vaginal Microbiota via Metagenomic Approach
Uçak, S., Sudağıdan, M., Yurt, M. N. Z., Taşbaşi, B. B., Acar, E. E., Tuna, B. G., Doğan, S., & Özalp, V. C. (2022) · Namık Kemal Tıp Dergisi · doi:10.4274/nkmj.galenos.2022.27543
Human papillomavirus affects cervical lesions by regulating the community structure of vaginal floraPreprint
Chen, J., Chen, X., & Ma, J. (2022) · Research Square · doi:10.21203/rs.3.rs-2338565/v1
Sneathia infections and adverse perinatal outcomes – short communication
Varlas, V. N., Dima, V., & Roxana Georgiana, B. O. R. S. (2022) · Romanian Journal of Infectious Diseases · doi:10.37897/rjid.2022.3.1
Imaeda, K., Nogami, Y., Kobayashi, Y., Banno, K., & Aoki, D. (2023) · 日本臨床細胞学会雑誌 · doi:10.5795/jjscc.62.145
Zusammenspiel von Mikrobiom und Immunsystem im Rahmen der Reproduktion
Vomstein, K. (2023) · Gynäkologische Endokrinologie · doi:10.1007/s10304-023-00535-0
ЖЫНЫСТЫҚ ЗОРЛЫҚ-ЗОМБЫЛЫҚ КЕЗІНДЕ ЖЫНЫС МҮШЕЛЕРІНІҢ МИКРОБИОМАСЫН СОТ-МЕДИЦИНАЛЫҚ БАҒАЛАУ
Мусабекова, С. А., Мхитарян, К. Э., Абдикадирова, Х. Р., & Мулдашева, Б. С. (2024) · Farmaciâ Kazahstana · doi:10.53511/pharmkaz.2024.65.81.037
Bakhtiyarov, K. R., Игнатко, И. В., Siniakova, E. V., Zueva, A. S., & Дмитриевна, К. Т. (2024) · Meditsinskiy sovet = Medical Council · doi:10.21518/ms2024-466
Das Mikrobiom in der Reproduktionsmedizin: Bedeutung und therapeutische Ansätze
Vomstein, K., & Kuon, R. (2024) · Die Gynäkologie · doi:10.1007/s00129-024-05320-z
Estradiol-associated shifts in vaginal microbiota: Insights from menopausal and reproductive women
Safira, S. A., Arifuddin, S., Madya, F., Zainuddin, A. A., & Savitri, I. (2025) · IP International Journal of Medical Microbiology and Tropical Diseases · doi:10.18231/j.ijmmtd.12107.1759749938
Wojcicki, J. M., Mwaikono, K. S., Nsereko, E., Santos, N., Ndegwa, L. W., Blose, W., Claassen-Weitz, S., Patel, F., Africa, S. D., & Oyugi, J. O. (2026) · BMC Microbiology · doi:10.1186/s12866-025-04677-y
Vaginal Microbiome and Preterm Birth in Pregnant Women From India
Singh, A., Chhabria, K., Vashist, N., Singh, S., Suneja, G., Khater, S., Rao, A., Arigela, C., Kamani, A., Das, G., et al. (2026) · Journal of obstetrics and gynaecology research · doi:10.1111/jog.70381
ANALYSIS OF BODY MASS INDEX AND VAGINAL MICROBIOTA IN REPRODUCTIVE AGE WOMEN
Rezuanto Pualilin, M. T. (2025) · South Eastern European Journal of Public Health
Metadata
- Authors
- Pramanick, R., Nathani, N., Warke, H., Mayadeo, N., & Aranha, C.
- Affiliations
- ICMR National Institute for Research on Women's Health (IN)
- Gujarat Technological University (IN)
- King Edward Memorial Hospital and Seth G.S. Medical College (IN)
- Corresponding author
- Aranha, Clara
- Venue
- Frontiers in Cellular and Infection Microbiology
- Publisher
- Frontiers Media SA
- Published
- 2022-01-12
- Volume
- 11
- Pages
- 760459-760459
- ISSN
- 2235-2988 (ISSN-L)
- PMC
- PMC8790106
- OpenAlex
- W4210716192
- Cited by
- 47
- References
- 52
- Citations by year
- 2026: 6 · 2025: 13 · 2024: 14 · 2023: 5 · 2022: 9
- FWCI
- 6.41
- Type
- journal article
- Language
- en
- Open access
- gold
- doi.org
- Licence
- Locations
- Frontiers in Cellular and Infection Microbiology (publishedVersion, cc-by)
- PubMed Central (publishedVersion, cc-by)
- PubMed (publishedVersion)
- DOAJ (DOAJ: Directory of Open Access Journals) (submittedVersion, cc-by-sa)
- Funders
- Indian Council of Medical Research
- Topics
- Life Sciences › Immunology and Microbiology › Microbiology › Reproductive tract infections research
- Life Sciences › Biochemistry, Genetics and Molecular Biology › Molecular Biology › Gut microbiota and health
- Health Sciences › Dentistry › Periodontics › Oral microbiology and periodontitis research
- Keywords
- vaginal microbiota, bacterial vaginosis, dysbiosis, Lactobacillus, Lactobacillus jensenii, Lactobacillus iners, Atopobium vaginae, Sneathia amnii, Prevotella disiens, Firmicutes, microbial diversity, biomarkers, Indian women
- MeSH terms
- Female, Humans, Prospective Studies, RNA, Ribosomal, 16S, Vagina, Microbiota, Dysbiosis
About these checks
Registry, retraction, Cites and statistics results are computed, not judged, with one exception: a printed reference that no index lists is read once by a model before it counts as a citation error. Claims are extracted by a model and kept only when their quote appears verbatim in the text; each cited source is then checked, with a model’s help, for whether it says what the claim relies on. Those verdicts can be wrong — read the claim’s quote and the cited source before relying on one.
Statistics and arithmetic are recomputed, not judged.
Confidence bands are shown only for fields calibrated on our annotated test set. None is calibrated yet, so no band is shown.
What counts as a claim ›How we measure confidence ›How we check this ›
Are you an author, or do you see a problem with this page? Request a review
