Cited by 130T-cell and B-cell ImmunologyCancer Immunotherapy and BiomarkersImmunotherapy and Immune Responses

The DOI matches its Crossref record; 70 of the 100 references it cites were found in a registry or an index.

Functional Heterogeneity of CD4+ Tumor-Infiltrating Lymphocytes With a Resident Memory Phenotype in NSCLC

Open access
Oja, Anna E., Piet, Berber, van der Zwan, David, Blaauwgeers, Hans, Mensink, Mark, de Kivit, Sander, Borst, Jannie, Nolte, Martijn A., van Lier, René A. W., Stark, Regina, Hombrink, Pleun·2018·Frontiers in Immunology

Abstract

Resident memory T cells (TRM) inhabit peripheral tissues and are critical for protection against localized infections. Recently, it has become evident that CD103+ TRM are not only important in combating secondary infections, but also for the elimination of tumor cells. In several solid cancers, intratumoral CD103+CD8+ tumor infiltrating lymphocytes (TILs), with TRM properties, are a positive prognostic marker. To better understand the role of TRM in tumors, we performed a detailed characterization of CD8+ and CD4+ TIL phenotype and functional properties in non-small cell lung cancer (NSCLC). Frequencies of CD8+ and CD4+ T cell infiltrates in tumors were comparable, but we observed a sharp contrast in TRM ratios compared to surrounding lung tissue. The majority of both CD4+ and CD8+ TILs expressed CD69 and a subset also expressed CD103, both hallmarks of TRM. While CD103+CD8+ T cells were enriched in tumors, CD103+CD4+ T cell frequencies were decreased compared to surrounding lung tissue. Furthermore, CD103+CD4+ and CD103+CD8+ TILs showed multiple characteristics of TRM, such as elevated expression of CXCR6 and CD49a, and decreased expression of T-bet and Eomes. In line with the immunomodulatory role of the tumor microenvironment, CD8+ and CD4+ TILs expressed high levels of inhibitory receptors 2B4, CTLA-4, and PD-1, with the highest levels found on CD103+ TILs. Strikingly, CD103+CD4+ TILs were the most potent producers of TNF- and IFN-, while other TIL subsets lacked such cytokine production. Whereas CD103+CD4+PD-1low TILs produced the most effector cytokines, CD103+CD4+PD-1++ and CD69+CD4+PD-1++ TILs produced CXCL13. Furthermore, a large proportion of TILs expressed co-stimulatory receptors CD27 and CD28, unlike lung TRM, suggesting a less differentiated phenotype. Agonistic triggering of these receptors improved cytokine production of CD103+CD4+ and CD69+CD8+ TILs. Our findings thus provide a rationale to target CD103+CD4+ TILs and add co-stimulation to current therapies to improve the efficacy of immunotherapies and cancer vaccines.

Overview

The claims and statistics of this paper haven’t been checked yet.

Run the check — free, no account needed. It reads the open-access text and checks the sources it cites.

A few free checks a day · papers already verified open instantly · results are public

Integrity signals

Registry

Crossref · 10.3389/fimmu.2018.02654

Cites

70 of 70 references verified0 citation errors · 0 not checkable

Statistics

Figures

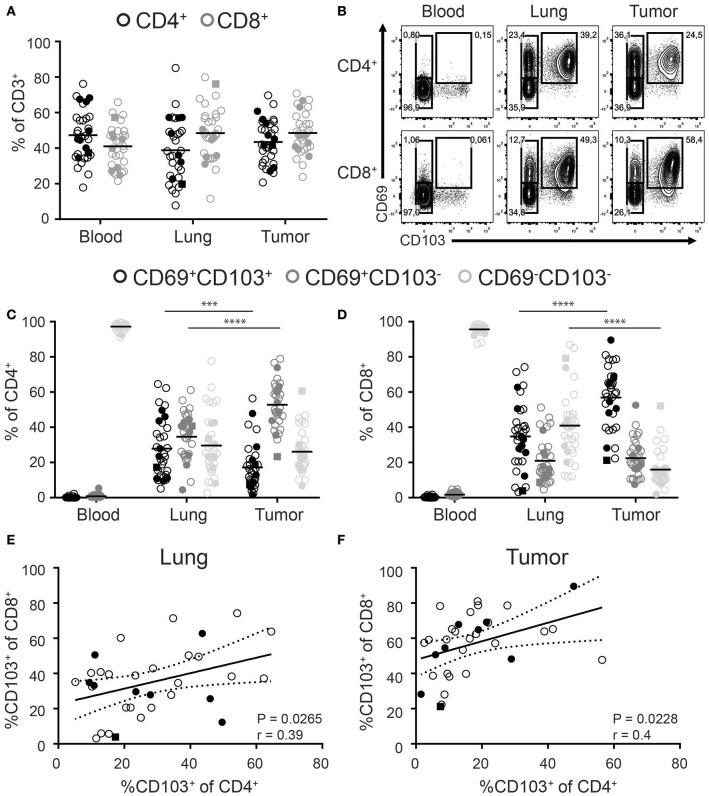
Figure 1 Distribution of CD103 and CD69 expression on CD4+ and CD8+ T cells of paired blood, lung, and tumor samples. (A) Frequencies of CD4+ (black circles) and CD8+ (gray circles) cells of total CD3+ T cells of paired blood, lung, and tumor tissue was analyzed by flow cytometry. (B–D) The expression of CD69 and CD103 was analyzed on paired blood, lung and, tumor CD4+ and CD8+ T cells. (B) Contour plots show representative examples of CD69 and CD103 expression on blood (left panels), lung (middle panels), and tumor (right panels) CD4+ (top panels) and CD8+ (bottom panels) T cells. (C,D) Frequencies of CD103+CD69+ (black circles), CD103−CD69+ (dark gray circles), and CD103−CD69−(light gray circles) cells of total blood, lung, and tumor CD4+ (C) and CD8+ (D) T cells were quantified. (E,F) Correlation between CD103+CD8+ and CD103+CD4+ lung (E) and tumor (F) T cells was determined. (A–F) n = 33. Open circles, solid circles, solid square indicate adeno-, squamous, and large cell carcinoma, respectively. (A,C,D) Quantifications are shown as dot plots with the horizontal line indicating the mean and each point represents a unique sample. (E,F) Correlation shown as X-Y graph where each point represents a unique sample. (C,D) ***p < 0.001, ****p < 0.0001; 2-way analysis of variance (ANOVA) with Tukey's multiple comparisons test. (E,F) r, Pearson's rank coefficient; p < 0.05.
Figure 1 Distribution of CD103 and CD69 expression on CD4+ and CD8+ T cells of paired blood, lung, and tumor samples. (A) Frequencies of CD4+ (black circles) and CD8+ (gray circles) cells of total CD3+ T cells of paired blood, lung, and tumor tissue was analyzed by flow cytometry. (B–D) The expression of CD69 and CD103 was analyzed on paired blood, lung and, tumor CD4+ and CD8+ T cells. (B) Contour plots show representative examples of CD69 and CD103 expression on blood (left panels), lung (middle panels), and tumor (right panels) CD4+ (top panels) and CD8+ (bottom panels) T cells. (C,D) Frequencies of CD103+CD69+ (black circles), CD103−CD69+ (dark gray circles), and CD103−CD69−(light gray circles) cells of total blood, lung, and tumor CD4+ (C) and CD8+ (D) T cells were quantified. (E,F) Correlation between CD103+CD8+ and CD103+CD4+ lung (E) and tumor (F) T cells was determined. (A–F) n = 33. Open circles, solid circles, solid square indicate adeno-, squamous, and large cell carcinoma, respectively. (A,C,D) Quantifications are shown as dot plots with the horizontal line indicating the mean and each point represents a unique sample. (E,F) Correlation shown as X-Y graph where each point represents a unique sample. (C,D) ***p < 0.001, ****p < 0.0001; 2-way analysis of variance (ANOVA) with Tukey's multiple comparisons test. (E,F) r, Pearson's rank coefficient; p < 0.05.CC BY · PubMed Central
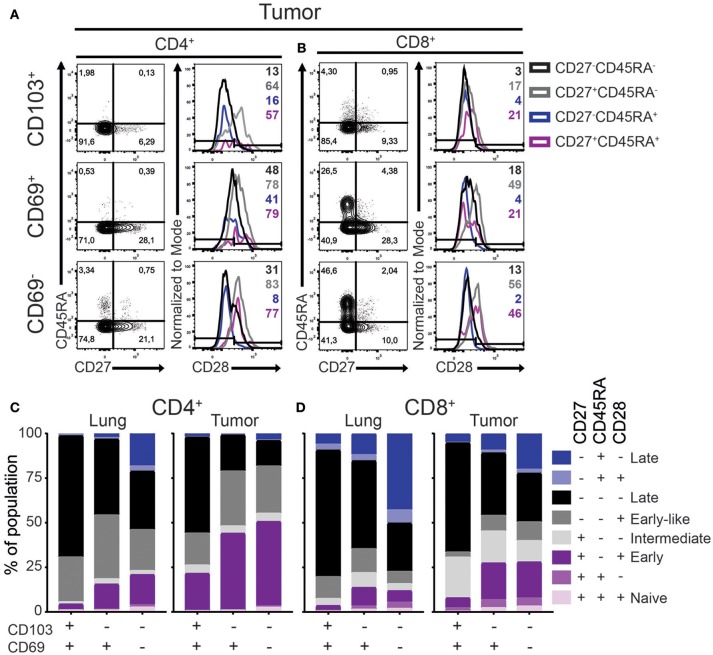
Figure 2 Differentiation status of lung TRM and TILs. (A–D) The expression of CD45RA, CD27, and CD28 on CD4+ and CD8+ lung TRM and TILs was determined. (A,B) The expression of CD27, CD45RA, and CD28 tumor CD103+ (top panels), CD69+ (middle panels), and CD69− (bottom panels) CD4+ (A) and CD8+ (B) T cells shown by representative contour plots (CD45RA on y-axis, CD27 on x-axis) and histograms overlays (maximum set to 100%) show the expression of CD28 on the different subsets (black CD27−CD45RA−, gray CD27+CD45RA−, blue CD27−CD45RA+, purple CD27+CD45RA+). (C,D) The frequencies of CD27+CD45RA+CD28+ (light purple), CD27+CD45RA+CD28− (medium purple), CD27+CD45RA−CD28+ (dark purple), CD27+CD45RA−CD28− (light gray), CD27−CD45RA−CD28+ (medium gray), CD27−CD45RA−CD28− (black), CD27−CD45RA+CD28+ (light blue), CD27−CD45RA+CD28− (dark blue) of CD103+, CD69+, and CD69− lung CD4+ (C; left bar graph), tumor CD4+ (C; right bar graph), lung CD8+ (D; left bar graph), and tumor CD8+ (D; right bar graph). (C,D) The quantifications are shown as bar graphs with the mean. n = 15.
Figure 2 Differentiation status of lung TRM and TILs. (A–D) The expression of CD45RA, CD27, and CD28 on CD4+ and CD8+ lung TRM and TILs was determined. (A,B) The expression of CD27, CD45RA, and CD28 tumor CD103+ (top panels), CD69+ (middle panels), and CD69− (bottom panels) CD4+ (A) and CD8+ (B) T cells shown by representative contour plots (CD45RA on y-axis, CD27 on x-axis) and histograms overlays (maximum set to 100%) show the expression of CD28 on the different subsets (black CD27−CD45RA−, gray CD27+CD45RA−, blue CD27−CD45RA+, purple CD27+CD45RA+). (C,D) The frequencies of CD27+CD45RA+CD28+ (light purple), CD27+CD45RA+CD28− (medium purple), CD27+CD45RA−CD28+ (dark purple), CD27+CD45RA−CD28− (light gray), CD27−CD45RA−CD28+ (medium gray), CD27−CD45RA−CD28− (black), CD27−CD45RA+CD28+ (light blue), CD27−CD45RA+CD28− (dark blue) of CD103+, CD69+, and CD69− lung CD4+ (C; left bar graph), tumor CD4+ (C; right bar graph), lung CD8+ (D; left bar graph), and tumor CD8+ (D; right bar graph). (C,D) The quantifications are shown as bar graphs with the mean. n = 15.CC BY · PubMed Central
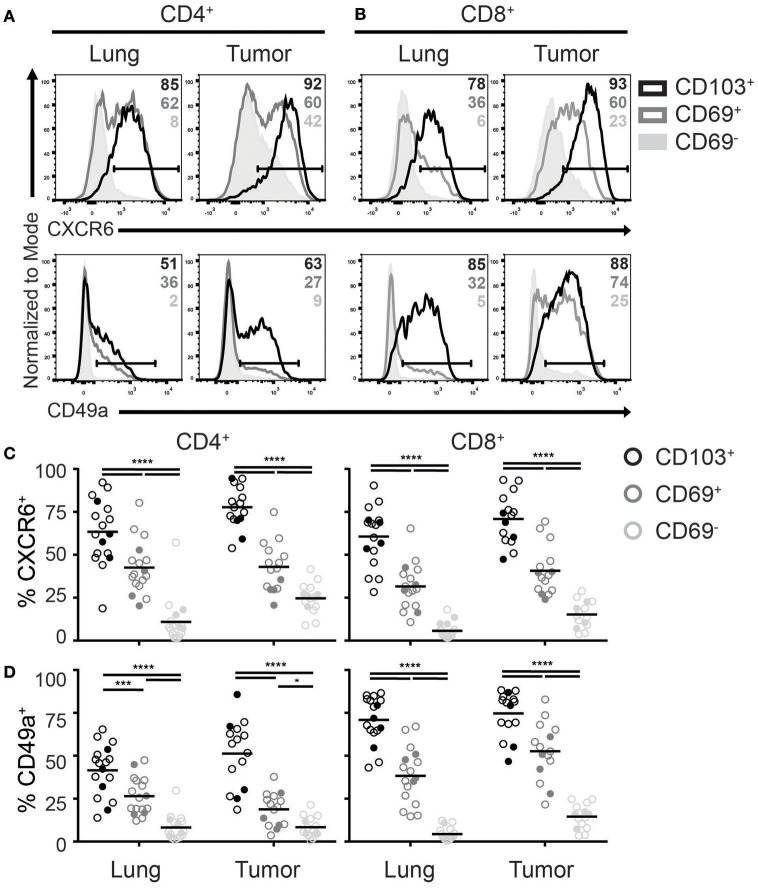
Figure 3 Expression of TRM homing molecules by TILs. (A-D) The expression of chemokine receptor CXCR6 and integrin CD49a were analyzed on CD4+ and CD8+ TRM and TILs. The expression of CXCR6 (top panels) and CD49a (bottom panels) on lung (left panels) and tumor (right panels) CD4+ (A) and CD8+ (B) T cell subsets is shown by representative histogram overlays (maximum set to 100%) (CD103+ black, CD69+ dark gray, CD69− solid light gray). The frequencies of CXCR6+ (C) and CD49a+ (D) CD103+ (black circles), CD69+ (dark gray circles), and CD69− (light gray circles) cells of lung and tumor CD4+ T cells (left graphs) and CD8+ T cells (right graphs). (C,D) The quantifications are shown as dot plots with the horizontal line indicating the mean and each point represents a unique sample. n = 15–17. Open circles and solid circles indicate adeno- and squamous carcinoma, respectively. *p < 0.05, ***p < 0.001, ****p < 0.0001; 2-way ANOVA with Tukey's multiple comparisons test.
Figure 3 Expression of TRM homing molecules by TILs. (A-D) The expression of chemokine receptor CXCR6 and integrin CD49a were analyzed on CD4+ and CD8+ TRM and TILs. The expression of CXCR6 (top panels) and CD49a (bottom panels) on lung (left panels) and tumor (right panels) CD4+ (A) and CD8+ (B) T cell subsets is shown by representative histogram overlays (maximum set to 100%) (CD103+ black, CD69+ dark gray, CD69− solid light gray). The frequencies of CXCR6+ (C) and CD49a+ (D) CD103+ (black circles), CD69+ (dark gray circles), and CD69− (light gray circles) cells of lung and tumor CD4+ T cells (left graphs) and CD8+ T cells (right graphs). (C,D) The quantifications are shown as dot plots with the horizontal line indicating the mean and each point represents a unique sample. n = 15–17. Open circles and solid circles indicate adeno- and squamous carcinoma, respectively. *p < 0.05, ***p < 0.001, ****p < 0.0001; 2-way ANOVA with Tukey's multiple comparisons test.CC BY · PubMed Central
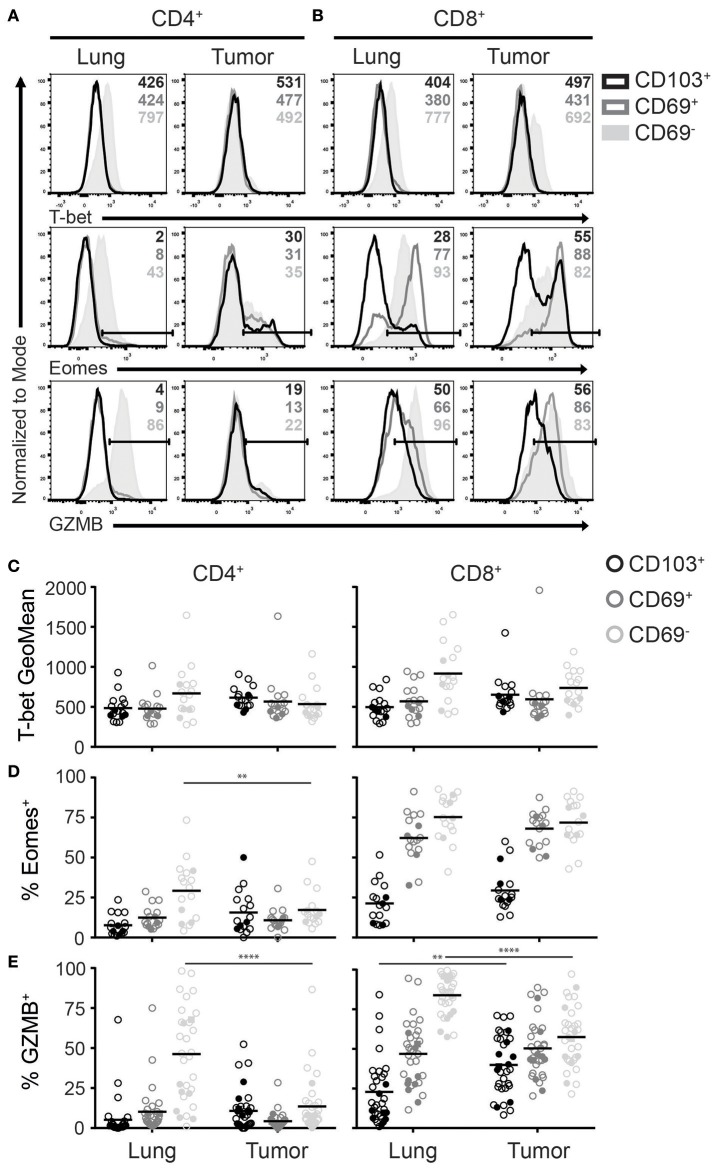
Figure 4 Expression of T-bet, Eomes and GZMB on TRM and TILs. (A–D) The expression of T-bet, Eomes, and GZMB was analyzed on CD4+ and CD8+ TRM and TILs. The expression of T-bet (top panels), Eomes (middle panels), and GZMB (bottom panels) on lung (left panels) and tumor (right panels) CD4+ (A) and CD8+ (B) T cells is shown by representative histogram overlays (maximum set to 100%) (CD103+ black, CD69+ dark gray, CD69− solid light gray). The expression of T-bet (geometric mean fluorescence intensity; GeoMFI) (C) and frequencies of Eomes+ (D) and GZMB+ (E) CD103+ (black circles), CD69+ (dark gray circles), and CD69− (light gray circles) cells of lung and tumor CD4+ (left graphs) and CD8+ (right graphs) T cells. (C–E) The quantifications are shown as dot plots with the horizontal line indicating the mean and each point represents a unique sample. n = 17. Open circles and solid circles indicate adeno- and squamous carcinoma, respectively. **p < 0.01, ****p < 0.0001; 2-way ANOVA with Tukey's multiple comparisons test.
Figure 4 Expression of T-bet, Eomes and GZMB on TRM and TILs. (A–D) The expression of T-bet, Eomes, and GZMB was analyzed on CD4+ and CD8+ TRM and TILs. The expression of T-bet (top panels), Eomes (middle panels), and GZMB (bottom panels) on lung (left panels) and tumor (right panels) CD4+ (A) and CD8+ (B) T cells is shown by representative histogram overlays (maximum set to 100%) (CD103+ black, CD69+ dark gray, CD69− solid light gray). The expression of T-bet (geometric mean fluorescence intensity; GeoMFI) (C) and frequencies of Eomes+ (D) and GZMB+ (E) CD103+ (black circles), CD69+ (dark gray circles), and CD69− (light gray circles) cells of lung and tumor CD4+ (left graphs) and CD8+ (right graphs) T cells. (C–E) The quantifications are shown as dot plots with the horizontal line indicating the mean and each point represents a unique sample. n = 17. Open circles and solid circles indicate adeno- and squamous carcinoma, respectively. **p < 0.01, ****p < 0.0001; 2-way ANOVA with Tukey's multiple comparisons test.CC BY · PubMed Central
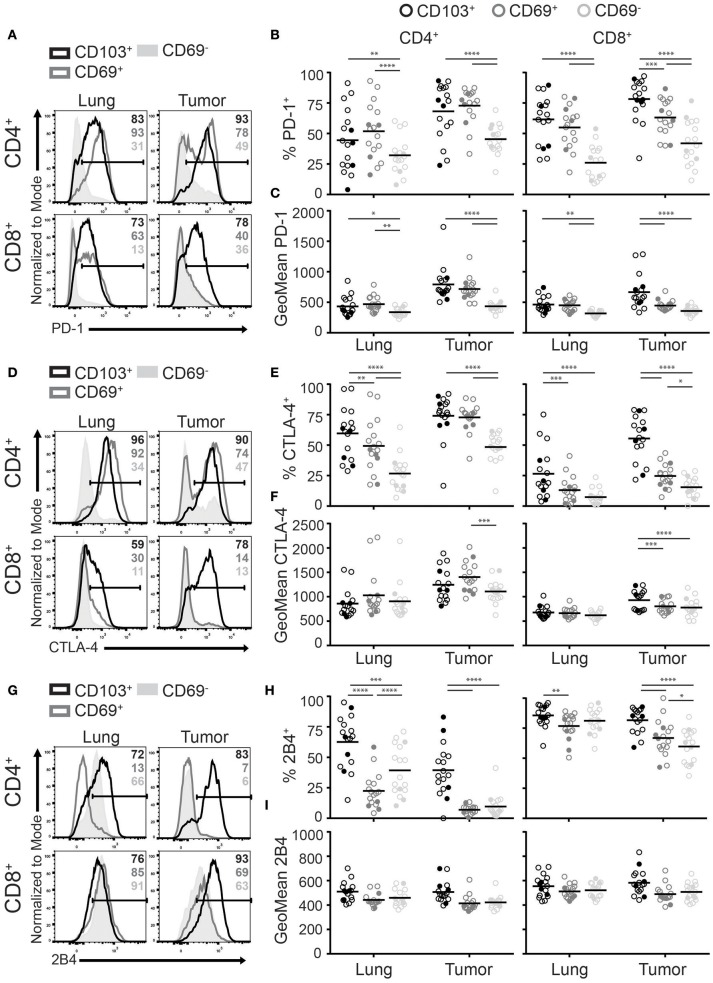
Figure 5 CD103+ TILs express the highest levels of inhibitory receptors. (A–I) The expression of inhibitory receptors PD-1, CTLA-4, and 2B4 was analyzed on CD4+ and CD8+ TRM and TILs. The expression of PD-1 (A), CTLA-4 (D), and 2B4 (G) on lung (left panel) and tumor (right panel) on CD4+ (top panel) and CD8+ (bottom panel) T cells is shown by representative histogram overlays (maximum set to 100%) (CD103+ black, CD69+ dark gray, CD69− solid light gray). The frequencies and geoMFI of PD-1+ (B,C), CTLA-4+ (E,F) and 2B4+ (H,I) were quantified for CD103+ (black circles), CD69+ (dark gray circles), and CD69− (light gray circles) cells of lung and tumor CD4+ (left graphs) and CD8+ (right graphs) T cells. (B,C,E,F,H,I) The quantifications are shown as dot plots with the horizontal line indicating the mean and each point represents a unique sample. n = 17. Open circles and solid circles indicate adeno- and squamous carcinoma, respectively. *p < 0.05, **p < 0.01, ***p < 0.001, ****p < 0.0001; 2-way ANOVA with Tukey's multiple comparisons test.
Figure 5 CD103+ TILs express the highest levels of inhibitory receptors. (A–I) The expression of inhibitory receptors PD-1, CTLA-4, and 2B4 was analyzed on CD4+ and CD8+ TRM and TILs. The expression of PD-1 (A), CTLA-4 (D), and 2B4 (G) on lung (left panel) and tumor (right panel) on CD4+ (top panel) and CD8+ (bottom panel) T cells is shown by representative histogram overlays (maximum set to 100%) (CD103+ black, CD69+ dark gray, CD69− solid light gray). The frequencies and geoMFI of PD-1+ (B,C), CTLA-4+ (E,F) and 2B4+ (H,I) were quantified for CD103+ (black circles), CD69+ (dark gray circles), and CD69− (light gray circles) cells of lung and tumor CD4+ (left graphs) and CD8+ (right graphs) T cells. (B,C,E,F,H,I) The quantifications are shown as dot plots with the horizontal line indicating the mean and each point represents a unique sample. n = 17. Open circles and solid circles indicate adeno- and squamous carcinoma, respectively. *p < 0.05, **p < 0.01, ***p < 0.001, ****p < 0.0001; 2-way ANOVA with Tukey's multiple comparisons test.CC BY · PubMed Central
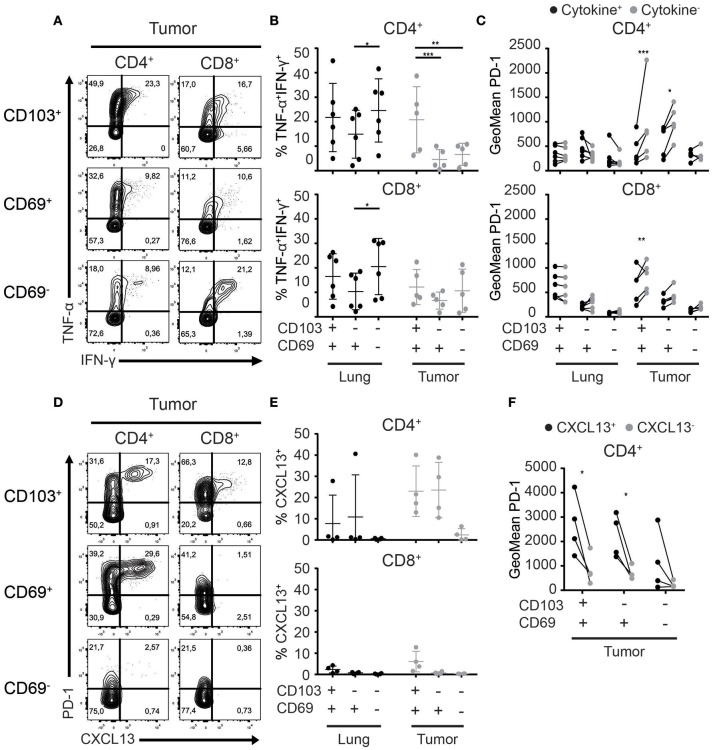
Figure 6 Cytokine and chemokine production of TRM and TILs. (A–C) Cytokine production by lung TRM and TILs was determined after overnight αCD3/αCD28 stimulation. (A) The production of TNF-α and IFN-γ by CD103+ (top panels), CD69+ (middle panels), and CD69− (bottom panels) tumor CD4+ (left panels) and CD8+ (right panels) TILs shown by representative contour plots (TNF-α on y-axis, IFN-γ on x-axis). (B) TNF-α+IFN-γ+ CD103+, CD69+, and CD69− cells of lung and tumor CD4+ (top graph) and CD8+ (bottom graph) T cells. (C) PD-1 expression (geometric mean fluorescence intensity; GeoMFI) was quantified on cytokine+ (TNF-α+ and/or IFN-γ+) (black circles) and cytokine− (TNF-α−IFN-γ−) (gray circles) CD103+, CD69+, and CD69− lung and tumor CD4+ (top graph) and CD8+ (bottom graph) T cells. (D) The expression of CXCL13 was determined by flow cytometry in CD103+ (top panels), CD69+ (middle panels), and CD69− (bottom panels) tumor CD4+ (left panels) and CD8+ (right panels) TILs and is shown by representative contour plots (PD-1 on y-axis, CXCL13 on x-axis). (E) CXCL13+ of CD103+, CD69+, and CD69− cells was quantified in lung and tumor CD4+ (top graph) and CD8+ (bottom graph) T cells. (F) PD-1 expression (GeoMFI) was quantified on the CXCL13+ (black circles) and CXCL13− (gray circles) CD103+, CD69+, and CD69− CD4+ TILs. n = 4–6 paired lung-tumor samples; all adenocarcinoma. *p < 0.05, **p < 0.01, ***p < 0.001; 2-way ANOVA with Tukey's multiple comparisons test.
Figure 6 Cytokine and chemokine production of TRM and TILs. (A–C) Cytokine production by lung TRM and TILs was determined after overnight αCD3/αCD28 stimulation. (A) The production of TNF-α and IFN-γ by CD103+ (top panels), CD69+ (middle panels), and CD69− (bottom panels) tumor CD4+ (left panels) and CD8+ (right panels) TILs shown by representative contour plots (TNF-α on y-axis, IFN-γ on x-axis). (B) TNF-α+IFN-γ+ CD103+, CD69+, and CD69− cells of lung and tumor CD4+ (top graph) and CD8+ (bottom graph) T cells. (C) PD-1 expression (geometric mean fluorescence intensity; GeoMFI) was quantified on cytokine+ (TNF-α+ and/or IFN-γ+) (black circles) and cytokine− (TNF-α−IFN-γ−) (gray circles) CD103+, CD69+, and CD69− lung and tumor CD4+ (top graph) and CD8+ (bottom graph) T cells. (D) The expression of CXCL13 was determined by flow cytometry in CD103+ (top panels), CD69+ (middle panels), and CD69− (bottom panels) tumor CD4+ (left panels) and CD8+ (right panels) TILs and is shown by representative contour plots (PD-1 on y-axis, CXCL13 on x-axis). (E) CXCL13+ of CD103+, CD69+, and CD69− cells was quantified in lung and tumor CD4+ (top graph) and CD8+ (bottom graph) T cells. (F) PD-1 expression (GeoMFI) was quantified on the CXCL13+ (black circles) and CXCL13− (gray circles) CD103+, CD69+, and CD69− CD4+ TILs. n = 4–6 paired lung-tumor samples; all adenocarcinoma. *p < 0.05, **p < 0.01, ***p < 0.001; 2-way ANOVA with Tukey's multiple comparisons test.CC BY · PubMed Central
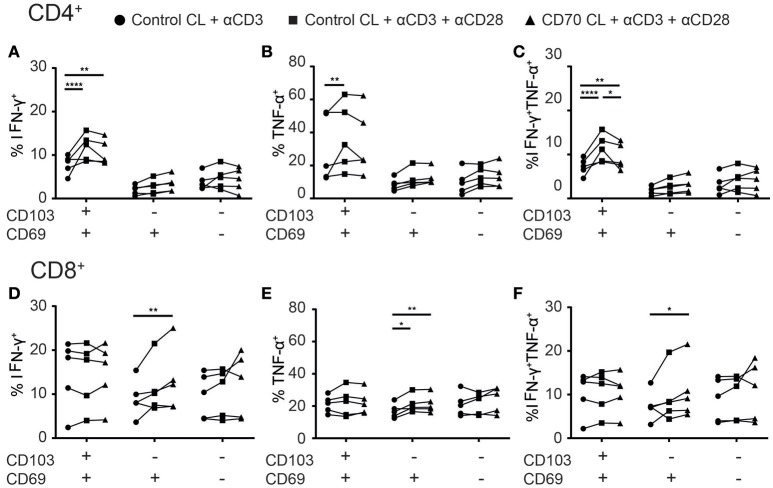
Figure 7 Co-stimulation enhances cytokine production of TILs. (A–F) The effect of co-stimulation on cytokine production of TILs was assessed with overnight stimulation. (A–C) The frequencies of IFN-γ+ (A), TNFα+ (B), or TNF-α+IFN-γ+ (C) CD103+, CD69+, and CD69− CD4+ TILs stimulated with αCD3 with control cell line (CL) (black circles), αCD3 and αCD28 with control CL (black squares), or αCD3 and αCD28 with CD70-expressing CL (black triangles) was quantified. (D–F) The frequencies of IFN-γ+ (D), TNFα+ (E), or TNF-α+IFN-γ+ (F) CD103+, CD69+, and CD69− CD8+ TILs stimulated with αCD3 with control CL (black circles), αCD3 and αCD28 with control CL (black squares), or αCD3 and αCD28 with CD70-expressing CL (black triangles) was quantified. n = 5. *p < 0.05, **p < 0.01, ****p < 0.0001; 2-way ANOVA with Tukey's multiple comparisons test.
Figure 7 Co-stimulation enhances cytokine production of TILs. (A–F) The effect of co-stimulation on cytokine production of TILs was assessed with overnight stimulation. (A–C) The frequencies of IFN-γ+ (A), TNFα+ (B), or TNF-α+IFN-γ+ (C) CD103+, CD69+, and CD69− CD4+ TILs stimulated with αCD3 with control cell line (CL) (black circles), αCD3 and αCD28 with control CL (black squares), or αCD3 and αCD28 with CD70-expressing CL (black triangles) was quantified. (D–F) The frequencies of IFN-γ+ (D), TNFα+ (E), or TNF-α+IFN-γ+ (F) CD103+, CD69+, and CD69− CD8+ TILs stimulated with αCD3 with control CL (black circles), αCD3 and αCD28 with control CL (black squares), or αCD3 and αCD28 with CD70-expressing CL (black triangles) was quantified. n = 5. *p < 0.05, **p < 0.01, ****p < 0.0001; 2-way ANOVA with Tukey's multiple comparisons test.CC BY · PubMed Central

Verification

Claims the paper makes

The claims and statistics of this paper haven’t been checked yet.

Run the check — free, no account needed. It reads the open-access text and checks the sources it cites.

A few free checks a day · papers already verified open instantly · results are public

Claims other papers make about this one

Each is checked against this paper’s own text: does it say what the citing paper says it does?

Self-check

Percentages, sums and reported differences re-computed from the paper’s own numbers.

The self-check needs the paper’s full text.

Citations

Cites

Show all 100 references

Research works printed but not linked: 1

  1. Arnon, 2015, GRK2-dependent S1PR1 desensitization, 1898

Cited by

Sorted by citations

See all 130

Metadata

Authors
Oja, A. E., Piet, B., van der Zwan, D., Blaauwgeers, H., Mensink, M., de Kivit, S., Borst, J., Nolte, M. A., van Lier, R. A. W., Stark, R., & Hombrink, P.
Affiliations
  • Sanquin (NL)
  • OLVG (NL)
  • The Netherlands Cancer Institute (NL)
Corresponding author
  • Oja, Anna E.
  • Hombrink, Pleun
Venue
Frontiers in Immunology
Published
2018-11-16
Volume
9
Pages
2654-2654
ISSN
1664-3224 (ISSN-L)
OpenAlex
W2901131610
Cited by
130
References
100
Citations by year
2026: 12 · 2025: 15 · 2024: 15 · 2023: 13 · 2022: 25 · 2021: 22 · 2020: 23 · 2019: 5
FWCI
5.37
Type
journal article
Language
en
Open access
Locations
  • Frontiers in Immunology (publishedVersion, cc-by)
  • Europe PMC (PubMed Central) (publishedVersion, cc-by)
  • PubMed Central (publishedVersion, cc-by)
  • PubMed (publishedVersion)
  • Data Archiving and Networked Services (DANS) (submittedVersion, other-oa)
  • DOAJ (DOAJ: Directory of Open Access Journals) (submittedVersion, cc-by-sa)
  • Pure Amsterdam UMC (submittedVersion, cc-by)
  • Radboud Repository (Radboud University) (submittedVersion)
  • Radboud Repository (Radboud University) (submittedVersion, other-oa)
Funders
Nederlandse Organisatie voor Wetenschappelijk Onderzoek
Topics
  • Life Sciences › Immunology and Microbiology › Immunology › T-cell and B-cell Immunology
  • Health Sciences › Medicine › Oncology › Cancer Immunotherapy and Biomarkers
  • Life Sciences › Immunology and Microbiology › Immunology › Immunotherapy and Immune Responses
Keywords
tissue-resident memory T cells, CD4+ T cells, CD8+ T cells, tumor-infiltrating lymphocytes, non-small cell lung cancer, CD103, CD69, CXCR6, CD49a, PD-1, CTLA-4, 2B4, inhibitory receptors, T cell differentiation, costimulatory receptors, CXCL13, TNF-α, interferon-gamma, tumor microenvironment, T cell heterogeneity, adoptive T cell therapy
MeSH terms
Receptors, CXCR6, Aged, Carcinoma, Non-Small-Cell Lung, Female, Humans, Immunologic Memory, Lung, Lung Neoplasms, Male, Middle Aged, Phenotype, Prognosis, CD4-Positive T-Lymphocytes, Antigens, CD, Cytokines, Lymphocytes, Tumor-Infiltrating, CD8-Positive T-Lymphocytes, Integrin alpha Chains, Integrin alpha1, Granzymes, Tumor Microenvironment, Programmed Cell Death 1 Receptor

About these checks

Registry, retraction, Cites and statistics results are computed, not judged, with one exception: a printed reference that no index lists is read once by a model before it counts as a citation error. Claims are extracted by a model and kept only when their quote appears verbatim in the text; each cited source is then checked, with a model’s help, for whether it says what the claim relies on. Those verdicts can be wrong — read the claim’s quote and the cited source before relying on one.

Statistics and arithmetic are recomputed, not judged.

Confidence bands are shown only for fields calibrated on our annotated test set. None is calibrated yet, so no band is shown.

What counts as a claim ›How we measure confidence ›How we check this ›

Are you an author, or do you see a problem with this page? Request a review