

The DOI matches its Crossref record; 31 of the 31 references it cites were found in a registry or an index.
Robust, scalable and xeno-free protocol for differentiating human induced pluripotent stem cells into functional macrophages
Open accessAbstract
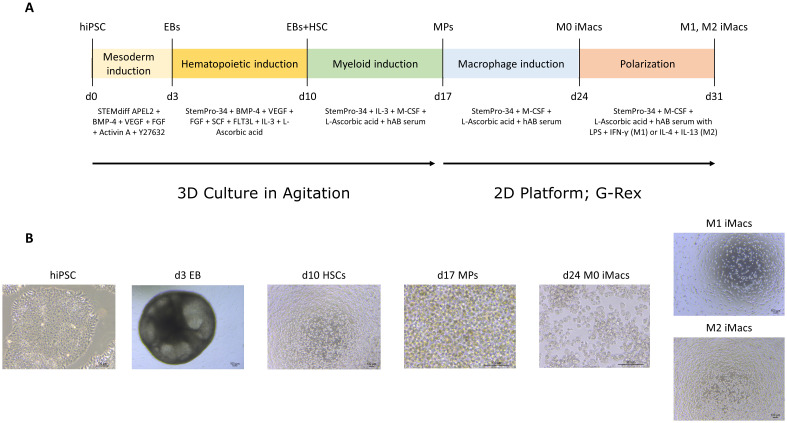
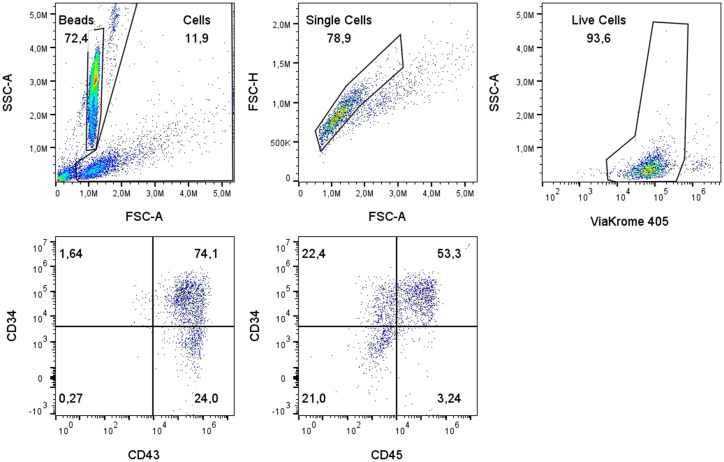
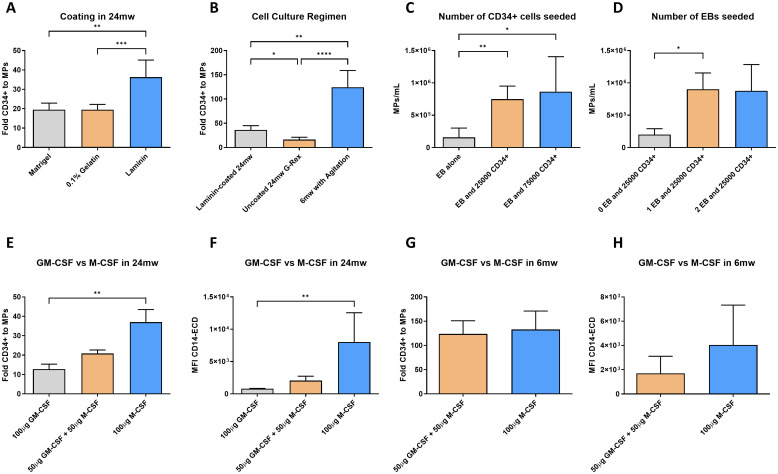
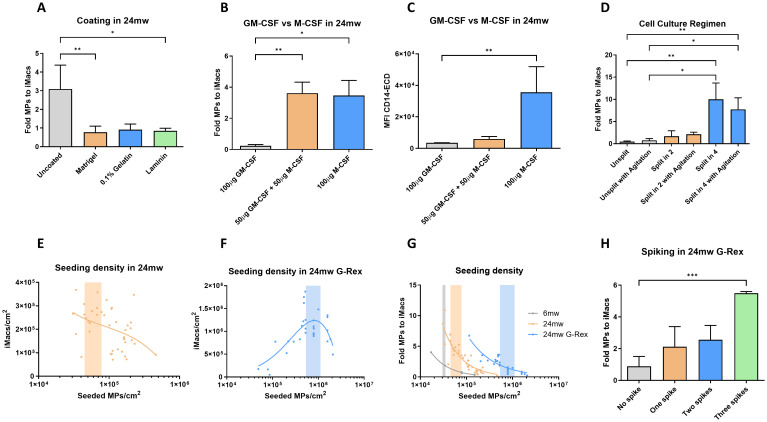
Human induced pluripotent stem cells (hiPSCs)-derived macrophages (iMacs) exhibit key macrophage phenotypic and functional properties, positioning them as promising candidates for allogenic cell immunotherapies. However, an efficient, scalable and good manufacturing practices (GMP)-compatible differentiation protocol is noticeably lacking. To meet this need, we aimed to develop a robust protocol for differentiating clinical-grade hiPSC lines into functional iMacs, designed for scalability and immediate GMP translation. We tested different media compositions, cytokine concentrations, seeding densities, culture regimens (2D vs. 3D) and coatings across key developmental stages. With the optimized protocol, we differentiated three different clinical-grade hiPSC lines towards mesoderm through embryoid body (EB) formation by agitation in 3D. Hematopoietic progenitor-producing EBs were induced to produce myeloid progenitors in agitation for 7 days. Then, myeloid progenitors were harvested and transferred to a G-Rex production platform to differentiate and further polarize into M1 or M2 iMacs. Cellular differentiation was assessed using flow cytometry panels through all developmental stages. At the final differentiated stage, iMacs were functionally characterized using the pHrodo phagocytosis assay. Pro-inflammatory cytokine secretion was analyzed by ELISA, and cell morphology was assessed by May-Grünwald Giemsa staining in Cytospin preparations. The full protocol was performed using feeder-free, scalable and either GMP or GMP- translatable reagents. This protocol enabled the production of iMacs with a mean purity of 98% viable cells, and a mean differentiation fold of 250X from a single hiPSC.
Overview
The claims and statistics of this paper haven’t been checked yet.
Run the check — free, no account needed. It reads the open-access text and checks the sources it cites.
Integrity signals
Registry
Cites
Statistics
Figures
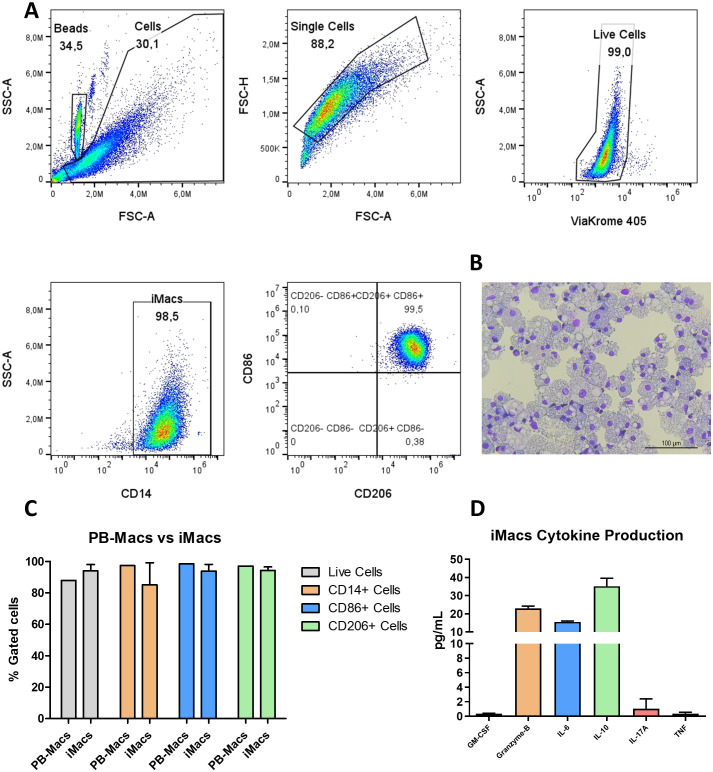
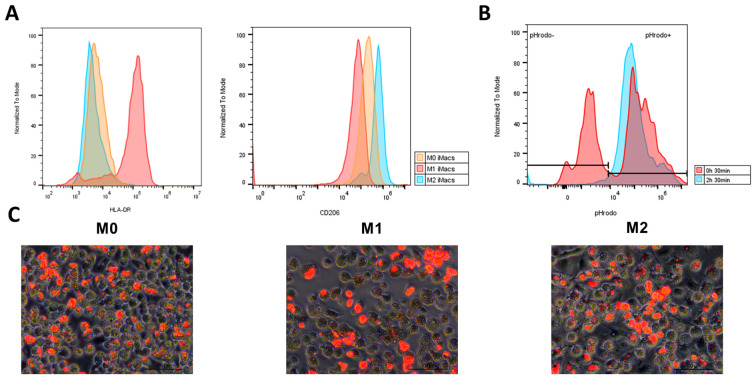
Verification
Claims the paper makes
The claims and statistics of this paper haven’t been checked yet.
Run the check — free, no account needed. It reads the open-access text and checks the sources it cites.
Claims other papers make about this one
Each is checked against this paper’s own text: does it say what the citing paper says it does?
The source backs part of the claim, not all of it — or backs it for a different population, condition or comparison.
In the citing paper
“Importantly, these cells closely match tissue macrophages at both transcriptional and functional levels (184–186).”
From Targeting macrophages in liver fibrosis (2026) · cites this paper as [186]
Experimental — accuracy not yet measured
Self-check
Percentages, sums and reported differences re-computed from the paper’s own numbers.
The self-check needs the paper’s full text.
Citations
Cites
Induction of Pluripotent Stem Cells from Adult Human Fibroblasts by Defined Factors
Takahashi, K., Tanabe, K., Ohnuki, M., Narita, M., Ichisaka, T., Tomoda, K., & Yamanaka, S. (2007) · Cell · doi:10.1016/j.cell.2007.11.019 · Cited by 20,221
CAR race to cancer immunotherapy: from CAR T, CAR NK to CAR macrophage therapy
Pan, K., Farrukh, H., Chittepu, V. C. S. R., Xu, H., Pan, C.-X., & Zhu, Z. G. (2022) · Journal of Experimental & Clinical Cancer Research · doi:10.1186/s13046-022-02327-z · Cited by 685
Physiology and diseases of tissue-resident macrophages
Lazarov, T., Juarez-Carreño, S., Cox, N., & Geissmann, F. (2023) · Nature · doi:10.1038/s41586-023-06002-x · Cited by 571
Macrophage polarization: an important role in inflammatory diseases
Luo, M., Zhao, F., Cheng, H., Su, M., & Wang, Y. (2024) · Frontiers in Immunology · doi:10.3389/fimmu.2024.1352946 · Cited by 531
CAR-T and CAR-NK as cellular cancer immunotherapy for solid tumors
Peng, L., Sferruzza, G., Yang, L., Zhou, L., & Chen, S. (2024) · Cellular and Molecular Immunology · doi:10.1038/s41423-024-01207-0 · Cited by 443
Pluripotent stem cell-derived CAR-macrophage cells with antigen-dependent anti-cancer cell functions
Zhang, L., Tian, L., Dai, X., Yu, H., Wang, J., Lei, A., Zhu, M., Xu, J., Zhao, W., Zhu, Y., et al. (2020) · Journal of Hematology & Oncology · doi:10.1186/s13045-020-00983-2 · Cited by 425
Induced Pluripotent Stem Cells and Their Use in Human Models of Disease and Development
Karagiannis, P., Takahashi, K., Saito, M. K., Yoshida, Y., Okita, K., Watanabe, A., Inoue, H., Yamashita, J. K., Todani, M., Nakagawa, M., et al. (2018) · Physiological Reviews · doi:10.1152/physrev.00039.2017 · Cited by 391
Wilgenburg, B. V., Browne, C., Vowles, J., & Cowley, S. A. (2013) · PLoS ONE · doi:10.1371/journal.pone.0071098 · Cited by 353
A second-generation M1-polarized CAR macrophage with antitumor efficacy
Lei, A., Yu, H., Lu, S., Lu, H., Ding, X., Tan, T., Zhang, H., Zhu, M., Tian, L., Wang, X., et al. (2023) · Nature Immunology · doi:10.1038/s41590-023-01687-8 · Cited by 326
MHC matching improves engraftment of iPSC-derived neurons in non-human primates
Morizane, A., Kikuchi, T., Hayashi, T., Mizuma, H., Takara, S., Doi, H., Mawatari, A., Glasser, M. F., Shiina, T., Ishigaki, H., et al. (2017) · Nature Communications · doi:10.1038/s41467-017-00926-5 · Cited by 244
Lachmann, N., Ackermann, M., Frenzel, E., Liebhaber, S., Brennig, S., Happle, C., Hoffmann, D., Klimenkova, O., Lüttge, D., Buchegger, T., et al. (2015) · Stem Cell Reports · doi:10.1016/j.stemcr.2015.01.005 · Cited by 238
Ackermann, M., Kempf, H., Hetzel, M., Hesse, C., Hashtchin, A. R., Brinkert, K., Schott, J. W., Haake, K., Kühnel, M. P., Glage, S., et al. (2018) · Nature Communications · doi:10.1038/s41467-018-07570-7 · Cited by 165
Sugita, S., Iwasaki, Y., Makabe, K., Kamao, H., Mandai, M., Shiina, T., Ogasawara, K., Hirami, Y., Kurimoto, Y., & Takahashi, M. (2016) · Stem Cell Reports · doi:10.1016/j.stemcr.2016.08.010 · Cited by 156
Cao, X., Yakala, G. K., van den Hil, F. E., Cochrane, A., Mummery, C. L., & Orlova, V. V. (2019) · Stem Cell Reports · doi:10.1016/j.stemcr.2019.05.003 · Cited by 124
Optimizing the production of suspension cells using the G-Rex “M” series
Bajgain, P., Mucharla, R., Wilson, J., Welch, D., Anurathapan, U., Liang, B., Lu, X., Ripple, K., Centanni, J. M., Hall, C., et al. (2014) · Molecular Therapy — Methods & Clinical Development · doi:10.1038/mtm.2014.15 · Cited by 98
CAR Macrophages: a promising novel immunotherapy for solid tumors and beyond
Lu, J., Ma, Y., Li, Q., Xu, Y., Xue, Y., & Xu, S. (2024) · Biomarker Research · doi:10.1186/s40364-024-00637-2 · Cited by 95
Abdin, S. M., Paasch, D., Kloos, A., Oliveira, M. C., Jang, M.-S., Ackermann, M., Σταμοπούλου, Α., Mroch, P. J., Falk, C. S., von Kaisenberg, C. S., et al. (2023) · Journal for ImmunoTherapy of Cancer · doi:10.1136/jitc-2023-007705 · Cited by 87
Continuous human iPSC-macrophage production by suspension culture in stirred tank bioreactors
Ackermann, M., Hashtchin, A. R., Manstein, F., Oliveira, M. C., Kempf, H., Zweigerdt, R., & Lachmann, N. (2022) · Nature Protocols · doi:10.1038/s41596-021-00654-7 · Cited by 84
Advances in Engineered Macrophages: A New Frontier in Cancer Immunotherapy
Yang, S., Wang, Y., Jia, J., Fang, Y., Yang, Y., Yuan, W., & Hu, J. (2024) · Cell Death and Disease · doi:10.1038/s41419-024-06616-7 · Cited by 66
Engineering immune-evasive allogeneic cellular immunotherapies
Martin, K. E., Hammer, Q., Perica, K., Sadelain, M., & Malmberg, K. (2024) · Nature reviews. Immunology · doi:10.1038/s41577-024-01022-8 · Cited by 64
Human Induced Pluripotent Stem Cell-Derived Macrophages Ameliorate Liver Fibrosis
Pouyanfard, S., Meshgin, N., Cruz, L. S., Diggle, K., Hashemi, H., Pham, T. V., Fierro, M., Tamayo, P., Fanjul, A. N., Kisseleva, T., et al. (2021) · Stem Cells · doi:10.1002/stem.3449 · Cited by 60
Nenasheva, T. A., Gerasimova, T., Serdyuk, Y. V., Grigor’eva, E. V., Kosmiadi, G. A., Nikolaev, A., Dashinimaev, E. B., & Lyadova, I. V. (2020) · Frontiers in Immunology · doi:10.3389/fimmu.2020.01016 · Cited by 45
Vaughan-Jackson, A., Stodolak, S., Ebrahimi, K. H., Browne, C., Reardon, P. K., Pires, E., Gilbert‐Jaramillo, J., Cowley, S. A., & James, W. (2021) · Stem Cell Reports · doi:10.1016/j.stemcr.2021.05.018 · Cited by 41
Exploring CAR-macrophages in non-tumor diseases: Therapeutic potential beyond cancer
Chen, Y., Xin, Q., Zhu, M., Qiu, J., Luo, Y., Li, R., Wei, W., & Tu, J. (2025) · Journal of Advanced Research · doi:10.1016/j.jare.2025.01.004 · Cited by 34
Kuebler, B., Álvarez-Palomo, B., Arán, B., Castaño, J., Rodriguez, L., Raya, Á., Querol, S., & Veiga, A. (2023) · Stem Cell Research & Therapy · doi:10.1186/s13287-023-03576-1 · Cited by 32
Self-citationCAR-armored-cell therapy in solid tumor treatment
Liu, Y., Xiao, L., Yang, M., Chen, X., Liu, H., Wang, Q., Guo, M., & Luo, J. (2024) · Journal of Translational Medicine · doi:10.1186/s12967-024-05903-3 · Cited by 32
Comprehensive review of macrophage models: primary cells and immortalized lines across species
Ding, T., Du, Y., Yang, B., Tian, W., Li, J., & Xie, J. (2025) · Frontiers in Immunology · doi:10.3389/fimmu.2025.1640935 · Cited by 32
Ackermann, M., Saleh, F., Abdin, S. M., Hashtchin, A. R., Gensch, I., Golgath, J., Oliveira, M. C., Nguyen, A. H. H., Gaedcke, S., Fenske, A., et al. (2024) · Stem Cell Research & Therapy · doi:10.1186/s13287-024-03785-2 · Cited by 24
Munn, C. G., Burton, S., Dickerson, S., Bakshy, K., Strouse, A., & Rajesh, D. (2021) · PLoS ONE · doi:10.1371/journal.pone.0250107 · Cited by 17
Optimizing the Method for Differentiation of Macrophages from Human Induced Pluripotent Stem Cells
Li, S., Song, L., Zhang, Y., Zhan, Z., Yang, Y., Yu, L., Zhu, H., Huang, W., Wang, W., Feng, H., et al. (2022) · Stem Cells International · doi:10.1155/2022/6593403 · Cited by 13
Optimized Method to Generate Well-Characterized Macrophages from Induced Pluripotent Stem Cells
Hai, Q., Bazeley, P. S., Han, J., Brubaker, G., Powers, J., Diaz-Montero, C. M., & Smith, J. D. (2025) · Biomedicines · doi:10.3390/biomedicines13010099 · Cited by 7
Cited by
Sorted by citations
Targeting macrophages in liver fibrosis
González del Barrio, L., Ipsen, D. H., Pfister, D. R., Hancz, D., & Scott, C. L. (2026) · Frontiers in Immunology · doi:10.3389/fimmu.2026.1835489 · Cited by 3
Modeling myeloid cell development in health and disease using induced pluripotent stem cells
Tesakov, I., Nasri, M., Klimiankou, M., Fındık, B., Loskill, P., & Skokowa, J. (2026) · Frontiers in Immunology · doi:10.3389/fimmu.2026.1815809 · Cited by 1
Amalina, T. N., Alsagaff, H., Sofa, S. L., Shofiyah, S., Sunaryo, B. F., Lova, K., Zakky, A., Febrianto, H., & Azis, R. (2026) · Molecular Biology Reports · doi:10.1007/s11033-026-12587-z
Metadata
- Authors
- De Homdedeu, M., Escribá, R., Rodríguez-González, K., Querol, S., Fernandez-Sojo, J., & Alvarez-Palomo, B.
- Affiliations
- Vall d'Hebron Institut de Recerca (ES)
- Banc de Sang i Teixits (ES)
- Fundación Josep Carreras Contra la Leucemia (ES)
- Venue
- Frontiers in Immunology
- Publisher
- Frontiers Media SA
- Published
- 2026-01-12
- Volume
- 16
- Pages
- 1719452-1719452
- ISSN
- 1664-3224 (ISSN-L)
- PMC
- PMC12833622
- OpenAlex
- W7122704894
- Cited by
- 3
- References
- 31
- Citations by year
- 2026: 3
- FWCI
- 6.20
- Type
- journal article
- Language
- en
- Open access
- gold
- doi.org
- Licence
- Locations
- Frontiers in Immunology (publishedVersion, cc-by)
- PubMed (publishedVersion)
- PubMed Central (publishedVersion, cc-by)
- DOAJ (DOAJ: Directory of Open Access Journals) (submittedVersion, cc-by-sa)
- Funders
- Ministerio de Ciencia e Innovación
- Topics
- Life Sciences › Biochemistry, Genetics and Molecular Biology › Molecular Biology › Pluripotent Stem Cells Research
- Life Sciences › Biochemistry, Genetics and Molecular Biology › Cell Biology › Mesenchymal stem cell research
- Health Sciences › Medicine › Hematology › Hematopoietic Stem Cell Transplantation
- Keywords
- human induced pluripotent stem cells, macrophage differentiation, IMACS, xeno-free culture, hematopoietic progenitor cells, myeloid progenitor cells, macrophage polarization, phagocytosis, scalable cell production
- MeSH terms
- Cell Differentiation, Cell Line, Cells, Cultured, Humans, Macrophages, Phagocytosis, Cytokines, Cell Culture Techniques, Induced Pluripotent Stem Cells
About these checks
Registry, retraction, Cites and statistics results are computed, not judged, with one exception: a printed reference that no index lists is read once by a model before it counts as a citation error. Claims are extracted by a model and kept only when their quote appears verbatim in the text; each cited source is then checked, with a model’s help, for whether it says what the claim relies on. Those verdicts can be wrong — read the claim’s quote and the cited source before relying on one.
Statistics and arithmetic are recomputed, not judged.
Confidence bands are shown only for fields calibrated on our annotated test set. None is calibrated yet, so no band is shown.
What counts as a claim ›How we measure confidence ›How we check this ›
Are you an author, or do you see a problem with this page? Request a review
