Cited by 110Neuroinflammation and Neurodegeneration MechanismsPhagocytosis and Immune RegulationInflammation biomarkers and pathways

The DOI matches its Crossref record; 86 of the 86 references it cites were found in a registry or an index.

Distinct Signaling Pathways Regulate TREM2 Phagocytic and NFκB Antagonistic Activities

Open access

Abstract

Several genetic variants of the Triggering Receptor Expressed on Myeloid Cells-2 (TREM2) have been shown to increase the risk of developing Alzheimer's disease (AD) supporting a role of microglia and immune cells in the pathobiology of AD. We have employed an ectopic model of TREM2 and DAP12 expression in HEK293 cells to study selectively TREM2 dependent signaling and phagocytic functions and evaluated the effects of some of the TREM2 mutations associated with AD. We show that shedding of the TREM2 N-terminal domain does not affect the inhibition of NFκB activation induced by TREM2 while it completely blocks phagocytosis suggesting that TREM2 anti-inflammatory properties can be mediated by the TREM2 C-terminal fragment while the phagocytic activity requires the full-length receptor. In addition, we confirm in that model that apolipoprotein E (APOE) is a ligand for TREM2 and triggers TREM2 signaling. In particular, we show that APOE4 stimulates spleen tyrosine kinase (SYK) activation more potently than APOE2 in a TREM2 dependent manner. Interestingly, TREM2 appears to antagonize NFκB activation induced by phorbol ester but is unable to prevent TNFα induction of NFκB activation suggesting that TREM2 antagonizes inflammatory events triggered downstream of PKC. TREM2 mutations drastically impact TREM2 phagocytosis as well as its ability to antagonize NFκB activation and notably prevent the activation of the PI3K/AKT pathway observed with wild-type TREM2. Overall our data suggest that TREM2 dependent phagocytosis requires an activation of the SYK/PI3K/AKT/PLCγ pathways while the suppression of NFκB activation by TREM2 is independent of SYK, PI3K, and PLCγ activities. This model of ectopic TREM2-DAP12 co-expression appears suitable to study TREM2 signaling as several biological functions of TREM2 and TREM2 mutations that have been previously described in myeloid and microglial cells were also replicated in this model.

Overview

The claims and statistics of this paper haven’t been checked yet.

Run the check — free, no account needed. It reads the open-access text and checks the sources it cites.

A few free checks a day · papers already verified open instantly · results are public

Integrity signals

Registry

Crossref · 10.3389/fncel.2019.00457

Cites

86 of 86 references verified0 citation errors · 0 not checkable

Statistics

Figures

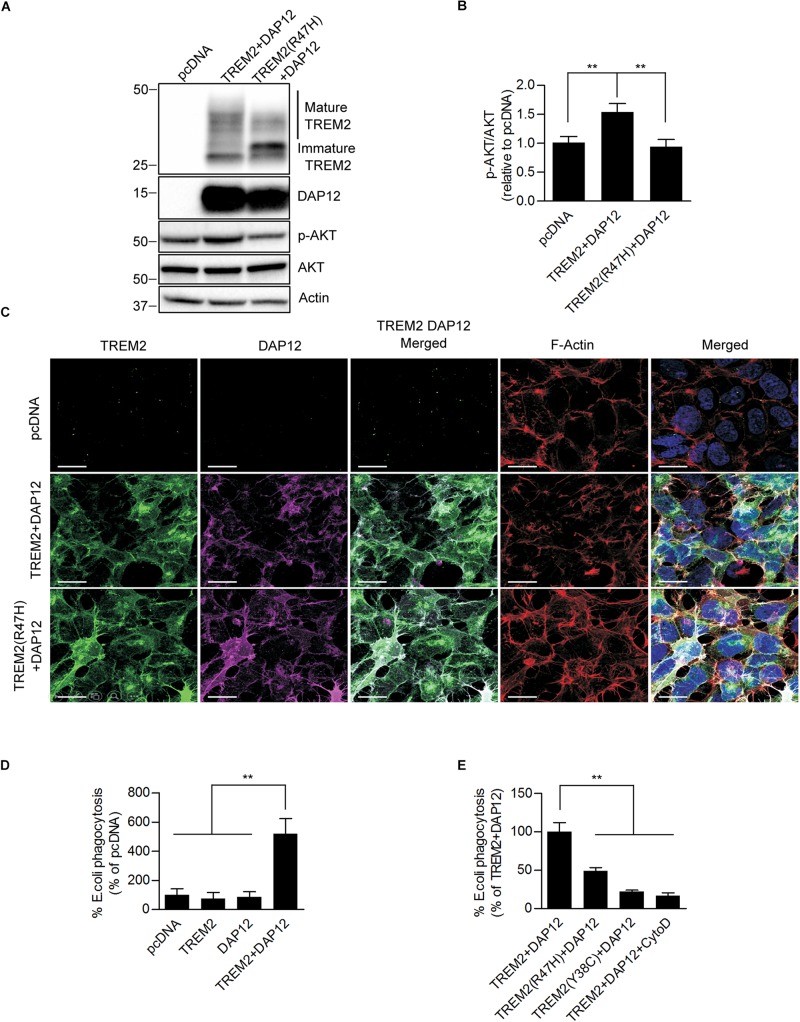
FIGURE 1 Ectopic expression of TREM2 and DAP12 induces AKT activation and phagocytosis in HEK293 cells. (A) Western-blot analysis of lysates from HEK293 cells transfected with pcDNA (control empty vector), TREM2 + DAP12 and TREM2 (R47H) + DAP12 constructs. A representative western-blot showing the impact of TREM2 + DAP12 and TREM2(R47H) + DAP12 expression on p-AKT(Ser473) compared to HEK293 cells transfected with the empty pcDNA vector (control) is shown. (B) Histogram representing the quantification by western-blots of p-AKT(Ser473) normalized to total AKT in HEK293 cells transfected with pcDNA (empty vector), TREM2 + DAP12 and TREM2(R47H) + DAP12 constructs. Data represent the average ± SD p-AKT/Total AKT levels standardized to values obtained in HEK293 cells transfected with the pcDNA empty vector; (n = 4) for each experimental condition; statistical significance (∗∗p < 0.01) was evaluated by ANOVA followed by post hoc analysis using Bonferroni corrections. (C) Representative laser confocal images of HEK293 cells transfected with pcDNA (empty vector), TREM2 + DAP12 and TREM2(R47H) + DAP12 following immunostaining with N-terminal TREM2 (green), DAP12 (purple) antibodies. Cells were counterstained with DAPI (blue) and fluorescent phalloidin (red) to stain F-actin. TREM2 and DAP12 expression was detected in HEK293 cells transfected with TREM2 + DAP12 and TREM2(R47H) + DAP12 constructs while no expression of TREM2 and DAP12 was observed in HEK293 cells transfected with the empty vector (pcDNA). Colocalization between TREM2 and DAP12 was observed both in cells co-expressing wild-type TREM2 and DAP12 and in cell co-expressing the TREM2 R47H mutation and DAP12. The white scale bar represents 20 μm. (D) Phagocytosis of pHrodo E. coli bioparticles conjugate in pcDNA, TREM2, DAP12, or TREM2 + DAP12 transfected HEK293 cells. Data are represented as mean ± SD from at least two independent cell culture experiments and expressed relative to data obtained in HEK293 transfected with the pcDNA empty vector; (n = 6) for each experimental condition; statistical significance (∗∗p < 0.01) was evaluated by ANOVA followed by post hoc analysis using Bonferroni corrections. Data show that the co-expression of DAP12 with TREM2 significantly stimulates the phagocytosis of pHrodo E. coli bioparticles whereas DAP12 or TREM2 expression alone are not sufficient to promote phagocytic activity compared to HEK293 transfected with the empty vector pcDNA (control). (E) Phagocytosis of pHrodo E. coli bioparticles conjugate in TREM2 + DAP12, TREM2(R47H) + DAP12, and TREM2(Y38C) + DAP12 transfected HEK293 cells. TREM2 + DAP12 transfected HEK293 cells were also treated with cytochalasin D (10 μM), an inhibitor of actin polymerization which blocks phagocytosis (positive control). Data are represented as means ± SD from at least two independent cell culture experiments and expressed as a percentage of the amount of phagocytosis quantified in TREM2 + DAP12 transfected HEK293 cells; (n = 6) for each experimental condition; statistical significance (∗∗p < 0.01) was evaluated by ANOVA followed by post hoc analysis using Bonferroni corrections. Data show that that cytochalasin D antagonizes TREM2 + DAP12 dependent phagocytic activity while TREM2(R47H) reduced phagocytosis by 50% and TREM2(Y38C) by 80% compared to wild-type TREM2.
FIGURE 1 Ectopic expression of TREM2 and DAP12 induces AKT activation and phagocytosis in HEK293 cells. (A) Western-blot analysis of lysates from HEK293 cells transfected with pcDNA (control empty vector), TREM2 + DAP12 and TREM2 (R47H) + DAP12 constructs. A representative western-blot showing the impact of TREM2 + DAP12 and TREM2(R47H) + DAP12 expression on p-AKT(Ser473) compared to HEK293 cells transfected with the empty pcDNA vector (control) is shown. (B) Histogram representing the quantification by western-blots of p-AKT(Ser473) normalized to total AKT in HEK293 cells transfected with pcDNA (empty vector), TREM2 + DAP12 and TREM2(R47H) + DAP12 constructs. Data represent the average ± SD p-AKT/Total AKT levels standardized to values obtained in HEK293 cells transfected with the pcDNA empty vector; (n = 4) for each experimental condition; statistical significance (∗∗p < 0.01) was evaluated by ANOVA followed by post hoc analysis using Bonferroni corrections. (C) Representative laser confocal images of HEK293 cells transfected with pcDNA (empty vector), TREM2 + DAP12 and TREM2(R47H) + DAP12 following immunostaining with N-terminal TREM2 (green), DAP12 (purple) antibodies. Cells were counterstained with DAPI (blue) and fluorescent phalloidin (red) to stain F-actin. TREM2 and DAP12 expression was detected in HEK293 cells transfected with TREM2 + DAP12 and TREM2(R47H) + DAP12 constructs while no expression of TREM2 and DAP12 was observed in HEK293 cells transfected with the empty vector (pcDNA). Colocalization between TREM2 and DAP12 was observed both in cells co-expressing wild-type TREM2 and DAP12 and in cell co-expressing the TREM2 R47H mutation and DAP12. The white scale bar represents 20 μm. (D) Phagocytosis of pHrodo E. coli bioparticles conjugate in pcDNA, TREM2, DAP12, or TREM2 + DAP12 transfected HEK293 cells. Data are represented as mean ± SD from at least two independent cell culture experiments and expressed relative to data obtained in HEK293 transfected with the pcDNA empty vector; (n = 6) for each experimental condition; statistical significance (∗∗p < 0.01) was evaluated by ANOVA followed by post hoc analysis using Bonferroni corrections. Data show that the co-expression of DAP12 with TREM2 significantly stimulates the phagocytosis of pHrodo E. coli bioparticles whereas DAP12 or TREM2 expression alone are not sufficient to promote phagocytic activity compared to HEK293 transfected with the empty vector pcDNA (control). (E) Phagocytosis of pHrodo E. coli bioparticles conjugate in TREM2 + DAP12, TREM2(R47H) + DAP12, and TREM2(Y38C) + DAP12 transfected HEK293 cells. TREM2 + DAP12 transfected HEK293 cells were also treated with cytochalasin D (10 μM), an inhibitor of actin polymerization which blocks phagocytosis (positive control). Data are represented as means ± SD from at least two independent cell culture experiments and expressed as a percentage of the amount of phagocytosis quantified in TREM2 + DAP12 transfected HEK293 cells; (n = 6) for each experimental condition; statistical significance (∗∗p < 0.01) was evaluated by ANOVA followed by post hoc analysis using Bonferroni corrections. Data show that that cytochalasin D antagonizes TREM2 + DAP12 dependent phagocytic activity while TREM2(R47H) reduced phagocytosis by 50% and TREM2(Y38C) by 80% compared to wild-type TREM2.CC BY · PubMed Central
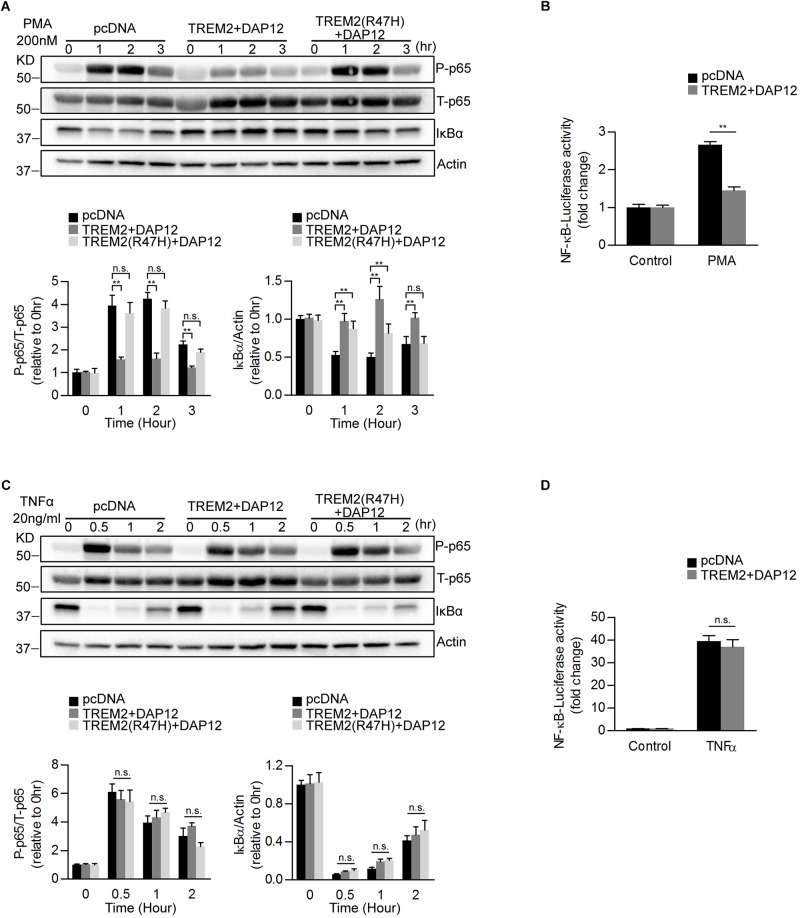
FIGURE 2 Overexpression of TREM2 and DAP12 in HEK 293 cells antagonizes PMA induced p65 NFκB phosphorylation and NFκB transactivity. (A) Western blot analysis of lysates from TREM2 + DAP12 and TREM2 (R47H) + DAP12 transfected HEK293 cells treated with PMA (200 nM) for different timepoints (0, 1, 2, and 3 h). Lower panel: the histogram represents the western-blot quantification of P-p65 NFκB (Ser536) normalized to total p65 NFκB (T-p65) levels and IκBα levels normalized to Actin levels. Data are represented as means ± SD and expressed relative to the 0-h timepoint; n = 4 for each experimental condition; statistical significance (∗∗p < 0.01; n.s., not significant) were evaluated by ANOVA followed by post hoc analyses with Bonferroni corrections. (B) The histogram represents the amount NFκB activation measured by quantifying PMA-induced intracellular luciferase activity in NFκB luciferase reporter HEK293 cell line transfected with pcDNA (empty vector) and TREM2 + DAP12. Data are represented as means ± SD from at least two independent cell culture experiments and expressed relative to NFκB luciferase activity measured in control cells transfected with the empty vector (pcDNA); n = 6 for each experimental condition; statistical significance (∗∗p < 0.01) was evaluated with ANOVA followed by post hoc analysis with Bonferroni corrections. (C) Western-blot analyses of lysates from TREM2 + DAP12 and TREM2 (R47H) + DAP12 transfected HEK293 cells treated with TNFα (20 ng/ml) for different timepoints (0, 0.5, 1, and 2 h). Lower panel: the histogram represents the western-blot quantification of P-p65 NFκB (Ser536)/total p65 NFκB (T-p65), and IκBα levels normalized to Actin. Data are represented as means ± SD and expressed relative to the 0-h timepoint; n = 4 for each experimental condition; statistical significance (n.s., not significant) was evaluated with ANOVA followed by post hoc analyses using Bonferroni correction. (D) The histogram represents the amount of NFκB activation measured by quantifying TNFα-induced intracellular luciferase activity in NFκB luciferase reporter HEK293 cells transfected with pcDNA (empty vector) and TREM2 + DAP12. Data are represented as means ± SD from at least two independent cell culture experiments and expressed relative to control HEK293 NFκB luciferase cells transfected with the empty vector; n = 6 for each experimental condition; statistical significance (n.s., not significant) was evaluated by ANOVA.
FIGURE 2 Overexpression of TREM2 and DAP12 in HEK 293 cells antagonizes PMA induced p65 NFκB phosphorylation and NFκB transactivity. (A) Western blot analysis of lysates from TREM2 + DAP12 and TREM2 (R47H) + DAP12 transfected HEK293 cells treated with PMA (200 nM) for different timepoints (0, 1, 2, and 3 h). Lower panel: the histogram represents the western-blot quantification of P-p65 NFκB (Ser536) normalized to total p65 NFκB (T-p65) levels and IκBα levels normalized to Actin levels. Data are represented as means ± SD and expressed relative to the 0-h timepoint; n = 4 for each experimental condition; statistical significance (∗∗p < 0.01; n.s., not significant) were evaluated by ANOVA followed by post hoc analyses with Bonferroni corrections. (B) The histogram represents the amount NFκB activation measured by quantifying PMA-induced intracellular luciferase activity in NFκB luciferase reporter HEK293 cell line transfected with pcDNA (empty vector) and TREM2 + DAP12. Data are represented as means ± SD from at least two independent cell culture experiments and expressed relative to NFκB luciferase activity measured in control cells transfected with the empty vector (pcDNA); n = 6 for each experimental condition; statistical significance (∗∗p < 0.01) was evaluated with ANOVA followed by post hoc analysis with Bonferroni corrections. (C) Western-blot analyses of lysates from TREM2 + DAP12 and TREM2 (R47H) + DAP12 transfected HEK293 cells treated with TNFα (20 ng/ml) for different timepoints (0, 0.5, 1, and 2 h). Lower panel: the histogram represents the western-blot quantification of P-p65 NFκB (Ser536)/total p65 NFκB (T-p65), and IκBα levels normalized to Actin. Data are represented as means ± SD and expressed relative to the 0-h timepoint; n = 4 for each experimental condition; statistical significance (n.s., not significant) was evaluated with ANOVA followed by post hoc analyses using Bonferroni correction. (D) The histogram represents the amount of NFκB activation measured by quantifying TNFα-induced intracellular luciferase activity in NFκB luciferase reporter HEK293 cells transfected with pcDNA (empty vector) and TREM2 + DAP12. Data are represented as means ± SD from at least two independent cell culture experiments and expressed relative to control HEK293 NFκB luciferase cells transfected with the empty vector; n = 6 for each experimental condition; statistical significance (n.s., not significant) was evaluated by ANOVA.CC BY · PubMed Central
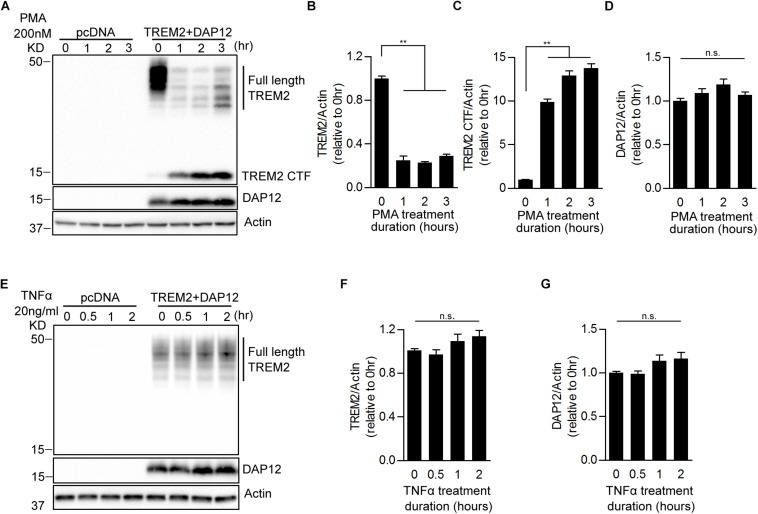
FIGURE 3 Effects of PMA and TNFα treatments on the shedding of TREM2 in HEK293 cells overexpressing TREM2 + DAP12. (A) A representative western-blot showing the effects of PMA on full length TREM2 and TREM2-CTF is shown. Control pcDNA (empty vector) and TREM2 + DAP12 transfected HEK293 cells were treated with PMA (200 nM) for different timepoints (0, 1, 2, and 3 h). The histograms represent the quantification of western-blot data and show the amount of full length TREM2 normalized to Actin (B), TREM2-CTF levels normalized to Actin (C), and DAP12 levels normalized to Actin (D). Data are represented as means ± SD and expressed relative to the 0-h timepoint; n = 4 for each experimental condition; statistical significance (∗∗p < 0.01; n.s., not significant) was evaluated by ANOVA followed by post hoc analyses using Bonferroni corrections. (E) Western blot analysis of lysates from TREM2 + DAP12 transfected HEK293 cells treated with TNFα (20 ng/ml) for different timepoints (0, 0.5, 1, and 2 h). The histograms depict the quantification of full length TREM2 levels normalized to Actin (F) and DAP12 levels normalized to Actin (G). Data are represented as means ± SD and expressed relative to 0-h timepoint; n = 4 for each experimental condition; statistical significance (n.s., not significant) was evaluated by ANOVA.
FIGURE 3 Effects of PMA and TNFα treatments on the shedding of TREM2 in HEK293 cells overexpressing TREM2 + DAP12. (A) A representative western-blot showing the effects of PMA on full length TREM2 and TREM2-CTF is shown. Control pcDNA (empty vector) and TREM2 + DAP12 transfected HEK293 cells were treated with PMA (200 nM) for different timepoints (0, 1, 2, and 3 h). The histograms represent the quantification of western-blot data and show the amount of full length TREM2 normalized to Actin (B), TREM2-CTF levels normalized to Actin (C), and DAP12 levels normalized to Actin (D). Data are represented as means ± SD and expressed relative to the 0-h timepoint; n = 4 for each experimental condition; statistical significance (∗∗p < 0.01; n.s., not significant) was evaluated by ANOVA followed by post hoc analyses using Bonferroni corrections. (E) Western blot analysis of lysates from TREM2 + DAP12 transfected HEK293 cells treated with TNFα (20 ng/ml) for different timepoints (0, 0.5, 1, and 2 h). The histograms depict the quantification of full length TREM2 levels normalized to Actin (F) and DAP12 levels normalized to Actin (G). Data are represented as means ± SD and expressed relative to 0-h timepoint; n = 4 for each experimental condition; statistical significance (n.s., not significant) was evaluated by ANOVA.CC BY · PubMed Central
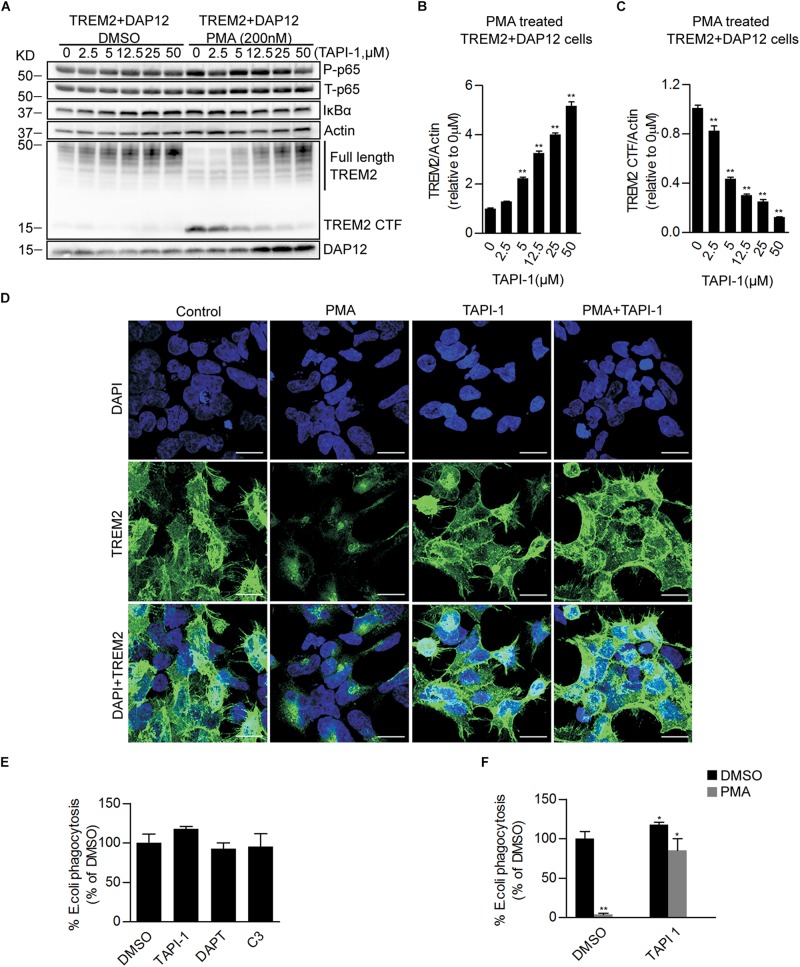
FIGURE 4 Pharmacological inhibition of ADAM proteases prevents PMA induced TREM2 shedding and increases phagocytosis in TREM2 + DAP12 HEK293 cells. (A) Western blot analysis of lysates from TREM2 + DAP12 HEK293 cells pretreated with different does of TAPI1 (0, 2.5, 5, 12.5, 25, and 50 μM) for 1 h, and then challenged with PMA (200 nM) for 1 h. The histograms represent the quantification of full length TREM2 levels normalized to Actin (B) and TREM2 CTF levels normalized to Actin used as a reference protein (C). Data are represented as means ± SD and expressed relatively to the level of full length TREM2 quantified in TREM2 + DAP12 HEK293 cells prior to TAPI-1 treatment; n = 4 for each experimental condition; statistical significance (∗∗p < 0.01) was evaluated by ANOVA followed by post hoc analyses with Bonferroni corrections. (D) Representative laser confocal images obtained following immunostaining with an N-terminal TREM2 antibody (green) and counterstaining with DAPI (blue) in HEK293 cells transfected with TREM2 + DAP12. Cells were pretreated with or without TAPI 1 (25 μM) for 1 h, and then challenged with PMA (200 nM) for 1 h prior to immunostaining. The white scale bar represents 20 μm. (E) Phagocytosis of pHrodo E. coli bioparticles conjugate in TREM2 + DAP12 transfected HEK293 cells treated with TAPI 1 (25 μM), DAPT (10 μM), or C3 (10 μM) for 1 h. Data are represented as means ± SD from at least two independent cell culture experiments and expressed as a percentage of the values obtained in DMSO (vehicle used to dissolve TAPI-1, DAPT, and C3) treatment conditions (control); n = 6 for each experimental condition; statistical significance (∗p < 0.05) was evaluated by ANOVA followed by post hoc analyses with Bonferroni corrections. (F) Phagocytosis of pHrodo E. coli bioparticles conjugate in TREM2 + DAP12 transfected HEK293 cells pretreated with TAPI-1 (25 μM) for 1 h and then challenged with PMA (200 nM) for 1 h. Data are represented as means ± SD from at least two independent cell culture experiments and expressed as a percentage of the values obtained in TREM2 + DAP12 HEK293 cells following DMSO treatment; n = 6 for each experimental condition; statistical significance (∗p < 0.05; ∗∗p < 0.01) was evaluated by ANOVA followed by post hoc analyses with Bonferroni correction.
FIGURE 4 Pharmacological inhibition of ADAM proteases prevents PMA induced TREM2 shedding and increases phagocytosis in TREM2 + DAP12 HEK293 cells. (A) Western blot analysis of lysates from TREM2 + DAP12 HEK293 cells pretreated with different does of TAPI1 (0, 2.5, 5, 12.5, 25, and 50 μM) for 1 h, and then challenged with PMA (200 nM) for 1 h. The histograms represent the quantification of full length TREM2 levels normalized to Actin (B) and TREM2 CTF levels normalized to Actin used as a reference protein (C). Data are represented as means ± SD and expressed relatively to the level of full length TREM2 quantified in TREM2 + DAP12 HEK293 cells prior to TAPI-1 treatment; n = 4 for each experimental condition; statistical significance (∗∗p < 0.01) was evaluated by ANOVA followed by post hoc analyses with Bonferroni corrections. (D) Representative laser confocal images obtained following immunostaining with an N-terminal TREM2 antibody (green) and counterstaining with DAPI (blue) in HEK293 cells transfected with TREM2 + DAP12. Cells were pretreated with or without TAPI 1 (25 μM) for 1 h, and then challenged with PMA (200 nM) for 1 h prior to immunostaining. The white scale bar represents 20 μm. (E) Phagocytosis of pHrodo E. coli bioparticles conjugate in TREM2 + DAP12 transfected HEK293 cells treated with TAPI 1 (25 μM), DAPT (10 μM), or C3 (10 μM) for 1 h. Data are represented as means ± SD from at least two independent cell culture experiments and expressed as a percentage of the values obtained in DMSO (vehicle used to dissolve TAPI-1, DAPT, and C3) treatment conditions (control); n = 6 for each experimental condition; statistical significance (∗p < 0.05) was evaluated by ANOVA followed by post hoc analyses with Bonferroni corrections. (F) Phagocytosis of pHrodo E. coli bioparticles conjugate in TREM2 + DAP12 transfected HEK293 cells pretreated with TAPI-1 (25 μM) for 1 h and then challenged with PMA (200 nM) for 1 h. Data are represented as means ± SD from at least two independent cell culture experiments and expressed as a percentage of the values obtained in TREM2 + DAP12 HEK293 cells following DMSO treatment; n = 6 for each experimental condition; statistical significance (∗p < 0.05; ∗∗p < 0.01) was evaluated by ANOVA followed by post hoc analyses with Bonferroni correction.CC BY · PubMed Central
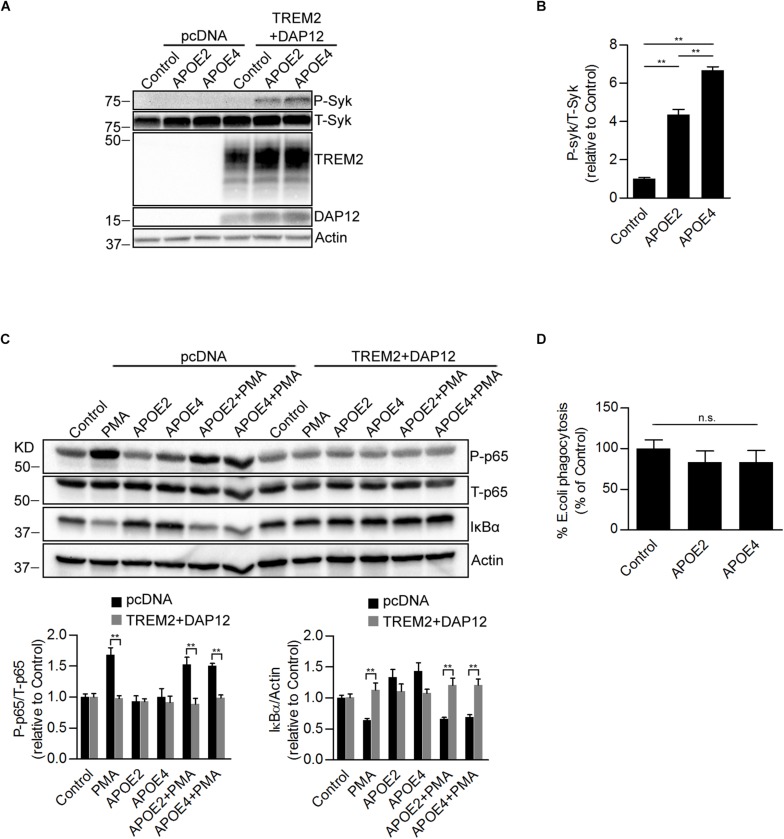
FIGURE 5 Effects of ApoE isoforms on SYK kinase phosphorylation, NF-κB activation, and phagocytosis in TREM2 + DAP12 transfected HEK293 cells. (A) Western blot analysis of lysates from pcDNA and TREM2 + DAP12 transfected HEK293 cells following treatment with APOE2 (10 μg/ml) and APOE4 (10 μg/ml) for 12 h. (B) The histogram represents the quantification of P-Syk (Tyr525/526)/total Syk(T-Syk) ratios in TREM2 + DAP12 HEK293 cells with and without treatment with ApoE isoforms. Data are represented as means ± SD and expressed relative to TREM2 + DAP12 cells untreated with ApoE isoforms; n = 4 for each treatment condition; statistical significance (∗∗p < 0.01) was evaluated by ANOVA followed by post hoc analyses with Bonferroni correction. (C) Western blot analysis of lysates from pcDNA (empty vector) or TREM2 + DAP12 transfected HEK293 cells pretreated with APOE2 (10 μg/ml) and APOE4 (10 μg/ml) for 12 h, and then challenged with PMA (200 nM) for 1 h. Lower panel: the histograms represent the quantification of P-p65 (Ser536)/total P65 (T-p65) ratios and IκBα levels normalized to Actin. Data are represented as means ± SD and expressed relative to untreated pcDNA (empty vector) control cells; n = 4 for each treatment condition; statistical significance (∗∗p < 0.01) was evaluated by ANOVA followed post hoc analysis with Bonferroni correction. (D) Phagocytosis of pHrodo E. coli bioparticles conjugate in TREM2 + DAP12 transfected HEK293 cells pretreated with APOE2 (10 μg/ml) and APOE4 (10 μg/ml) for 12 h. Data are represented as means ± SD from at least two independent cell culture experiments and expressed as a percentage of the phagocytic activity measured in TREM2 + DAP12 HEK293 cells without APOE treatment; n = 6 for each experimental condition; ANOVA reveals no significant main effect of APOE4 and APOE2 on phagocytosis (n.s., not significant).
FIGURE 5 Effects of ApoE isoforms on SYK kinase phosphorylation, NF-κB activation, and phagocytosis in TREM2 + DAP12 transfected HEK293 cells. (A) Western blot analysis of lysates from pcDNA and TREM2 + DAP12 transfected HEK293 cells following treatment with APOE2 (10 μg/ml) and APOE4 (10 μg/ml) for 12 h. (B) The histogram represents the quantification of P-Syk (Tyr525/526)/total Syk(T-Syk) ratios in TREM2 + DAP12 HEK293 cells with and without treatment with ApoE isoforms. Data are represented as means ± SD and expressed relative to TREM2 + DAP12 cells untreated with ApoE isoforms; n = 4 for each treatment condition; statistical significance (∗∗p < 0.01) was evaluated by ANOVA followed by post hoc analyses with Bonferroni correction. (C) Western blot analysis of lysates from pcDNA (empty vector) or TREM2 + DAP12 transfected HEK293 cells pretreated with APOE2 (10 μg/ml) and APOE4 (10 μg/ml) for 12 h, and then challenged with PMA (200 nM) for 1 h. Lower panel: the histograms represent the quantification of P-p65 (Ser536)/total P65 (T-p65) ratios and IκBα levels normalized to Actin. Data are represented as means ± SD and expressed relative to untreated pcDNA (empty vector) control cells; n = 4 for each treatment condition; statistical significance (∗∗p < 0.01) was evaluated by ANOVA followed post hoc analysis with Bonferroni correction. (D) Phagocytosis of pHrodo E. coli bioparticles conjugate in TREM2 + DAP12 transfected HEK293 cells pretreated with APOE2 (10 μg/ml) and APOE4 (10 μg/ml) for 12 h. Data are represented as means ± SD from at least two independent cell culture experiments and expressed as a percentage of the phagocytic activity measured in TREM2 + DAP12 HEK293 cells without APOE treatment; n = 6 for each experimental condition; ANOVA reveals no significant main effect of APOE4 and APOE2 on phagocytosis (n.s., not significant).CC BY · PubMed Central
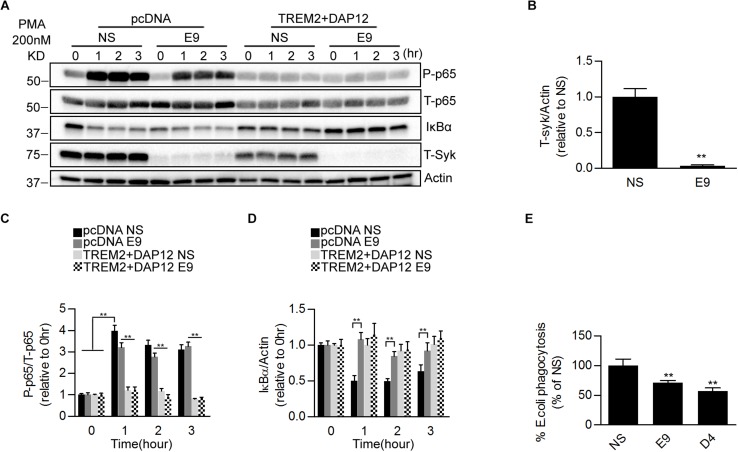
FIGURE 6 Effects of genetic suppression of SYK kinase expression on NFκB activation and phagocytosis in TREM2 + DAP12 transfected HEK293 cells. (A) Western blot analysis of lysates from pcDNA or TREM2 + DAP12 transfected HEK293 cells, with or without silencing of the Syk gene [lentiviral vector expressing Syk specific shRNA(E9) or nonsense control shRNAs(NS)], following treatment with PMA (200 nM) for the indicated timepoints (0, 1, 2, and 3 h). (B) The histogram represents the quantification of Syk levels normalized to Actin in control TREM2 + DAP12 HEK293 cells transfected with the nonsense shRNA (NS) and in TREM2 + DAP12 cells in which the Syk gene was silenced (shRNA E9). Data are represented as means ± SD and expressed relative to RNAi the amount of SYK quantified in shRNA nonsense (NS) transfected cells; n = 4 for each experimental condition; statistical significance (∗∗p < 0.01) was evaluated with two-tailed Student’s t-test. (C,D) The histograms represent the ratios of P-p65 NFκB (Ser536)/total p65 NFκB (T-p65) and IκBα levels normalized to Actin. Data are represented as means ± SD and expressed relative to pcDNA (empty vector) shRNA nonsense (NS) transfected cells; n = 4 for each treatment condition; statistical significance (∗∗p < 0.01; n.s., not significant) was evaluated by ANOVA followed by post hoc analyses with Bonferroni correction. (E) Phagocytosis of pHrodo E. coli bioparticles conjugate in TREM2 + DAP12 transfected HEK293 cells with or without silencing of the Syk gene [lentiviral vector expressing Syk specific shRNA (E9 and D4) or nonsense control shRNAs(NS)]. Data are represented as means ± SD from at least two independent cell culture experiments and expressed relative to shRNA nonsense (NS) transfected cells TREM2 + DAP12 HEK293 cells; n = 6 for each experimental condition; statistical significance (∗∗p < 0.01) was evaluated by ANOVA followed by post hoc analyses with Bonferroni correction.
FIGURE 6 Effects of genetic suppression of SYK kinase expression on NFκB activation and phagocytosis in TREM2 + DAP12 transfected HEK293 cells. (A) Western blot analysis of lysates from pcDNA or TREM2 + DAP12 transfected HEK293 cells, with or without silencing of the Syk gene [lentiviral vector expressing Syk specific shRNA(E9) or nonsense control shRNAs(NS)], following treatment with PMA (200 nM) for the indicated timepoints (0, 1, 2, and 3 h). (B) The histogram represents the quantification of Syk levels normalized to Actin in control TREM2 + DAP12 HEK293 cells transfected with the nonsense shRNA (NS) and in TREM2 + DAP12 cells in which the Syk gene was silenced (shRNA E9). Data are represented as means ± SD and expressed relative to RNAi the amount of SYK quantified in shRNA nonsense (NS) transfected cells; n = 4 for each experimental condition; statistical significance (∗∗p < 0.01) was evaluated with two-tailed Student’s t-test. (C,D) The histograms represent the ratios of P-p65 NFκB (Ser536)/total p65 NFκB (T-p65) and IκBα levels normalized to Actin. Data are represented as means ± SD and expressed relative to pcDNA (empty vector) shRNA nonsense (NS) transfected cells; n = 4 for each treatment condition; statistical significance (∗∗p < 0.01; n.s., not significant) was evaluated by ANOVA followed by post hoc analyses with Bonferroni correction. (E) Phagocytosis of pHrodo E. coli bioparticles conjugate in TREM2 + DAP12 transfected HEK293 cells with or without silencing of the Syk gene [lentiviral vector expressing Syk specific shRNA (E9 and D4) or nonsense control shRNAs(NS)]. Data are represented as means ± SD from at least two independent cell culture experiments and expressed relative to shRNA nonsense (NS) transfected cells TREM2 + DAP12 HEK293 cells; n = 6 for each experimental condition; statistical significance (∗∗p < 0.01) was evaluated by ANOVA followed by post hoc analyses with Bonferroni correction.CC BY · PubMed Central
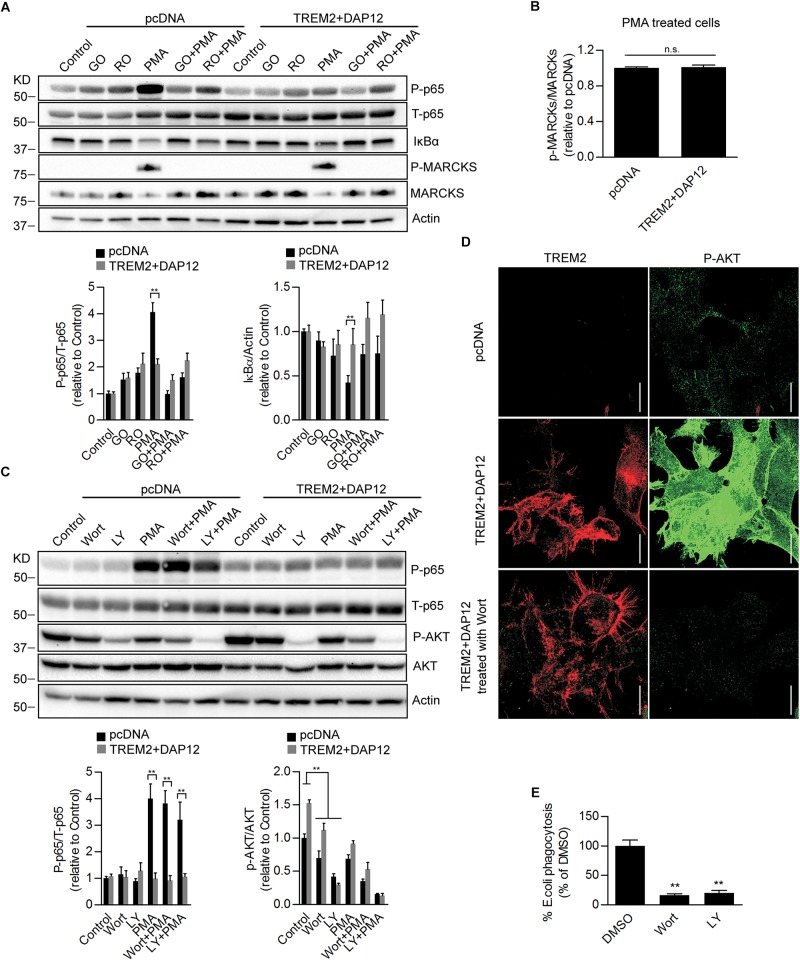
FIGURE 7 Effects of Pharmacological inhibition of PI3K/AKT signaling on NFκB activation and phagocytosis in TREM2 + DAP12 HEK293 cells. (A) Western-blot analysis of lysates from TREM2 + DAP12 transfected HEK293 cells pretreated with different PKC inhibitors Go 6983 (Go; 5 μM), Ro 32-0432 (Ro; 10 μM) for 1 h, and then challenged with PMA (200 nM) for 1 h. Lower panel: the histograms represent the ratios of P-p65 NFκB (Ser536)/total p65 NFκB and IκBα levels normalized to Actin in control pcDNA (empty vector) cells and in TREM2 + DAP12 HEK93 cells. Data are represented as means ± SD and expressed relative to control pcDNA cells; n = 4 for each experimental condition; statistical significance (∗∗p < 0.01) was evaluated by ANOVA followed by post hoc analyses with Bonferroni correction. (B) The histogram represents the ratios of p-MARCKs/total MARCKs in PMA treated pcDNA (control cells) and TREM2 + DAP12 transfected HEK293 cells. Data are represented as means ± SD and expressed relative to pcDNA transfected cells; n = 4 for each experimental condition; no statistical significance (n.s.; p > 0.05) was found using a two-tailed Student’s t-test. (C) Western blot analysis of lysates from pcDNA (empty vector) and TREM2 + DAP12 transfected HEK293 cells pretreated with different PI3K inhibitors: wortmannin (wort; 200 nM) and LY 294002 (LY; 20 μM) for 1 h, and then challenged with PMA (200 nM) for 1 h. Lower panel: the histograms represent the ratios of P-p65 NFκB (Ser536)/total p65 NFκB (T-p65) and p-AKT(Ser473)/Total AKT levels normalized to Actin quantified in control pcDNA (empty vector) and TREM2 + DAP12 HEK293 cells. Data are represented as means ± SD and expressed relative to control pcDNA (empty vector) transfected HEK293 cells; n = 4 for each experimental condition; statistical significance (∗∗p < 0.01) was evaluated by ANOVA followed by post hoc analyses with Bonferroni corrections. (D) Representative laser confocal images obtained following immunostaining of HEK293 cells transfected with pcDNA (empty vector) and TREM2 + DAP12 HEK293 cells using an N-terminal TREM2 antibody (red), and a p-AKT (Ser473) antibody (green) following treatment of the cells with the PI3K inhibitor wortmannin (wort; 200 nM) for 1 h. The white scale bar represents 20 μm. (E) Phagocytosis of pHrodo E. coli bioparticles conjugate in TREM2 + DAP12 transfected HEK293 cells treated with the PI3K inhibitors wortmannin (wort; 200 nM) and LY 294002 (LY; 20 μM) for 1 h. Data are represented as means ± SD from at least two independent cell culture experiments and expressed relative to DMSO (vehicle) conditions in TREM2 + DAP12 HEK293 cells; n = 6 for each treatment condition; statistical significance (∗∗p < 0.01) was evaluated by one-way ANOVA followed by post hoc analyses with Bonferroni corrections.
FIGURE 7 Effects of Pharmacological inhibition of PI3K/AKT signaling on NFκB activation and phagocytosis in TREM2 + DAP12 HEK293 cells. (A) Western-blot analysis of lysates from TREM2 + DAP12 transfected HEK293 cells pretreated with different PKC inhibitors Go 6983 (Go; 5 μM), Ro 32-0432 (Ro; 10 μM) for 1 h, and then challenged with PMA (200 nM) for 1 h. Lower panel: the histograms represent the ratios of P-p65 NFκB (Ser536)/total p65 NFκB and IκBα levels normalized to Actin in control pcDNA (empty vector) cells and in TREM2 + DAP12 HEK93 cells. Data are represented as means ± SD and expressed relative to control pcDNA cells; n = 4 for each experimental condition; statistical significance (∗∗p < 0.01) was evaluated by ANOVA followed by post hoc analyses with Bonferroni correction. (B) The histogram represents the ratios of p-MARCKs/total MARCKs in PMA treated pcDNA (control cells) and TREM2 + DAP12 transfected HEK293 cells. Data are represented as means ± SD and expressed relative to pcDNA transfected cells; n = 4 for each experimental condition; no statistical significance (n.s.; p > 0.05) was found using a two-tailed Student’s t-test. (C) Western blot analysis of lysates from pcDNA (empty vector) and TREM2 + DAP12 transfected HEK293 cells pretreated with different PI3K inhibitors: wortmannin (wort; 200 nM) and LY 294002 (LY; 20 μM) for 1 h, and then challenged with PMA (200 nM) for 1 h. Lower panel: the histograms represent the ratios of P-p65 NFκB (Ser536)/total p65 NFκB (T-p65) and p-AKT(Ser473)/Total AKT levels normalized to Actin quantified in control pcDNA (empty vector) and TREM2 + DAP12 HEK293 cells. Data are represented as means ± SD and expressed relative to control pcDNA (empty vector) transfected HEK293 cells; n = 4 for each experimental condition; statistical significance (∗∗p < 0.01) was evaluated by ANOVA followed by post hoc analyses with Bonferroni corrections. (D) Representative laser confocal images obtained following immunostaining of HEK293 cells transfected with pcDNA (empty vector) and TREM2 + DAP12 HEK293 cells using an N-terminal TREM2 antibody (red), and a p-AKT (Ser473) antibody (green) following treatment of the cells with the PI3K inhibitor wortmannin (wort; 200 nM) for 1 h. The white scale bar represents 20 μm. (E) Phagocytosis of pHrodo E. coli bioparticles conjugate in TREM2 + DAP12 transfected HEK293 cells treated with the PI3K inhibitors wortmannin (wort; 200 nM) and LY 294002 (LY; 20 μM) for 1 h. Data are represented as means ± SD from at least two independent cell culture experiments and expressed relative to DMSO (vehicle) conditions in TREM2 + DAP12 HEK293 cells; n = 6 for each treatment condition; statistical significance (∗∗p < 0.01) was evaluated by one-way ANOVA followed by post hoc analyses with Bonferroni corrections.CC BY · PubMed Central
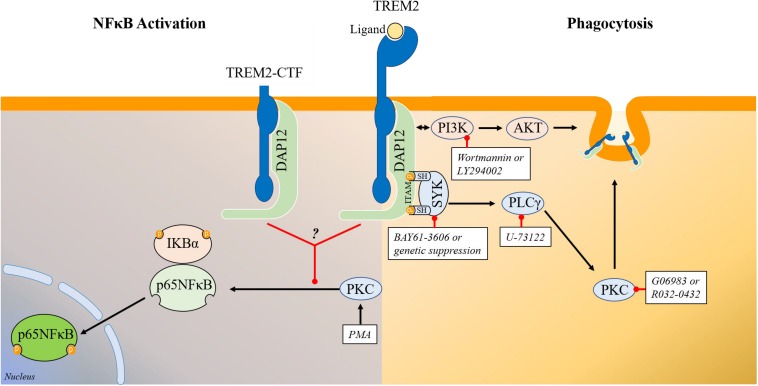
FIGURE 8 Schematic representation of the signaling pathways regulating TREM2 phagocytosis and TREM2 modulation of NFκB phosphorylation/activation. (Right) Schematic representation of the signaling pathways involved in the regulation of phagocytosis by TREM2. Overall our data show that TREM2 leads to an activation of SYK and of the PI3K/AKT pathways. Genetic suppression or inhibition of SYK activity with BAY61-3606 does not prevent the induction of the PI3K/AKT pathway in HEK293 TREM2/DAP12 cells suggesting that SYK activation and PI3K activation are triggered independently by TREM2. The PI3K inhibitors wortmannin and LY294002 prevent AKT phosphorylation in TREM2/DAP12 cells showing that the TREM2 stimulation of AKT phosphorylation is mediated by PI3K while suppression of SYK expression as well as SYK inhibition with BAY61-3606 do not affect AKT phosphorylation. Interestingly, both SYK inhibition with BAY61-3606 or suppression of SYK expression, PI3K inhibition with wortmannin and LY294002, PLCγ inhibition with U-73122 and PKC inhibition with Go6983 and Ro32-0432 are all antagonizing TREM2 phagocytosis in HEK293 TREM2-DAP12 cells highlighting the involvement of these signaling elements in TREM2 mediated phagocytosis. (Left) Schematic representation of signaling elements involved in the regulation of p65NFκB phosphorylation by TREM2. TREM2-DAP12 prevents the degradation of IKBα induced by PMA, suppresses p65 NFκB phosphorylation induced by PMA and also prevents NFκB transactivation induced by PMA showing globally that TREM2-DAP12 antagonizes NFκB activation induced by PMA. Overall, the suppression of p65NFκB phosphorylation by TREM2 (either full length or TREM2-CTF) in response to PMA is not affected by SYK inhibition, PI3K inhibition or PLCγ inhibition. In addition, MARCKS phosphorylation (direct substrate of PKCs) induced by PMA is not suppressed by TREM2 showing that TREM2 does not prevent PKC activation induced by PMA. These data suggest that TREM2 is acting downstream of PKC to suppress p65NFκB phosphorylation induced by PMA.
FIGURE 8 Schematic representation of the signaling pathways regulating TREM2 phagocytosis and TREM2 modulation of NFκB phosphorylation/activation. (Right) Schematic representation of the signaling pathways involved in the regulation of phagocytosis by TREM2. Overall our data show that TREM2 leads to an activation of SYK and of the PI3K/AKT pathways. Genetic suppression or inhibition of SYK activity with BAY61-3606 does not prevent the induction of the PI3K/AKT pathway in HEK293 TREM2/DAP12 cells suggesting that SYK activation and PI3K activation are triggered independently by TREM2. The PI3K inhibitors wortmannin and LY294002 prevent AKT phosphorylation in TREM2/DAP12 cells showing that the TREM2 stimulation of AKT phosphorylation is mediated by PI3K while suppression of SYK expression as well as SYK inhibition with BAY61-3606 do not affect AKT phosphorylation. Interestingly, both SYK inhibition with BAY61-3606 or suppression of SYK expression, PI3K inhibition with wortmannin and LY294002, PLCγ inhibition with U-73122 and PKC inhibition with Go6983 and Ro32-0432 are all antagonizing TREM2 phagocytosis in HEK293 TREM2-DAP12 cells highlighting the involvement of these signaling elements in TREM2 mediated phagocytosis. (Left) Schematic representation of signaling elements involved in the regulation of p65NFκB phosphorylation by TREM2. TREM2-DAP12 prevents the degradation of IKBα induced by PMA, suppresses p65 NFκB phosphorylation induced by PMA and also prevents NFκB transactivation induced by PMA showing globally that TREM2-DAP12 antagonizes NFκB activation induced by PMA. Overall, the suppression of p65NFκB phosphorylation by TREM2 (either full length or TREM2-CTF) in response to PMA is not affected by SYK inhibition, PI3K inhibition or PLCγ inhibition. In addition, MARCKS phosphorylation (direct substrate of PKCs) induced by PMA is not suppressed by TREM2 showing that TREM2 does not prevent PKC activation induced by PMA. These data suggest that TREM2 is acting downstream of PKC to suppress p65NFκB phosphorylation induced by PMA.CC BY · PubMed Central

Verification

Claims the paper makes

The claims and statistics of this paper haven’t been checked yet.

Run the check — free, no account needed. It reads the open-access text and checks the sources it cites.

A few free checks a day · papers already verified open instantly · results are public

Claims other papers make about this one

Each is checked against this paper’s own text: does it say what the citing paper says it does?

Self-check

Percentages, sums and reported differences re-computed from the paper’s own numbers.

The self-check needs the paper’s full text.

Citations

Cites

Show all 86 references

Cited by

Sorted by citations

See all 110

Metadata

Authors
Yao, H., Coppola, K., Schweig, J. E., Crawford, F., Mullan, M., & Paris, D.
Affiliations
James A. Haley Veterans' Hospital (US)
Corresponding author
Yao, Hailan
Venue
Frontiers in Cellular Neuroscience
Published
2019-10-10
Volume
13
Pages
457-457
ISSN
1662-5102 (ISSN-L)
OpenAlex
W2979963278
Cited by
110
References
86
Citations by year
2026: 14 · 2025: 22 · 2024: 21 · 2023: 17 · 2022: 17 · 2021: 13 · 2020: 6
FWCI
3.96
Type
journal article
Language
en
Open access
Locations
  • Frontiers in Cellular Neuroscience (publishedVersion, cc-by)
  • Europe PMC (PubMed Central) (publishedVersion, cc-by)
  • PubMed Central (publishedVersion, cc-by)
  • PubMed (publishedVersion)
  • DOAJ (DOAJ: Directory of Open Access Journals) (submittedVersion, cc-by-sa)
Funders
U.S. Department of Veterans Affairs
Topics
  • Life Sciences › Neuroscience › Neurology › Neuroinflammation and Neurodegeneration Mechanisms
  • Life Sciences › Immunology and Microbiology › Immunology › Phagocytosis and Immune Regulation
  • Life Sciences › Immunology and Microbiology › Immunology › Inflammation biomarkers and pathways
Keywords
TREM2, Alzheimer's disease, phagocytosis, NF-κB signaling, DAP12, Syk, apolipoprotein E, APOE ε4, PI3K/Akt signaling, phospholipase C-gamma, microglia, anti-inflammatory signaling, TNF-α

About these checks

Registry, retraction, Cites and statistics results are computed, not judged, with one exception: a printed reference that no index lists is read once by a model before it counts as a citation error. Claims are extracted by a model and kept only when their quote appears verbatim in the text; each cited source is then checked, with a model’s help, for whether it says what the claim relies on. Those verdicts can be wrong — read the claim’s quote and the cited source before relying on one.

Statistics and arithmetic are recomputed, not judged.

Confidence bands are shown only for fields calibrated on our annotated test set. None is calibrated yet, so no band is shown.

What counts as a claim ›How we measure confidence ›How we check this ›

Are you an author, or do you see a problem with this page? Request a review