

The DOI matches its Crossref record; 96 of the 97 references it cites were found in a registry or an index; none of the 49 sources its claims cite is checked for support yet.
The anatomy of choice: active inference and agency
Open accessAbstract
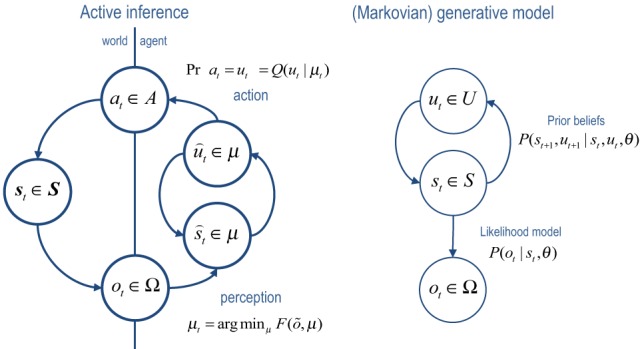
This paper considers agency in the setting of embodied or active inference. In brief, we associate a sense of agency with prior beliefs about action and ask what sorts of beliefs underlie optimal behavior. In particular, we consider prior beliefs that action minimizes the Kullback-Leibler (KL) divergence between desired states and attainable states in the future. This allows one to formulate bounded rationality as approximate Bayesian inference that optimizes a free energy bound on model evidence. We show that constructs like expected utility, exploration bonuses, softmax choice rules and optimism bias emerge as natural consequences of this formulation. Previous accounts of active inference have focused on predictive coding and Bayesian filtering schemes for minimizing free energy. Here, we consider variational Bayes as an alternative scheme that provides formal constraints on the computational anatomy of inference and action-constraints that are remarkably consistent with neuroanatomy. Furthermore, this scheme contextualizes optimal decision theory and economic (utilitarian) formulations as pure inference problems. For example, expected utility theory emerges as a special case of free energy minimization, where the sensitivity or inverse temperature (of softmax functions and quantal response equilibria) has a unique and Bayes-optimal solution-that minimizes free energy. This sensitivity corresponds to the precision of beliefs about behavior, such that attainable goals are afforded a higher precision or confidence. In turn, this means that optimal behavior entails a representation of confidence about outcomes that are under an agent's control.
Overview
AI snapshot
Written from the paper’s full text.
TL;DR
This theoretical paper recasts agency and choice as active inference, where prior beliefs about control minimize the KL divergence between attainable and desired future states. It shows that expected utility, exploration bonuses, softmax choice rules, optimism bias, temporal discounting, and marginal utility emerge from variational free-energy minimization.
Key findings
- Agency is modeled as prior beliefs that action minimizes the divergence between distributions over final states and goal states; value decomposes into an entropy/exploration bonus plus expected utility (Equation 4).
- Precision or inverse temperature is not a free parameter but is optimized as a sufficient statistic of beliefs about policies; this yields softmax choice rules and quantal response equilibria as consequences of free-energy minimization.
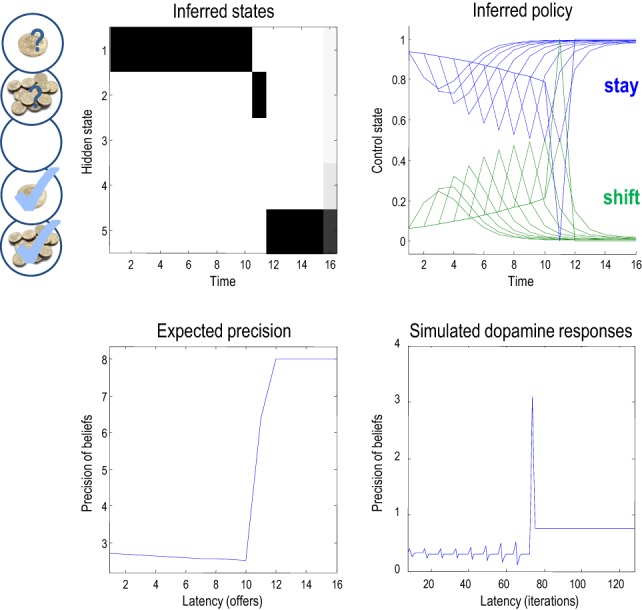
- In a simulated 16-trial “limited offer” game with two control states (reject/accept) and five hidden states, the agent accepted a high offer after it replaced a low offer on the 11th trial; expected precision rose markedly after the high offer and remained at its maximum value of eight.
- Temporal discounting and a convex marginal utility relationship emerge from Bayes-optimal inference under time-sensitive contingencies; the paper reports prior utility vector σ([1,1,1,2,4]ᵀ), meaning the high offer is believed accepted exp(4−2)=7.39 times more than the low offer, and the low offer exp(2−1)=2.718 times more likely than neither.
Methods
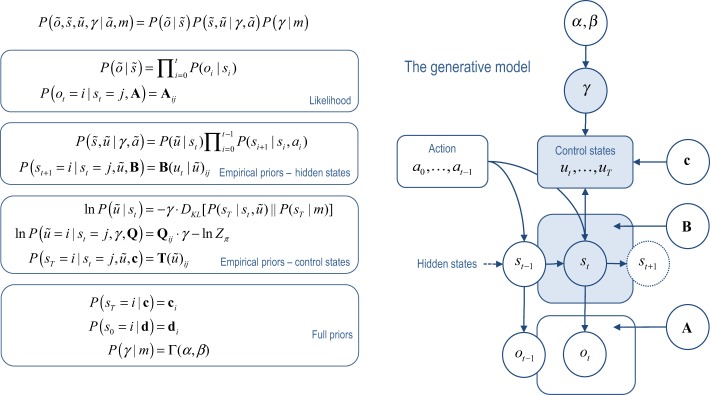
- Theoretical/computational modeling: active inference is formalized with a Markovian generative model over hidden states, control states, and precision, inverted using variational Bayes under a mean-field assumption.
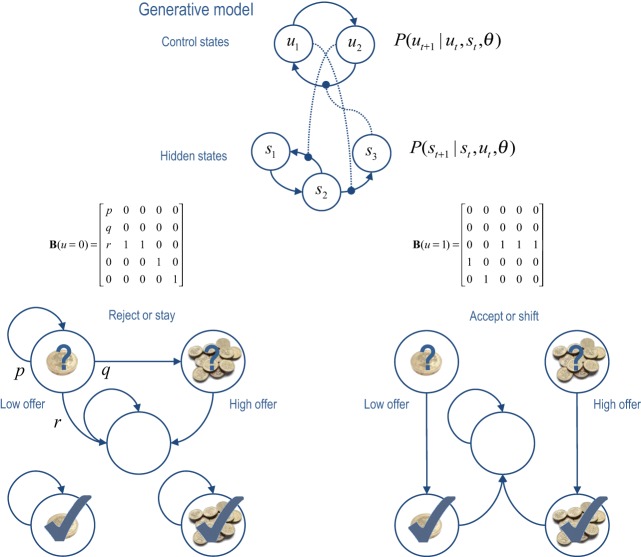
- Simulation: a limited-offer game with T=16 trials, two control states (reject/stay or accept/shift), five hidden states (low offer, high offer, no offer, accepted low offer, accepted high offer), identity sensory mapping A=I, and gamma prior over precision with α=8 and β=1.
- Main analysis: iterated variational updates for expected hidden states, policies, and precision; simulated choice behavior and precision dynamics are compared with softmax/QRE formulations and dopaminergic responses.
Limitations
- The paper states that using discrete-time variational Bayes instead of continuous-time predictive coding “necessarily implies a loss of biological realism,” although it provides an explicit model of discrete choices.
- The paper states that the mean-field factorization with respect to precision is an approximation because the true posterior will show mild conditional dependencies between precision and hidden states.
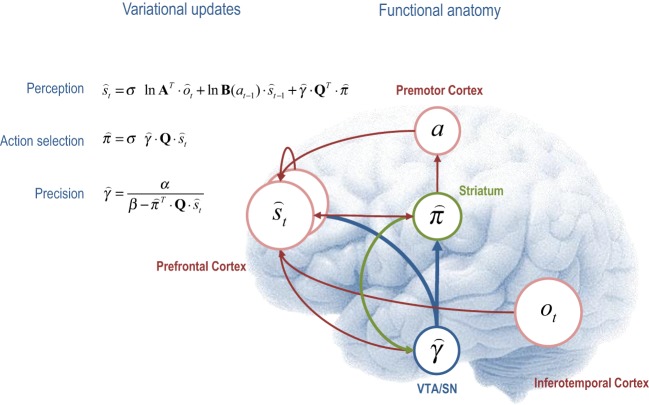
- The paper states that neurobiological plausibility of variational message passing remains an open question and that proper validation of active inference will require careful model comparison using empirical choice behaviors and detailed mapping between model variables and neuronal correlates; the functional anatomy in Figure 4 is described as “purely iconic” and “should not be taken too seriously.”
Model-written summary. Check it against the paper before relying on it.
Integrity signals
Registry
Cites
Statistics
Figures
Verification
Claims the paper makes
139 Own interpretation · 35 Not checked yet · 30 No basis given · 12 Own result · 1 Own method
The paper states this without a source or data behind it here, so there is nothing to check it against. The quote shows it is in the paper.
In the paper
“Equation 4 shows that value can be decomposed into terms. The first is the entropy (intrinsic reward) of the distribution over final states, given the current state and policy. The second is the expected utility of the final state, where utility (extrinsic reward) or negative cost is the log probability of the final state, under the prior goals c(sT|m) = ln P(sT|m).”
§ The anatomy of choice: active inference and agency > A generative model of agency > Prior beliefs, entropy and expected utility
plain- Asserted: passes — The authors put it forward as true.
- Checkable: passes — It can be checked against evidence.
- Load-bearing: passes — The paper’s conclusions depend on it.
- Based: passes — The paper gives a reason why it holds.
The paper states this without a source or data behind it here, so there is nothing to check it against. The quote shows it is in the paper.
In the paper
“In terms of the updates themselves, the expectations of hidden states and policies are softmax functions of mixtures of the other expectations.”
§ The anatomy of choice: active inference and agency > The functional anatomy of decision-making
plaindirect- Asserted: passes — The authors put it forward as true.
- Checkable: passes — It can be checked against evidence.
- Load-bearing: passes — The paper’s conclusions depend on it.
- Based: passes — The paper gives a reason why it holds.
The paper states this without a source or data behind it here, so there is nothing to check it against. The quote shows it is in the paper.
In the paper
“The first variational step updates beliefs about the current state of the world using observed outcomes and representations of the preceding state.”
§ The anatomy of choice: active inference and agency > The functional anatomy of decision-making > Perception
plaindirect- Asserted: passes — The authors put it forward as true.
- Checkable: passes — It can be checked against evidence.
- Load-bearing: passes — The paper’s conclusions depend on it.
- Based: passes — The paper gives a reason why it holds.
The paper states this without a source or data behind it here, so there is nothing to check it against. The quote shows it is in the paper.
In the paper
“However, there is a third term that corresponds to expected value of each state, averaged over policies.”
§ The anatomy of choice: active inference and agency > The functional anatomy of decision-making > Perception
plain- Asserted: passes — The authors put it forward as true.
- Checkable: passes — It can be checked against evidence.
- Load-bearing: passes — The paper’s conclusions depend on it.
- Based: passes — The paper gives a reason why it holds.
In the paper
“It is straightforward to show (Beal, 2003) that the marginal distributions Q(ψi |μi) that minimize free energy can be expressed in terms of the variational energies V(ψi) of each subset:”
§ The anatomy of choice: active inference and agency > Variational bayesian inversion > Variational updates
What the sources say
- Not checked yetcites Beal, 2003
plaincorrelational- Asserted: passes — The authors put it forward as true.
- Checkable: passes — It can be checked against evidence.
- Load-bearing: passes — The paper’s conclusions depend on it.
- Based: passes — The paper gives a reason why it holds.
The paper states this without a source or data behind it here, so there is nothing to check it against. The quote shows it is in the paper.
In the paper
“This allows one to reduce the number of sufficient statistics for policies from KT to (K − 1) × T by only allowing policies in which a choice uτ > 1 is made at t = τ and ut = 1 otherwise.”
§ The anatomy of choice: active inference and agency > Variational bayesian inversion > Approximate bayesian inference
plaindirect- Asserted: passes — The authors put it forward as true.
- Checkable: passes — It can be checked against evidence.
- Load-bearing: passes — The paper’s conclusions depend on it.
- Based: passes — The paper gives a reason why it holds.
The paper states this without a source or data behind it here, so there is nothing to check it against. The quote shows it is in the paper.
In the paper
“Furthermore, the softmax functions are of linear mixtures of sufficient statistics (neuronal activity) with one key exception; namely, the modulation by precision when updating beliefs about the current state of the world and selecting the next action.”
§ The anatomy of choice: active inference and agency > The functional anatomy of decision-making
plain- Asserted: passes — The authors put it forward as true.
- Checkable: passes — It can be checked against evidence.
- Load-bearing: passes — The paper’s conclusions depend on it.
- Based: passes — The paper gives a reason why it holds.
The paper states this without a source or data behind it here, so there is nothing to check it against. The quote shows it is in the paper.
In the paper
“In other words, there are two expected values, one for action Q · s⌢ and one for perception QT · π⌢.”
§ The anatomy of choice: active inference and agency > The functional anatomy of decision-making > Action selection
plain- Asserted: passes — The authors put it forward as true.
- Checkable: passes — It can be checked against evidence.
- Load-bearing: passes — The paper’s conclusions depend on it.
- Based: passes — The paper gives a reason why it holds.
The paper states this without a source or data behind it here, so there is nothing to check it against. The quote shows it is in the paper.
In the paper
“The second variational update is a softmax function of the expected value of competing choices under the current state.”
§ The anatomy of choice: active inference and agency > The functional anatomy of decision-making > Action selection
plaindirect- Asserted: passes — The authors put it forward as true.
- Checkable: passes — It can be checked against evidence.
- Load-bearing: passes — The paper’s conclusions depend on it.
- Based: passes — The paper gives a reason why it holds.
The paper states this without a source or data behind it here, so there is nothing to check it against. The quote shows it is in the paper.
In the paper
“The final variational step estimates the precision of prior beliefs about policies, using posterior expectations about hidden states and choices.”
§ The anatomy of choice: active inference and agency > The functional anatomy of decision-making > Evaluating precision
plaindirect- Asserted: passes — The authors put it forward as true.
- Checkable: passes — It can be checked against evidence.
- Load-bearing: passes — The paper’s conclusions depend on it.
- Based: passes — The paper gives a reason why it holds.
The paper states this without a source or data behind it here, so there is nothing to check it against. The quote shows it is in the paper.
In the paper
“Mathematically, value can never be greater than zero (because the KL divergence is always non-negative).”
§ The anatomy of choice: active inference and agency > The functional anatomy of decision-making > Evaluating precision
plain- Asserted: passes — The authors put it forward as true.
- Checkable: passes — It can be checked against evidence.
- Load-bearing: passes — The paper’s conclusions depend on it.
- Based: passes — The paper gives a reason why it holds.
A result the paper reports from its own data — it cites no other source for it, so there is none to check. The quote shows it is in the paper.
In the paper
“The interesting thing here is that prior to the high offer, the agent believes that it will accept the low offer three or four trials in the future.”
§ The anatomy of choice: active inference and agency > Decision-making under uncertainty
plainSingle case- Asserted: passes — The authors put it forward as true.
- Checkable: passes — It can be checked against evidence.
- Load-bearing: unclear — It is unclear whether the paper’s conclusions depend on it.
- Based: passes — The paper gives a reason why it holds.
The paper states this without a source or data behind it here, so there is nothing to check it against. The quote shows it is in the paper.
In the paper
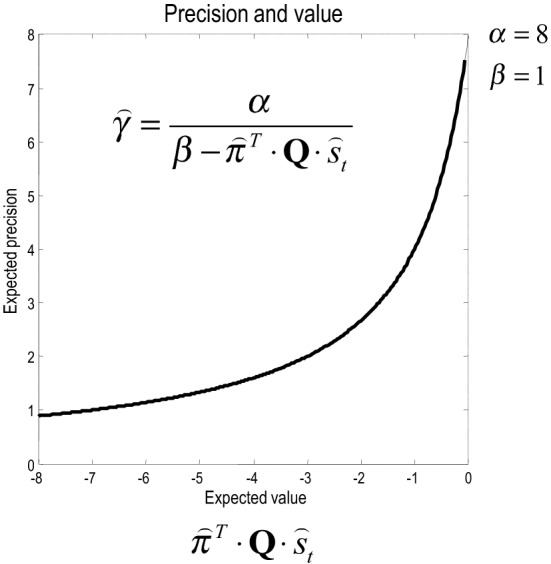
“Inspection of the update for expected precision shows that it is an increasing asymptotic function of value, expected under current beliefs about states and choices (see Figure 5).”
§ The anatomy of choice: active inference and agency > The functional anatomy of decision-making > Evaluating precision
plaindirect- Asserted: passes — The authors put it forward as true.
- Checkable: passes — It can be checked against evidence.
- Load-bearing: passes — The paper’s conclusions depend on it.
- Based: passes — The paper gives a reason why it holds.
A result the paper reports from its own data — it cites no other source for it, so there is none to check. The quote shows it is in the paper.
In the paper
“The resulting updates are quite revealing and show phasic responses to the arrival of new sensory information that converge to tonic values, which minimize free energy.”
§ The anatomy of choice: active inference and agency > Decision-making under uncertainty
plaindirect- Asserted: passes — The authors put it forward as true.
- Checkable: passes — It can be checked against evidence.
- Load-bearing: unclear — It is unclear whether the paper’s conclusions depend on it.
- Based: passes — The paper gives a reason why it holds.
The paper states this without a source or data behind it here, so there is nothing to check it against. The quote shows it is in the paper.
In the paper
“This means that precision increases to its upper bound of α, when value increases to zero (see Figure 5).”
§ The anatomy of choice: active inference and agency > The functional anatomy of decision-making > Evaluating precision
plaindirect- Asserted: passes — The authors put it forward as true.
- Checkable: passes — It can be checked against evidence.
- Load-bearing: passes — The paper’s conclusions depend on it.
- Based: passes — The paper gives a reason why it holds.
The paper states this without a source or data behind it here, so there is nothing to check it against. The quote shows it is in the paper.
In the paper
“Notice that there is still an increasing propensity to accept, even though the agent knows that accepting is futile.”
§ The anatomy of choice: active inference and agency > Decision-making under uncertainty
plaindirect- Asserted: passes — The authors put it forward as true.
- Checkable: passes — It can be checked against evidence.
- Load-bearing: unclear — It is unclear whether the paper’s conclusions depend on it.
- Based: passes — The paper gives a reason why it holds.
A result the paper reports from its own data — it cites no other source for it, so there is none to check. The quote shows it is in the paper.
In the paper
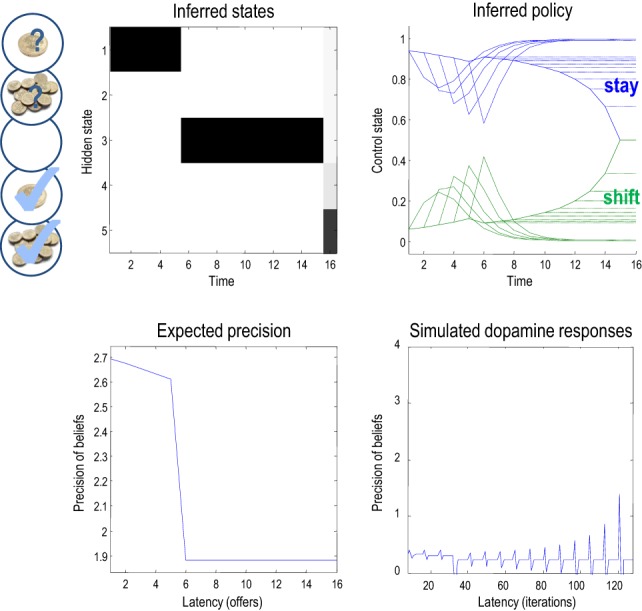
“Figure 7 shows the results of this simulation, where the expected control states and precision are exactly the same as in the previous simulation, until the offer is withdrawn.”
§ The anatomy of choice: active inference and agency > Decision-making under uncertainty
plain- Asserted: passes — The authors put it forward as true.
- Checkable: passes — It can be checked against evidence.
- Load-bearing: unclear — It is unclear whether the paper’s conclusions depend on it.
- Based: passes — The paper gives a reason why it holds.
A result the paper reports from its own data — it cites no other source for it, so there is none to check. The quote shows it is in the paper.
In the paper
“The expected precision of these posterior beliefs is shown in the lower left panel and declines gently until the high offer is made.”
§ The anatomy of choice: active inference and agency > Decision-making under uncertainty
plaindirect- Asserted: passes — The authors put it forward as true.
- Checkable: passes — It can be checked against evidence.
- Load-bearing: unclear — It is unclear whether the paper’s conclusions depend on it.
- Based: passes — The paper gives a reason why it holds.
A result the paper reports from its own data — it cites no other source for it, so there is none to check. The quote shows it is in the paper.
In the paper
“Furthermore, the propensity to accept (in the future) increases as time goes on (see dotted lines).”
§ The anatomy of choice: active inference and agency > Decision-making under uncertainty
plaindirectSingle case- Asserted: passes — The authors put it forward as true.
- Checkable: passes — It can be checked against evidence.
- Load-bearing: unclear — It is unclear whether the paper’s conclusions depend on it.
- Based: passes — The paper gives a reason why it holds.
The paper states this without a source or data behind it here, so there is nothing to check it against. The quote shows it is in the paper.
In the paper
“At this point, the agent moves to the no-offer state and remains there until the end of the game.”
§ The anatomy of choice: active inference and agency > Decision-making under uncertainty
plaindirect- Asserted: passes — The authors put it forward as true.
- Checkable: passes — It can be checked against evidence.
- Load-bearing: unclear — It is unclear whether the paper’s conclusions depend on it.
- Based: passes — The paper gives a reason why it holds.
The paper states this without a source or data behind it here, so there is nothing to check it against. The quote shows it is in the paper.
In the paper
“In this instance, precision falls at the point the offer is withdrawn and remains low until the last trial.”
§ The anatomy of choice: active inference and agency > Decision-making under uncertainty
plaindirect- Asserted: passes — The authors put it forward as true.
- Checkable: passes — It can be checked against evidence.
- Load-bearing: unclear — It is unclear whether the paper’s conclusions depend on it.
- Based: passes — The paper gives a reason why it holds.
A result the paper reports from its own data — it cites no other source for it, so there is none to check. The quote shows it is in the paper.
In the paper
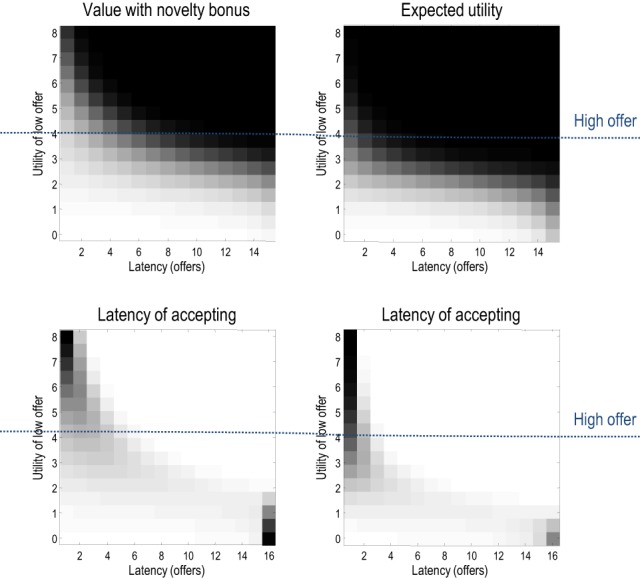
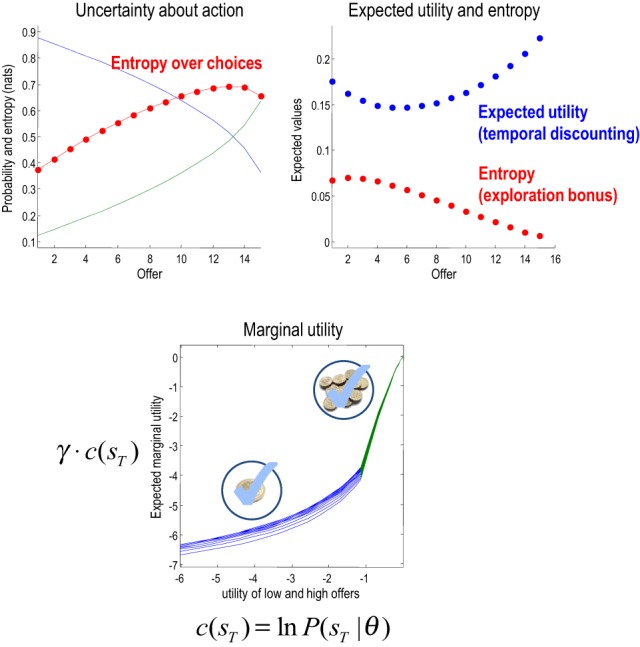
“One can see that this uncertainty increases as the propensity to accept increases.”
§ The anatomy of choice: active inference and agency > Temporal discounting and marginal utility
plaindirect- Asserted: passes — The authors put it forward as true.
- Checkable: passes — It can be checked against evidence.
- Load-bearing: unclear — It is unclear whether the paper’s conclusions depend on it.
- Based: passes — The paper gives a reason why it holds.
The paper states this without a source or data behind it here, so there is nothing to check it against. The quote shows it is in the paper.
In the paper
“Conversely, the marginal utility of the low offer decreases more slowly as the utility of the low offer falls.”
§ The anatomy of choice: active inference and agency > Temporal discounting and marginal utility > Marginal utility and precision
plaindirect- Asserted: passes — The authors put it forward as true.
- Checkable: passes — It can be checked against evidence.
- Load-bearing: unclear — It is unclear whether the paper’s conclusions depend on it.
- Based: passes — The paper gives a reason why it holds.
The paper states this without a source or data behind it here, so there is nothing to check it against. The quote shows it is in the paper.
In the paper
“Note that including the entropy in value slightly delays the time to choice—to ensure a greater latitude of options.”
- Also stated in: § Temporal discounting and marginal utility · plain
“Here, one sees a slight increase in the latency when value includes the entropy term.”
§ The anatomy of choice: active inference and agency > Temporal discounting and marginal utility
plaindirect- Asserted: passes — The authors put it forward as true.
- Checkable: passes — It can be checked against evidence.
- Load-bearing: unclear — It is unclear whether the paper’s conclusions depend on it.
- Based: passes — The paper gives a reason why it holds.
- Also stated in: § Temporal discounting and marginal utility · plain
A result the paper reports from its own data — it cites no other source for it, so there is none to check. The quote shows it is in the paper.
In the paper
“When the agent has in mind a 50–50 probability of accepting, the entropy peaks, shortly before the last offer.”
§ The anatomy of choice: active inference and agency > Temporal discounting and marginal utility
plaincorrelational- Asserted: passes — The authors put it forward as true.
- Checkable: passes — It can be checked against evidence.
- Load-bearing: unclear — It is unclear whether the paper’s conclusions depend on it.
- Based: passes — The paper gives a reason why it holds.
A result the paper reports from its own data — it cites no other source for it, so there is none to check. The quote shows it is in the paper.
In the paper
“The key result here is the time-dependent change in expected utility, which corresponds to temporal discounting of the expected utility: i.e., the expected utility of the final state is greater when there are fewer intervening trials.”
§ The anatomy of choice: active inference and agency > Temporal discounting and marginal utility
plaindirect- Asserted: passes — The authors put it forward as true.
- Checkable: passes — It can be checked against evidence.
- Load-bearing: passes — The paper’s conclusions depend on it.
- Based: passes — The paper gives a reason why it holds.
The paper states this without a source or data behind it here, so there is nothing to check it against. The quote shows it is in the paper.
In the paper
“This is particularly noticeable in the ambiguous situation when the low offer has the same utility as the high offer (of four).”
§ The anatomy of choice: active inference and agency > Temporal discounting and marginal utility
plaindirect- Asserted: passes — The authors put it forward as true.
- Checkable: passes — It can be checked against evidence.
- Load-bearing: unclear — It is unclear whether the paper’s conclusions depend on it.
- Based: passes — The paper gives a reason why it holds.
A result the paper reports from its own data — it cites no other source for it, so there is none to check. The quote shows it is in the paper.
In the paper
“The entropy (red) and expected utility (blue) underlying these choices are shown in the right panel and demonstrate—in this example—a complementary dependency on time.”
- Also stated in: § Temporal discounting and marginal utility · plain
“As time progresses, the expected utility first falls and then increases, while the entropy does the converse.”
§ The anatomy of choice: active inference and agency > Temporal discounting and marginal utility
boostedcorrelational- Asserted: passes — The authors put it forward as true.
- Checkable: passes — It can be checked against evidence.
- Load-bearing: unclear — It is unclear whether the paper’s conclusions depend on it.
- Based: passes — The paper gives a reason why it holds.
- Also stated in: § Temporal discounting and marginal utility · plain
A conclusion the paper draws from its own results — it cites no other source for it, so there is none to check. The quote shows it is in the paper.
In the paper
“Crucially, in active inference, parameters like sensitivity or inverse temperature must themselves minimize free energy.”
§ The anatomy of choice: active inference and agency > Introduction
plaindirect- Asserted: passes — The authors put it forward as true.
- Checkable: passes — It can be checked against evidence.
- Load-bearing: passes — The paper’s conclusions depend on it.
- Based: unclear — It is unclear why the paper says it holds.
A conclusion the paper draws from its own results — it cites no other source for it, so there is none to check. The quote shows it is in the paper.
In the paper
“This behavior is equivalent to minimizing the Shannon entropy of the distribution over the outcomes they experience.”
§ The anatomy of choice: active inference and agency > Active inference > The free-energy principle and active inference
plaincorrelational- Asserted: passes — The authors put it forward as true.
- Checkable: passes — It can be checked against evidence.
- Load-bearing: passes — The paper’s conclusions depend on it.
- Based: passes — The paper gives a reason why it holds.
In the paper
“The free-energy principle (Friston et al., 2006) tries to explain how agents restrict themselves to a small number of attracting states.”
§ The anatomy of choice: active inference and agency > Active inference > The free-energy principle and active inference
What the sources say
- Not checked yetcites Friston et al., 2006
plaindirect- Asserted: passes — The authors put it forward as true.
- Checkable: passes — It can be checked against evidence.
- Load-bearing: passes — The paper’s conclusions depend on it.
- Based: passes — The paper gives a reason why it holds.
In the paper
“Under ergodic assumptions, this entropy is (almost surely) the long-term time average of self-information or surprise (Birkhoff, 1931).”
§ The anatomy of choice: active inference and agency > Active inference > The free-energy principle and active inference
What the sources say
- Not checked yetcites Birkhoff, 1931
plaincorrelational- Asserted: passes — The authors put it forward as true.
- Checkable: passes — It can be checked against evidence.
- Load-bearing: passes — The paper’s conclusions depend on it.
- Based: passes — The paper gives a reason why it holds.
A conclusion the paper draws from its own results — it cites no other source for it, so there is none to check. The quote shows it is in the paper.
In the paper
“In particular, we consider prior beliefs that action minimizes the Kullback–Leibler (KL) divergence between desired states and attainable states in the future. This allows one to formulate bounded rationality as approximate Bayesian inference that optimizes a free energy bound on model evidence.”
§ The anatomy of choice: active inference and agency > Abstract
plaindirect- Asserted: passes — The authors put it forward as true.
- Checkable: passes — It can be checked against evidence.
- Load-bearing: passes — The paper’s conclusions depend on it.
- Based: passes — The paper gives a reason why it holds.
- The authors state this as an assumption: Policies are selected under the prior belief that they minimize the divergence, or relative entropy, between a probability distribution over states that can be reached and states agents believe they should occupy, which are states or goals believed a priori to have high utility.
A conclusion the paper draws from its own results — it cites no other source for it, so there is none to check. The quote shows it is in the paper.
In the paper
“Furthermore, QRE, logit choice models and softmax rules can be derived as formal consequences of free energy minimization, using variational Bayes.”
§ The anatomy of choice: active inference and agency > Introduction
plaindirect- Asserted: passes — The authors put it forward as true.
- Checkable: passes — It can be checked against evidence.
- Load-bearing: passes — The paper’s conclusions depend on it.
- Based: unclear — It is unclear why the paper says it holds.
A conclusion the paper draws from its own results — it cites no other source for it, so there is none to check. The quote shows it is in the paper.
In the paper
“Here, we consider variational Bayes as an alternative scheme that provides formal constraints on the computational anatomy of inference and action—constraints that are remarkably consistent with neuroanatomy.”
§ The anatomy of choice: active inference and agency > Abstract
plaincorrelational- Asserted: passes — The authors put it forward as true.
- Checkable: passes — It can be checked against evidence.
- Load-bearing: passes — The paper’s conclusions depend on it.
- Based: unclear — It is unclear why the paper says it holds.
A conclusion the paper draws from its own results — it cites no other source for it, so there is none to check. The quote shows it is in the paper.
In the paper
“In turn, this means that optimal behavior entails a representation of confidence about outcomes that are under an agent's control.”
§ The anatomy of choice: active inference and agency > Abstract
plaindirect- Asserted: passes — The authors put it forward as true.
- Checkable: passes — It can be checked against evidence.
- Load-bearing: passes — The paper’s conclusions depend on it.
- Based: passes — The paper gives a reason why it holds.
A conclusion the paper draws from its own results — it cites no other source for it, so there is none to check. The quote shows it is in the paper.
In the paper
“We show that constructs like expected utility, exploration bonuses, softmax choice rules and optimism bias emerge as natural consequences of this formulation.”
§ The anatomy of choice: active inference and agency > Abstract
boosteddirect- Asserted: passes — The authors put it forward as true.
- Checkable: passes — It can be checked against evidence.
- Load-bearing: passes — The paper’s conclusions depend on it.
- Based: passes — The paper gives a reason why it holds.
A conclusion the paper draws from its own results — it cites no other source for it, so there is none to check. The quote shows it is in the paper.
In the paper
“This means that sensitivity ceases to be a free parameter that is adjusted to describe observed behavior and becomes diagnostic of the underlying (approximate) Bayesian inference (that can be disclosed by observed choices).”
§ The anatomy of choice: active inference and agency > Introduction
plaincorrelational- Asserted: passes — The authors put it forward as true.
- Checkable: passes — It can be checked against evidence.
- Load-bearing: passes — The paper’s conclusions depend on it.
- Based: passes — The paper gives a reason why it holds.
A conclusion the paper draws from its own results — it cites no other source for it, so there is none to check. The quote shows it is in the paper.
In the paper
“For example, expected utility theory emerges as a special case of free energy minimization, where the sensitivity or inverse temperature (of softmax functions and quantal response equilibria) has a unique and Bayes-optimal solution—that minimizes free energy.”
§ The anatomy of choice: active inference and agency > Abstract
plaindirect- Asserted: passes — The authors put it forward as true.
- Checkable: passes — It can be checked against evidence.
- Load-bearing: passes — The paper’s conclusions depend on it.
- Based: passes — The paper gives a reason why it holds.
None of the sources cited for this claim have been checked yet.
In the paper
“The free energy minimization considered in this paper can be regarded as a special case of their general formulation, where the utility function is the log-likelihood of outcomes and their causes, under a generative model.”
§ The anatomy of choice: active inference and agency > Introduction
What the sources say
- Not checked yetcites Braun et al., 2011
- Not checked yetcites Ortega and Braun, 2011
plain- Asserted: passes — The authors put it forward as true.
- Checkable: passes — It can be checked against evidence.
- Load-bearing: passes — The paper’s conclusions depend on it.
- Based: passes — The paper gives a reason why it holds.
A conclusion the paper draws from its own results — it cites no other source for it, so there is none to check. The quote shows it is in the paper.
In the paper
“In the present context, an intrinsically rewarding policy maximizes the opportunity to explore (or the entropy of) future states.”
§ The anatomy of choice: active inference and agency > Introduction
plaindirect- Asserted: passes — The authors put it forward as true.
- Checkable: passes — It can be checked against evidence.
- Load-bearing: passes — The paper’s conclusions depend on it.
- Based: passes — The paper gives a reason why it holds.
None of the sources cited for this claim have been checked yet.
In the paper
“This value has exactly the same form as the objective functions in KL control schemes that grandfather conventional utility-based schemes (Kappen et al., 2012; Ortega and Braun, 2011).”
§ The anatomy of choice: active inference and agency > A generative model of agency > Exploration, exploitation and novelty
What the sources say
- Not checked yetcites Kappen et al., 2012
- Not checked yetcites Ortega and Braun, 2011
plain- Asserted: passes — The authors put it forward as true.
- Checkable: passes — It can be checked against evidence.
- Load-bearing: unclear — It is unclear whether the paper’s conclusions depend on it.
- Based: passes — The paper gives a reason why it holds.
A conclusion the paper draws from its own results — it cites no other source for it, so there is none to check. The quote shows it is in the paper.
In the paper
“All we have done here is to equip agents with a sense of agency or prior beliefs that they are KL optimal. These beliefs are then enacted through active inference. The advantage of this is that the precision of beliefs about control can now be optimized—because we have effectively cast the optimal control problem as an inference problem.”
§ The anatomy of choice: active inference and agency > A generative model of agency > Prior beliefs, entropy and expected utility
plaindirect- Asserted: passes — The authors put it forward as true.
- Checkable: passes — It can be checked against evidence.
- Load-bearing: passes — The paper’s conclusions depend on it.
- Based: passes — The paper gives a reason why it holds.
- The authors state this as an assumption: Policies are selected under the prior belief that they minimize the divergence, or relative entropy, between a probability distribution over states that can be reached and states agents believe they should occupy, which are states or goals believed a priori to have high utility.
A conclusion the paper draws from its own results — it cites no other source for it, so there is none to check. The quote shows it is in the paper.
In the paper
“It is therefore sufficient to minimize surprise—at each point in time—to minimize its time average or Shannon entropy.”
§ The anatomy of choice: active inference and agency > Active inference > The free-energy principle and active inference
plaindirect- Asserted: passes — The authors put it forward as true.
- Checkable: passes — It can be checked against evidence.
- Load-bearing: passes — The paper’s conclusions depend on it.
- Based: passes — The paper gives a reason why it holds.
In the paper
“The second equality shows that free energy is an upper bound on surprise, because the first relative entropy or Kullback–Leibler (KL) divergence term is non-negative by Gibbs inequality (Beal, 2003).”
§ The anatomy of choice: active inference and agency > Active inference > The free-energy principle and active inference
What the sources say
- Not checked yetcites Beal, 2003
plaindirect- Asserted: passes — The authors put it forward as true.
- Checkable: passes — It can be checked against evidence.
- Load-bearing: passes — The paper’s conclusions depend on it.
- Based: passes — The paper gives a reason why it holds.
A conclusion the paper draws from its own results — it cites no other source for it, so there is none to check. The quote shows it is in the paper.
In the paper
“This means minimizing free energy corresponds to minimizing the divergence between the approximate and true posterior.”
§ The anatomy of choice: active inference and agency > Active inference > The free-energy principle and active inference
plaindirect- Asserted: passes — The authors put it forward as true.
- Checkable: passes — It can be checked against evidence.
- Load-bearing: passes — The paper’s conclusions depend on it.
- Based: passes — The paper gives a reason why it holds.
A conclusion the paper draws from its own results — it cites no other source for it, so there is none to check. The quote shows it is in the paper.
In the paper
“Crucially, this requires agents to entertain beliefs about the control of state transitions producing outcomes.”
§ The anatomy of choice: active inference and agency > Active inference > The free-energy principle and active inference
plain- Asserted: passes — The authors put it forward as true.
- Checkable: passes — It can be checked against evidence.
- Load-bearing: passes — The paper’s conclusions depend on it.
- Based: passes — The paper gives a reason why it holds.
A conclusion the paper draws from its own results — it cites no other source for it, so there is none to check. The quote shows it is in the paper.
In the paper
“Unlike classic reward prediction errors, this probabilistic prediction error is a difference between probability distributions over states.”
§ The anatomy of choice: active inference and agency > A generative model of agency > Prior beliefs, entropy and expected utility
plain- Asserted: passes — The authors put it forward as true.
- Checkable: passes — It can be checked against evidence.
- Load-bearing: passes — The paper’s conclusions depend on it.
- Based: passes — The paper gives a reason why it holds.
A conclusion the paper draws from its own results — it cites no other source for it, so there is none to check. The quote shows it is in the paper.
In the paper
“This describes prior beliefs about control sequences or policies that determine which actions are selected.”
§ The anatomy of choice: active inference and agency > A generative model of agency > The generative model
plaindirect- Asserted: passes — The authors put it forward as true.
- Checkable: passes — It can be checked against evidence.
- Load-bearing: passes — The paper’s conclusions depend on it.
- Based: passes — The paper gives a reason why it holds.
None of the sources cited for this claim have been checked yet.
In the paper
“The proxy is variational free energy that, by construction, is an upper bound on surprise (Feynman, 1972; Hinton and van Camp, 1993).”
§ The anatomy of choice: active inference and agency > Active inference > The free-energy principle and active inference
What the sources say
- Not checked yetcites Feynman, 1972
- Not checked yetcites Hinton and van Camp, 1993
plaindirect- Asserted: passes — The authors put it forward as true.
- Checkable: passes — It can be checked against evidence.
- Load-bearing: passes — The paper’s conclusions depend on it.
- Based: passes — The paper gives a reason why it holds.
A conclusion the paper draws from its own results — it cites no other source for it, so there is none to check. The quote shows it is in the paper.
In the paper
“The entropy term implies that (beliefs about) choices are driven not just to maximize expected value but to explore all options in a way that confers an exploratory aspect on behavior.”
§ The anatomy of choice: active inference and agency > A generative model of agency > Exploration, exploitation and novelty
plaindirect- Asserted: passes — The authors put it forward as true.
- Checkable: passes — It can be checked against evidence.
- Load-bearing: passes — The paper’s conclusions depend on it.
- Based: passes — The paper gives a reason why it holds.
A conclusion the paper draws from its own results — it cites no other source for it, so there is none to check. The quote shows it is in the paper.
In the paper
“In summary, if agents occupy a limited set of attracting states, it follows that their generative models must be equipped with prior beliefs that controlled state transitions will minimize the divergence between a distribution over attainable states and a distribution that specifies states as attractive.”
§ The anatomy of choice: active inference and agency > A generative model of agency > Exploration, exploitation and novelty
plaindirect- Asserted: passes — The authors put it forward as true.
- Checkable: passes — It can be checked against evidence.
- Load-bearing: passes — The paper’s conclusions depend on it.
- Based: passes — The paper gives a reason why it holds.
A conclusion the paper draws from its own results — it cites no other source for it, so there is none to check. The quote shows it is in the paper.
In the paper
“In the absence of (or change in) beliefs about ultimate states, there will be a bias toward visiting all (low cost) states with equal probability.”
§ The anatomy of choice: active inference and agency > A generative model of agency > Exploration, exploitation and novelty
plaindirect- Asserted: passes — The authors put it forward as true.
- Checkable: passes — It can be checked against evidence.
- Load-bearing: passes — The paper’s conclusions depend on it.
- Based: passes — The paper gives a reason why it holds.
A conclusion the paper draws from its own results — it cites no other source for it, so there is none to check. The quote shows it is in the paper.
In the paper
“In summary, if agents resist a natural tendency to disorder (occupy a limited number of characteristic states), then they become implicit Bayesian modelers of their environment.”
§ The anatomy of choice: active inference and agency > Active inference > The free-energy principle and active inference
plaindirect- Asserted: passes — The authors put it forward as true.
- Checkable: passes — It can be checked against evidence.
- Load-bearing: passes — The paper’s conclusions depend on it.
- Based: passes — The paper gives a reason why it holds.
A conclusion the paper draws from its own results — it cites no other source for it, so there is none to check. The quote shows it is in the paper.
In the paper
“However, to evaluate surprise it is necessary to marginalize over the hidden causes of outcomes.”
§ The anatomy of choice: active inference and agency > Active inference > The free-energy principle and active inference
plaindirect- Asserted: passes — The authors put it forward as true.
- Checkable: passes — It can be checked against evidence.
- Load-bearing: passes — The paper’s conclusions depend on it.
- Based: passes — The paper gives a reason why it holds.
A conclusion the paper draws from its own results — it cites no other source for it, so there is none to check. The quote shows it is in the paper.
In the paper
“The relative entropy or divergence can be thought of as a prediction error that is nuanced in an important way: it reports the mismatch—not between expected and observed outcomes—but between the final outcomes expected with and without considering the current state: in other words, the difference between what can be attained from the current state and the goals encoded by prior beliefs.”
§ The anatomy of choice: active inference and agency > A generative model of agency > Prior beliefs, entropy and expected utility
plaincorrelational- Asserted: passes — The authors put it forward as true.
- Checkable: passes — It can be checked against evidence.
- Load-bearing: passes — The paper’s conclusions depend on it.
- Based: passes — The paper gives a reason why it holds.
In the paper
“Similarly, the novelty bonus (Kakade and Dayan, 2002) of a new state is, in this formulation, conferred by the opportunity to access states that were previously unavailable—thereby increasing the entropy over final states.”
§ The anatomy of choice: active inference and agency > A generative model of agency > Exploration, exploitation and novelty
What the sources say
- Not checked yetcites Kakade and Dayan, 2002
plaindirect- Asserted: passes — The authors put it forward as true.
- Checkable: passes — It can be checked against evidence.
- Load-bearing: unclear — It is unclear whether the paper’s conclusions depend on it.
- Based: passes — The paper gives a reason why it holds.
In the paper
“Conversely, with imprecise (flat) prior beliefs that all final states are equally valuable, the agent will try to keep its options open and maximize the entropy over those states: in other words, it will explore according to the maximum entropy principle (Jaynes, 1957).”
§ The anatomy of choice: active inference and agency > A generative model of agency > Exploration, exploitation and novelty
What the sources say
- Not checked yetcites Jaynes, 1957
plaindirect- Asserted: passes — The authors put it forward as true.
- Checkable: passes — It can be checked against evidence.
- Load-bearing: passes — The paper’s conclusions depend on it.
- Based: passes — The paper gives a reason why it holds.
A conclusion the paper draws from its own results — it cites no other source for it, so there is none to check. The quote shows it is in the paper.
In the paper
“These prior beliefs can be expressed in terms of relative entropy that defines the value of policies.”
§ The anatomy of choice: active inference and agency > A generative model of agency > Exploration, exploitation and novelty
plaindirect- Asserted: passes — The authors put it forward as true.
- Checkable: passes — It can be checked against evidence.
- Load-bearing: passes — The paper’s conclusions depend on it.
- Based: passes — The paper gives a reason why it holds.
A conclusion the paper draws from its own results — it cites no other source for it, so there is none to check. The quote shows it is in the paper.
In the paper
“These arguments may seem a bit abstract but, happily, concrete notions like exploration, exploitation and expected utility emerge as straightforward consequences:”
§ The anatomy of choice: active inference and agency > A generative model of agency > Prior beliefs, entropy and expected utility
plaindirect- Asserted: passes — The authors put it forward as true.
- Checkable: passes — It can be checked against evidence.
- Load-bearing: passes — The paper’s conclusions depend on it.
- Based: passes — The paper gives a reason why it holds.
A conclusion the paper draws from its own results — it cites no other source for it, so there is none to check. The quote shows it is in the paper.
In the paper
“The relative contribution of entropy and expected utility depends upon the precision of prior beliefs about the final state or, equivalently, the relative utility of different states.”
§ The anatomy of choice: active inference and agency > A generative model of agency > Exploration, exploitation and novelty
plaindirect- Asserted: passes — The authors put it forward as true.
- Checkable: passes — It can be checked against evidence.
- Load-bearing: passes — The paper’s conclusions depend on it.
- Based: passes — The paper gives a reason why it holds.
None of the sources cited for this claim have been checked yet.
In the paper
“These schemes consider optimal agents to minimize the KL divergence between controlled and desired outcomes.”
§ The anatomy of choice: active inference and agency > A generative model of agency > Prior beliefs, entropy and expected utility
plaindirect- Asserted: passes — The authors put it forward as true.
- Checkable: passes — It can be checked against evidence.
- Load-bearing: passes — The paper’s conclusions depend on it.
- Based: passes — The paper gives a reason why it holds.
A conclusion the paper draws from its own results — it cites no other source for it, so there is none to check. The quote shows it is in the paper.
In the paper
“If these beliefs are very precise (informative), they will dominate and the agent will (believe it will) maximize expected utility.”
§ The anatomy of choice: active inference and agency > A generative model of agency > Exploration, exploitation and novelty
plaindirect- Asserted: passes — The authors put it forward as true.
- Checkable: passes — It can be checked against evidence.
- Load-bearing: passes — The paper’s conclusions depend on it.
- Based: passes — The paper gives a reason why it holds.
In the paper
“Basing beliefs about future choices on relative entropy is formally related to optimization schemes based on KL control; particularly risk sensitive control; e.g., (van den Broek et al., 2010).”
§ The anatomy of choice: active inference and agency > A generative model of agency > Prior beliefs, entropy and expected utility
What the sources say
- Not checked yetcites van den Broek et al., 2010
plaincorrelational- Asserted: passes — The authors put it forward as true.
- Checkable: passes — It can be checked against evidence.
- Load-bearing: passes — The paper’s conclusions depend on it.
- Based: passes — The paper gives a reason why it holds.
A conclusion the paper draws from its own results — it cites no other source for it, so there is none to check. The quote shows it is in the paper.
In the paper
“There is nothing lawful about this restriction; however, it is particularly appropriate for irreversible Markovian processes that have absorbing states (that render further action pointless).”
§ The anatomy of choice: active inference and agency > Variational bayesian inversion > Approximate bayesian inference
plaincorrelational- Asserted: passes — The authors put it forward as true.
- Checkable: passes — It can be checked against evidence.
- Load-bearing: unclear — It is unclear whether the paper’s conclusions depend on it.
- Based: passes — The paper gives a reason why it holds.
In the paper
“In fact, precision plays a fundamental role in moderating an optimism bias when forming beliefs about hidden states of the world (Sharot et al., 2012).”
§ The anatomy of choice: active inference and agency > A generative model of agency > Exploration, exploitation and novelty
What the sources say
- Not checked yetcites Sharot et al., 2012
plaindirect- Asserted: passes — The authors put it forward as true.
- Checkable: passes — It can be checked against evidence.
- Load-bearing: unclear — It is unclear whether the paper’s conclusions depend on it.
- Based: passes — The paper gives a reason why it holds.
In the paper
“Crucially, this is exactly the softmax choice rule that predominates in QRE theory and other normative models (Haile et al., 2008).”
§ The anatomy of choice: active inference and agency > The functional anatomy of decision-making > Action selection
What the sources say
- Not checked yetcites Haile et al., 2008
plain- Asserted: passes — The authors put it forward as true.
- Checkable: passes — It can be checked against evidence.
- Load-bearing: unclear — It is unclear whether the paper’s conclusions depend on it.
- Based: passes — The paper gives a reason why it holds.
A conclusion the paper draws from its own results — it cites no other source for it, so there is none to check. The quote shows it is in the paper.
In the paper
“Crucially, it is no longer a free parameter but a sufficient statistic of the unknown precision of beliefs about policies.”
§ The anatomy of choice: active inference and agency > Variational bayesian inversion > Approximate bayesian inference
plaincorrelational- Asserted: passes — The authors put it forward as true.
- Checkable: passes — It can be checked against evidence.
- Load-bearing: passes — The paper’s conclusions depend on it.
- Based: passes — The paper gives a reason why it holds.
A conclusion the paper draws from its own results — it cites no other source for it, so there is none to check. The quote shows it is in the paper.
In the paper
“The main point here is that the formalism of variational Bayes allows one to specify constraints on the form of the approximate posterior that makes prior assumptions or beliefs about allowable choices explicit.”
§ The anatomy of choice: active inference and agency > Variational bayesian inversion > Approximate bayesian inference
plaindirect- Asserted: passes — The authors put it forward as true.
- Checkable: passes — It can be checked against evidence.
- Load-bearing: passes — The paper’s conclusions depend on it.
- Based: passes — The paper gives a reason why it holds.
A conclusion the paper draws from its own results — it cites no other source for it, so there is none to check. The quote shows it is in the paper.
In the paper
“Conversely, the factorization with respect to precision is an approximation, because the true posterior will show (mild) conditional dependencies between precision and hidden states.”
§ The anatomy of choice: active inference and agency > Variational bayesian inversion > Approximate bayesian inference
plaincorrelational- Asserted: passes — The authors put it forward as true.
- Checkable: passes — It can be checked against evidence.
- Load-bearing: unclear — It is unclear whether the paper’s conclusions depend on it.
- Based: passes — The paper gives a reason why it holds.
A conclusion the paper draws from its own results — it cites no other source for it, so there is none to check. The quote shows it is in the paper.
In the paper
“However, utilitarian formulations overlook the symmetry between the expected value over states—that provides the value of a choice, and the expected value over choices—that provides the value of a state.”
§ The anatomy of choice: active inference and agency > The functional anatomy of decision-making > Action selection
plain- Asserted: passes — The authors put it forward as true.
- Checkable: passes — It can be checked against evidence.
- Load-bearing: passes — The paper’s conclusions depend on it.
- Based: passes — The paper gives a reason why it holds.
A conclusion the paper draws from its own results — it cites no other source for it, so there is none to check. The quote shows it is in the paper.
In the paper
“Variational Bayes optimizes the sufficient statistics μ ϵ ℝ+ with a series of variational updates.”
§ The anatomy of choice: active inference and agency > Variational bayesian inversion > Variational updates
plaindirect- Asserted: passes — The authors put it forward as true.
- Checkable: passes — It can be checked against evidence.
- Load-bearing: passes — The paper’s conclusions depend on it.
- Based: passes — The paper gives a reason why it holds.
A conclusion the paper draws from its own results — it cites no other source for it, so there is none to check. The quote shows it is in the paper.
In the paper
“However, there are potentially a vast number of control sequences or policies that could require an enormous number of sufficient statistics. This problem can be finessed by only considering allowable or a priori plausible policies.”
§ The anatomy of choice: active inference and agency > Variational bayesian inversion > Approximate bayesian inference
plaindirect- Asserted: passes — The authors put it forward as true.
- Checkable: passes — It can be checked against evidence.
- Load-bearing: passes — The paper’s conclusions depend on it.
- Based: passes — The paper gives a reason why it holds.
A conclusion the paper draws from its own results — it cites no other source for it, so there is none to check. The quote shows it is in the paper.
In the paper
“The marginal over control states has not been factorized because the final outcome depends, in general, on the particular history of choices.”
§ The anatomy of choice: active inference and agency > Variational bayesian inversion > Approximate bayesian inference
plaindirect- Asserted: passes — The authors put it forward as true.
- Checkable: passes — It can be checked against evidence.
- Load-bearing: passes — The paper’s conclusions depend on it.
- Based: passes — The paper gives a reason why it holds.
A conclusion the paper draws from its own results — it cites no other source for it, so there is none to check. The quote shows it is in the paper.
In the paper
“The variational scheme above has a computational form that resembles many aspects of neuronal processing in the brain.”
§ The anatomy of choice: active inference and agency > The functional anatomy of decision-making
plaincorrelational- Asserted: passes — The authors put it forward as true.
- Checkable: passes — It can be checked against evidence.
- Load-bearing: passes — The paper’s conclusions depend on it.
- Based: passes — The paper gives a reason why it holds.
In the paper
“We can now see why precision moderates this bias, much like dopamine (Sharot et al., 2012).”
§ The anatomy of choice: active inference and agency > The functional anatomy of decision-making > Perception
What the sources say
- Not checked yetcites Sharot et al., 2012
plaindirect- Asserted: passes — The authors put it forward as true.
- Checkable: passes — It can be checked against evidence.
- Load-bearing: unclear — It is unclear whether the paper’s conclusions depend on it.
- Based: passes — The paper gives a reason why it holds.
A conclusion the paper draws from its own results — it cites no other source for it, so there is none to check. The quote shows it is in the paper.
In the paper
“These particular mean field assumptions are not approximations, because the true generative process is Markovian.”
§ The anatomy of choice: active inference and agency > Variational bayesian inversion > Approximate bayesian inference
plaindirect- Asserted: passes — The authors put it forward as true.
- Checkable: passes — It can be checked against evidence.
- Load-bearing: passes — The paper’s conclusions depend on it.
- Based: passes — The paper gives a reason why it holds.
- The authors state this as an assumption: The true generative process is Markovian.
A conclusion the paper draws from its own results — it cites no other source for it, so there is none to check. The quote shows it is in the paper.
In the paper
“This rate parameter corresponds to temperature in classic formulations.”
§ The anatomy of choice: active inference and agency > Variational bayesian inversion > Approximate bayesian inference
plaincorrelational- Asserted: passes — The authors put it forward as true.
- Checkable: passes — It can be checked against evidence.
- Load-bearing: unclear — It is unclear whether the paper’s conclusions depend on it.
- Based: passes — The paper gives a reason why it holds.
None of the sources cited for this claim have been checked yet.
In the paper
“Variational Bayes now provides a generic and relatively simple scheme for approximate Bayesian inference that finesses the combinatoric and analytic intractability of exact inference (Beal, 2003; Fox and Roberts, 2012).”
§ The anatomy of choice: active inference and agency > Variational bayesian inversion > Approximate bayesian inference
What the sources say
- Not checked yetcites Beal, 2003
- Not checked yetcites Fox and Roberts, 2012
plaindirect- Asserted: passes — The authors put it forward as true.
- Checkable: passes — It can be checked against evidence.
- Load-bearing: passes — The paper’s conclusions depend on it.
- Based: passes — The paper gives a reason why it holds.
A conclusion the paper draws from its own results — it cites no other source for it, so there is none to check. The quote shows it is in the paper.
In the paper
“This allows one to factorize the (approximate) posterior distribution into marginal distributions, which greatly reduces the size of the state space that has to be represented.”
§ The anatomy of choice: active inference and agency > Variational bayesian inversion > Approximate bayesian inference
plaindirect- Asserted: passes — The authors put it forward as true.
- Checkable: passes — It can be checked against evidence.
- Load-bearing: passes — The paper’s conclusions depend on it.
- Based: passes — The paper gives a reason why it holds.
A conclusion the paper draws from its own results — it cites no other source for it, so there is none to check. The quote shows it is in the paper.
In the paper
“In other words, explorative behavior is not just a random version of exploitative behavior but can itself be very precise, with a clearly defined objective (to maximize the entropy of final outcomes).”
§ The anatomy of choice: active inference and agency > A generative model of agency > Exploration, exploitation and novelty
plain- Asserted: passes — The authors put it forward as true.
- Checkable: passes — It can be checked against evidence.
- Load-bearing: passes — The paper’s conclusions depend on it.
- Based: passes — The paper gives a reason why it holds.
A conclusion the paper draws from its own results — it cites no other source for it, so there is none to check. The quote shows it is in the paper.
In the paper
“In this setting, notions like value, expected utility and exploration bonus are consequences of the underlying imperative to minimize (relative) entropy, entailed by the priors of an agent's generative model.”
§ The anatomy of choice: active inference and agency > A generative model of agency > Exploration, exploitation and novelty
plaindirect- Asserted: passes — The authors put it forward as true.
- Checkable: passes — It can be checked against evidence.
- Load-bearing: passes — The paper’s conclusions depend on it.
- Based: passes — The paper gives a reason why it holds.
A conclusion the paper draws from its own results — it cites no other source for it, so there is none to check. The quote shows it is in the paper.
In the paper
“This confers a temporal contiguity on inference, where empirical prior beliefs about the current state conspire with sensory evidence to produce posterior beliefs.”
§ The anatomy of choice: active inference and agency > The functional anatomy of decision-making > Perception
plaindirect- Asserted: passes — The authors put it forward as true.
- Checkable: passes — It can be checked against evidence.
- Load-bearing: passes — The paper’s conclusions depend on it.
- Based: passes — The paper gives a reason why it holds.
A conclusion the paper draws from its own results — it cites no other source for it, so there is none to check. The quote shows it is in the paper.
In the paper
“Furthermore, the expected value over choices and states π⌢T · Q · s⌢t specifies the optimal precision or inverse temperature, which is overlooked in classic treatments.”
§ The anatomy of choice: active inference and agency > The functional anatomy of decision-making > Action selection
plaindirect- Asserted: passes — The authors put it forward as true.
- Checkable: passes — It can be checked against evidence.
- Load-bearing: passes — The paper’s conclusions depend on it.
- Based: passes — The paper gives a reason why it holds.
A conclusion the paper draws from its own results — it cites no other source for it, so there is none to check. The quote shows it is in the paper.
In the paper
“The efficiency of variational Bayes rests on replacing posterior dependencies among hidden variables with dependencies among the sufficient statistics of marginal probabilities over subsets.”
§ The anatomy of choice: active inference and agency > Variational bayesian inversion > Approximate bayesian inference
plaindirect- Asserted: passes — The authors put it forward as true.
- Checkable: passes — It can be checked against evidence.
- Load-bearing: passes — The paper’s conclusions depend on it.
- Based: passes — The paper gives a reason why it holds.
A conclusion the paper draws from its own results — it cites no other source for it, so there is none to check. The quote shows it is in the paper.
In the paper
“The mean field assumption, enforced by the combinatorics and intractability of exact Bayesian inference, implies a segregation of inference into separable cognitive processes and their neuronal substrates (functional segregation).”
§ The anatomy of choice: active inference and agency > The functional anatomy of decision-making > Evaluating precision
plaindirect- Asserted: passes — The authors put it forward as true.
- Checkable: passes — It can be checked against evidence.
- Load-bearing: passes — The paper’s conclusions depend on it.
- Based: passes — The paper gives a reason why it holds.
- The authors state this as an assumption: The approximate posterior factorizes over past hidden states, future control states, and precision, and factorizes successive states over time.
A conclusion the paper draws from its own results — it cites no other source for it, so there is none to check. The quote shows it is in the paper.
In the paper
“The particular mean field assumption used here implies distinct perceptual, choice and evaluation processes that can be associated with distributed cortical and subcortical systems in the brain.”
§ The anatomy of choice: active inference and agency > The functional anatomy of decision-making > Evaluating precision
plaincorrelational- Asserted: passes — The authors put it forward as true.
- Checkable: passes — It can be checked against evidence.
- Load-bearing: passes — The paper’s conclusions depend on it.
- Based: passes — The paper gives a reason why it holds.
- The authors state this as an assumption: The approximate posterior factorizes over past hidden states, future control states, and precision, and factorizes successive states over time.
A conclusion the paper draws from its own results — it cites no other source for it, so there is none to check. The quote shows it is in the paper.
In the paper
“This reflects the fact that the final outcome is assured with a high degree of confidence, once the high offer has been made and subsequently accepted.”
§ The anatomy of choice: active inference and agency > Decision-making under uncertainty
plaindirect- Asserted: passes — The authors put it forward as true.
- Checkable: passes — It can be checked against evidence.
- Load-bearing: unclear — It is unclear whether the paper’s conclusions depend on it.
- Based: passes — The paper gives a reason why it holds.
A conclusion the paper draws from its own results — it cites no other source for it, so there is none to check. The quote shows it is in the paper.
In the paper
“Conversely, if there is a clear and precise path from the current state to a goal, then precision will be high.”
§ The anatomy of choice: active inference and agency > The functional anatomy of decision-making > Evaluating precision
plaindirect- Asserted: passes — The authors put it forward as true.
- Checkable: passes — It can be checked against evidence.
- Load-bearing: passes — The paper’s conclusions depend on it.
- Based: passes — The paper gives a reason why it holds.
A conclusion the paper draws from its own results — it cites no other source for it, so there is none to check. The quote shows it is in the paper.
In the paper
“This means that it waits, patiently, because it thinks it is more likely to accept an offer in the future than to accept the current offer.”
§ The anatomy of choice: active inference and agency > Decision-making under uncertainty
plaindirectSingle case- Asserted: passes — The authors put it forward as true.
- Checkable: passes — It can be checked against evidence.
- Load-bearing: passes — The paper’s conclusions depend on it.
- Based: passes — The paper gives a reason why it holds.
A conclusion the paper draws from its own results — it cites no other source for it, so there is none to check. The quote shows it is in the paper.
In the paper
“This means that precision reports the attainability of goals in terms of value.”
§ The anatomy of choice: active inference and agency > The functional anatomy of decision-making > Evaluating precision
plaincorrelational- Asserted: passes — The authors put it forward as true.
- Checkable: passes — It can be checked against evidence.
- Load-bearing: passes — The paper’s conclusions depend on it.
- Based: passes — The paper gives a reason why it holds.
A conclusion the paper draws from its own results — it cites no other source for it, so there is none to check. The quote shows it is in the paper.
In the paper
“However, there would be a failure of action selection in the sense that the value of all choices would be the same.”
§ The anatomy of choice: active inference and agency > The functional anatomy of decision-making > Evaluating precision
hedgeddirect- Asserted: passes — The authors put it forward as true.
- Checkable: passes — It can be checked against evidence.
- Load-bearing: passes — The paper’s conclusions depend on it.
- Based: passes — The paper gives a reason why it holds.
A conclusion the paper draws from its own results — it cites no other source for it, so there is none to check. The quote shows it is in the paper.
In the paper
“This circular causality is one of the most important features of the variational scheme and means that one can consider not just the computational role of precision but also how it is controlled by the representations (posterior expectations) it optimizes.”
§ The anatomy of choice: active inference and agency > Decision-making under uncertainty
plaindirect- Asserted: passes — The authors put it forward as true.
- Checkable: passes — It can be checked against evidence.
- Load-bearing: passes — The paper’s conclusions depend on it.
- Based: passes — The paper gives a reason why it holds.
A conclusion the paper draws from its own results — it cites no other source for it, so there is none to check. The quote shows it is in the paper.
In the paper
“In other words, convolving the simulated dopamine responses with an exponential decay function would reproduce the Bayes optimal updates.”
§ The anatomy of choice: active inference and agency > Decision-making under uncertainty
hedgeddirect- Asserted: passes — The authors put it forward as true.
- Checkable: passes — It can be checked against evidence.
- Load-bearing: passes — The paper’s conclusions depend on it.
- Based: passes — The paper gives a reason why it holds.
None of the sources cited for this claim have been checked yet.
In the paper
“This is the second key role of precision; namely, to modulate the selection of competing representations of future action: cf. (Cisek, 2007; Frank et al., 2007; Jocham et al., 2012).”
§ The anatomy of choice: active inference and agency > The functional anatomy of decision-making > Action selection
What the sources say
- Not checked yetcites Cisek, 2007
- Not checked yetcites Frank et al., 2007
- Not checked yetcites Jocham et al., 2012
plaindirect- Asserted: passes — The authors put it forward as true.
- Checkable: passes — It can be checked against evidence.
- Load-bearing: passes — The paper’s conclusions depend on it.
- Based: passes — The paper gives a reason why it holds.
A conclusion the paper draws from its own results — it cites no other source for it, so there is none to check. The quote shows it is in the paper.
In the paper
“It accepts because this is most probable choice—in the face of a high offer—under its prior beliefs that it is most likely to have accepted the higher offer at the end of the game.”
§ The anatomy of choice: active inference and agency > Decision-making under uncertainty
plaindirectSingle case- Asserted: passes — The authors put it forward as true.
- Checkable: passes — It can be checked against evidence.
- Load-bearing: passes — The paper’s conclusions depend on it.
- Based: passes — The paper gives a reason why it holds.
A conclusion the paper draws from its own results — it cites no other source for it, so there is none to check. The quote shows it is in the paper.
In the paper
“One of the key insights, afforded by the variational scheme, is that precision has to be optimized.”
§ The anatomy of choice: active inference and agency > The functional anatomy of decision-making > Evaluating precision
plain- Asserted: passes — The authors put it forward as true.
- Checkable: passes — It can be checked against evidence.
- Load-bearing: passes — The paper’s conclusions depend on it.
- Based: passes — The paper gives a reason why it holds.
A conclusion the paper draws from its own results — it cites no other source for it, so there is none to check. The quote shows it is in the paper.
In the paper
“Neurobiologically, the softmax policy updates would correspond to a winner-take-all or biased competition among competing choices or policies, where competition is modulated by precision.”
§ The anatomy of choice: active inference and agency > The functional anatomy of decision-making > Action selection
hedgedcorrelational- Asserted: passes — The authors put it forward as true.
- Checkable: passes — It can be checked against evidence.
- Load-bearing: passes — The paper’s conclusions depend on it.
- Based: passes — The paper gives a reason why it holds.
A conclusion the paper draws from its own results — it cites no other source for it, so there is none to check. The quote shows it is in the paper.
In the paper
“If precision was zero, then perception would be unbiased and represent a veridical representation of worldly states.”
§ The anatomy of choice: active inference and agency > The functional anatomy of decision-making > Evaluating precision
hedgeddirect- Asserted: passes — The authors put it forward as true.
- Checkable: passes — It can be checked against evidence.
- Load-bearing: passes — The paper’s conclusions depend on it.
- Based: unclear — It is unclear why the paper says it holds.
In the paper
“Although hyperbolic (or exponential) discounting may be sufficient for descriptive purposes, simply optimizing a temporal discounting parameter (Daw and Touretzky, 2002), in light of observed behavior, cannot disambiguate among the prior beliefs an agent may entertain.”
§ The anatomy of choice: active inference and agency > Temporal discounting and marginal utility > Temporal discounting
What the sources say
- Not checked yetcites Daw and Touretzky, 2002
plain- Asserted: passes — The authors put it forward as true.
- Checkable: passes — It can be checked against evidence.
- Load-bearing: passes — The paper’s conclusions depend on it.
- Based: passes — The paper gives a reason why it holds.
A conclusion the paper draws from its own results — it cites no other source for it, so there is none to check. The quote shows it is in the paper.
In the paper
“Generally, as the utility of a particular final state increases, precision increases more slowly—because the implicit distribution over final states is less likely to be realized.”
§ The anatomy of choice: active inference and agency > Temporal discounting and marginal utility > Marginal utility and precision
plaindirect- Asserted: passes — The authors put it forward as true.
- Checkable: passes — It can be checked against evidence.
- Load-bearing: passes — The paper’s conclusions depend on it.
- Based: passes — The paper gives a reason why it holds.
A conclusion the paper draws from its own results — it cites no other source for it, so there is none to check. The quote shows it is in the paper.
In the paper
“In other words, the expected utility of the outcome decreases, the further it recedes into the future.”
§ The anatomy of choice: active inference and agency > Temporal discounting and marginal utility
plaindirect- Asserted: passes — The authors put it forward as true.
- Checkable: passes — It can be checked against evidence.
- Load-bearing: passes — The paper’s conclusions depend on it.
- Based: passes — The paper gives a reason why it holds.
A conclusion the paper draws from its own results — it cites no other source for it, so there is none to check. The quote shows it is in the paper.
In the paper
“This suggests that the agent believes it is more likely to secure an offer later in the game, because it now knows the offer has not been withdrawn; in other words, the possibility of an early withdrawal cannot be discounted at the beginning of the game.”
§ The anatomy of choice: active inference and agency > Temporal discounting and marginal utility
hedgeddirect- Asserted: passes — The authors put it forward as true.
- Checkable: passes — It can be checked against evidence.
- Load-bearing: passes — The paper’s conclusions depend on it.
- Based: passes — The paper gives a reason why it holds.
A conclusion the paper draws from its own results — it cites no other source for it, so there is none to check. The quote shows it is in the paper.
In the paper
“Note that including the entropy in value slightly delays the time to choice—to ensure a greater latitude of options.”
§ The anatomy of choice: active inference and agency > Temporal discounting and marginal utility
plaindirect- Asserted: passes — The authors put it forward as true.
- Checkable: passes — It can be checked against evidence.
- Load-bearing: passes — The paper’s conclusions depend on it.
- Based: passes — The paper gives a reason why it holds.
In the paper
“Having said this (economic) hyperbolic discounting can be derived under a simple generative model of losing a reward, given exponential priors on the hazard rate (Sozou, 1998).”
§ The anatomy of choice: active inference and agency > Temporal discounting and marginal utility > Temporal discounting
What the sources say
- Not checked yetcites Sozou, 1998
plaindirect- Asserted: passes — The authors put it forward as true.
- Checkable: passes — It can be checked against evidence.
- Load-bearing: unclear — It is unclear whether the paper’s conclusions depend on it.
- Based: passes — The paper gives a reason why it holds.
A conclusion the paper draws from its own results — it cites no other source for it, so there is none to check. The quote shows it is in the paper.
In the paper
“in other words, the possibility of an early withdrawal cannot be discounted at the beginning of the game.”
§ The anatomy of choice: active inference and agency > Temporal discounting and marginal utility
plain- Asserted: passes — The authors put it forward as true.
- Checkable: passes — It can be checked against evidence.
- Load-bearing: passes — The paper’s conclusions depend on it.
- Based: passes — The paper gives a reason why it holds.
A conclusion the paper draws from its own results — it cites no other source for it, so there is none to check. The quote shows it is in the paper.
In the paper
“This is because the discounting of expected utility depends upon inference about the current state, future choices and precision—all of which change with time in an interdependent fashion.”
§ The anatomy of choice: active inference and agency > Temporal discounting and marginal utility > Temporal discounting
plaindirect- Asserted: passes — The authors put it forward as true.
- Checkable: passes — It can be checked against evidence.
- Load-bearing: passes — The paper’s conclusions depend on it.
- Based: passes — The paper gives a reason why it holds.
In the paper
“Intuitively, there is value in keeping ones options open: cf. a novelty bonus (Krebs et al., 2009).”
§ The anatomy of choice: active inference and agency > Temporal discounting and marginal utility
What the sources say
- Not checked yetcites Krebs et al., 2009
plain- Asserted: passes — The authors put it forward as true.
- Checkable: passes — It can be checked against evidence.
- Load-bearing: passes — The paper’s conclusions depend on it.
- Based: passes — The paper gives a reason why it holds.
A conclusion the paper draws from its own results — it cites no other source for it, so there is none to check. The quote shows it is in the paper.
In the paper
“This illustrates the interdependency of expectations about precision and hidden states of the world—which change after the offer has been withdrawn.”
§ The anatomy of choice: active inference and agency > Decision-making under uncertainty
plaincorrelational- Asserted: passes — The authors put it forward as true.
- Checkable: passes — It can be checked against evidence.
- Load-bearing: passes — The paper’s conclusions depend on it.
- Based: passes — The paper gives a reason why it holds.
None of the sources cited for this claim have been checked yet.
In the paper
“For people familiar with previous discussions of dopamine in the context of active inference, the correspondence between precision and dopaminergic neurotransmission will come as no surprise—exactly the same conclusions have been reached when examining predictive coding schemes (Friston et al., 2012b) and hierarchical inference using volatility models (Mathys et al., 2011).”
§ The anatomy of choice: active inference and agency > Decision-making under uncertainty
What the sources say
- Not checked yetcites Friston et al., 2012b
- Not checked yetcites Mathys et al., 2011
boostedcorrelational- Asserted: passes — The authors put it forward as true.
- Checkable: passes — It can be checked against evidence.
- Load-bearing: unclear — It is unclear whether the paper’s conclusions depend on it.
- Based: passes — The paper gives a reason why it holds.
In the paper
“This leads to a convex relationship between marginal utility and utility: cf. the law of diminishing marginal utility (Kauder, 1953).”
§ The anatomy of choice: active inference and agency > Temporal discounting and marginal utility > Marginal utility and precision
What the sources say
- Not checked yetcites Kauder, 1953
plaincorrelational- Asserted: passes — The authors put it forward as true.
- Checkable: passes — It can be checked against evidence.
- Load-bearing: passes — The paper’s conclusions depend on it.
- Based: passes — The paper gives a reason why it holds.
A conclusion the paper draws from its own results — it cites no other source for it, so there is none to check. The quote shows it is in the paper.
In the paper
“This is because all allowable policies entail a choice but with no preference for when that choice is made.”
§ The anatomy of choice: active inference and agency > Decision-making under uncertainty
plain- Asserted: passes — The authors put it forward as true.
- Checkable: passes — It can be checked against evidence.
- Load-bearing: passes — The paper’s conclusions depend on it.
- Based: passes — The paper gives a reason why it holds.
A conclusion the paper draws from its own results — it cites no other source for it, so there is none to check. The quote shows it is in the paper.
In the paper
“This reflects the fact that accepting an offer precludes other outcomes and therefore reduces the entropy of the distribution over final states.”
§ The anatomy of choice: active inference and agency > Temporal discounting and marginal utility
plaindirect- Asserted: passes — The authors put it forward as true.
- Checkable: passes — It can be checked against evidence.
- Load-bearing: passes — The paper’s conclusions depend on it.
- Based: passes — The paper gives a reason why it holds.
In the paper
““In brief, the emergent role of dopamine is to report the precision or salience of perceptual cues that portend a predictable sequence of sensorimotor events.”
§ The anatomy of choice: active inference and agency > Decision-making under uncertainty
What the sources say
- Not checked yetcites Friston et al., 2012b
plaindirect- Asserted: passes — The authors put it forward as true.
- Checkable: passes — It can be checked against evidence.
- Load-bearing: passes — The paper’s conclusions depend on it.
- Based: passes — The paper gives a reason why it holds.
A conclusion the paper draws from its own results — it cites no other source for it, so there is none to check. The quote shows it is in the paper.
In the paper
“Assuming the entropy term in Equation (4) small enough to be ignored, it is easy to see that expected marginal utility directly informs choices: (10)”
§ The anatomy of choice: active inference and agency > Temporal discounting and marginal utility > Marginal utility and precision
plaindirect- Asserted: passes — The authors put it forward as true.
- Checkable: passes — It can be checked against evidence.
- Load-bearing: passes — The paper’s conclusions depend on it.
- Based: passes — The paper gives a reason why it holds.
- The authors state this as an assumption: The entropy term in Equation (4) is small enough to be ignored.
A conclusion the paper draws from its own results — it cites no other source for it, so there is none to check. The quote shows it is in the paper.
In the paper
“This is the essence of temporal discounting, which—in this example—can be explained simply by prior beliefs that the offer will be withdrawn before the final outcome is reached.”
§ The anatomy of choice: active inference and agency > Temporal discounting and marginal utility
plaindirect- Asserted: passes — The authors put it forward as true.
- Checkable: passes — It can be checked against evidence.
- Load-bearing: passes — The paper’s conclusions depend on it.
- Based: passes — The paper gives a reason why it holds.
- Rests on an assumption: The offer will be withdrawn before the final outcome is reached (prior belief).
A conclusion the paper draws from its own results — it cites no other source for it, so there is none to check. The quote shows it is in the paper.
In the paper
“This means that the value of the current state depends upon how easy it is to access the final state.”
§ The anatomy of choice: active inference and agency > Temporal discounting and marginal utility > Marginal utility and precision
plaindirect- Asserted: passes — The authors put it forward as true.
- Checkable: passes — It can be checked against evidence.
- Load-bearing: passes — The paper’s conclusions depend on it.
- Based: passes — The paper gives a reason why it holds.
A conclusion the paper draws from its own results — it cites no other source for it, so there is none to check. The quote shows it is in the paper.
In the paper
“Furthermore, the ensuing choice depends upon precision, suggesting that the effect of value on choice can be expressed in terms of an effective utility γ · c(sT) that we will call marginal utility (for consistency with economic theory).”
§ The anatomy of choice: active inference and agency > Temporal discounting and marginal utility > Marginal utility and precision
hedgeddirect- Asserted: passes — The authors put it forward as true.
- Checkable: passes — It can be checked against evidence.
- Load-bearing: passes — The paper’s conclusions depend on it.
- Based: passes — The paper gives a reason why it holds.
A conclusion the paper draws from its own results — it cites no other source for it, so there is none to check. The quote shows it is in the paper.
In the paper
“Intuitively, the marginal utility depends on the confidence that a goal can be reached.”
§ The anatomy of choice: active inference and agency > Temporal discounting and marginal utility > Marginal utility and precision
plaindirect- Asserted: passes — The authors put it forward as true.
- Checkable: passes — It can be checked against evidence.
- Load-bearing: passes — The paper’s conclusions depend on it.
- Based: passes — The paper gives a reason why it holds.
A conclusion the paper draws from its own results — it cites no other source for it, so there is none to check. The quote shows it is in the paper.
In the paper
“In the current setup, this asymmetry results from the nature of utility and its dependency upon precision.”
§ The anatomy of choice: active inference and agency > Temporal discounting and marginal utility > Marginal utility and precision
plaindirect- Asserted: passes — The authors put it forward as true.
- Checkable: passes — It can be checked against evidence.
- Load-bearing: passes — The paper’s conclusions depend on it.
- Based: passes — The paper gives a reason why it holds.
A conclusion the paper draws from its own results — it cites no other source for it, so there is none to check. The quote shows it is in the paper.
In the paper
“In summary, many classic phenomena in utilitarian and economic theory resurface here as natural consequences of Bayes optimal (active) inference under a relatively simple generative model.”
§ The anatomy of choice: active inference and agency > Temporal discounting and marginal utility > Marginal utility and precision
plaindirect- Asserted: passes — The authors put it forward as true.
- Checkable: passes — It can be checked against evidence.
- Load-bearing: passes — The paper’s conclusions depend on it.
- Based: passes — The paper gives a reason why it holds.
A conclusion the paper draws from its own results — it cites no other source for it, so there is none to check. The quote shows it is in the paper.
In the paper
“Beliefs about precision depend upon expected value under both states and choices.”
§ The anatomy of choice: active inference and agency > Conclusion
plaindirect- Asserted: passes — The authors put it forward as true.
- Checkable: passes — It can be checked against evidence.
- Load-bearing: passes — The paper’s conclusions depend on it.
- Based: passes — The paper gives a reason why it holds.
A conclusion the paper draws from its own results — it cites no other source for it, so there is none to check. The quote shows it is in the paper.
In the paper
“Optimal behavior can be cast as a pure inference problem, in which valuable outcomes are defined in terms of prior beliefs about future states.”
§ The anatomy of choice: active inference and agency > Conclusion
plaindirect- Asserted: passes — The authors put it forward as true.
- Checkable: unclear — It is unclear whether it could be checked against evidence.
- Load-bearing: passes — The paper’s conclusions depend on it.
- Based: passes — The paper gives a reason why it holds.
A conclusion the paper draws from its own results — it cites no other source for it, so there is none to check. The quote shows it is in the paper.
In the paper
“Precision has to be optimized to balance prior beliefs about choices and sensory evidence for hidden states.”
§ The anatomy of choice: active inference and agency > Conclusion
plaindirect- Asserted: passes — The authors put it forward as true.
- Checkable: passes — It can be checked against evidence.
- Load-bearing: passes — The paper’s conclusions depend on it.
- Based: passes — The paper gives a reason why it holds.
A conclusion the paper draws from its own results — it cites no other source for it, so there is none to check. The quote shows it is in the paper.
In the paper
“One reason is that normative accounts do not distinguish between action and beliefs about action (control).”
§ The anatomy of choice: active inference and agency > Conclusion
plain- Asserted: passes — The authors put it forward as true.
- Checkable: passes — It can be checked against evidence.
- Load-bearing: passes — The paper’s conclusions depend on it.
- Based: unclear — It is unclear why the paper says it holds.
A conclusion the paper draws from its own results — it cites no other source for it, so there is none to check. The quote shows it is in the paper.
In the paper
“These beliefs entail both content (expectations) and uncertainty (precision).”
§ The anatomy of choice: active inference and agency > Conclusion
plain- Asserted: passes — The authors put it forward as true.
- Checkable: passes — It can be checked against evidence.
- Load-bearing: passes — The paper’s conclusions depend on it.
- Based: passes — The paper gives a reason why it holds.
None of the sources cited for this claim have been checked yet.
In the paper
“The notion that dopamine encodes precision is now receiving support from several lines of evidence; from purely theoretical treatments of hierarchical Bayesian inference (Mathys et al., 2011), from theoretical neurobiology (Frank et al., 2007; Fletcher and Frith, 2009; Friston et al., 2012b; Pellicano and Burr, 2012) and from empirical studies (Fiorillo et al., 2008; Coull et al., 2011; Galea et a”
§ The anatomy of choice: active inference and agency > Conclusion
What the sources say
- Not checked yetcites Mathys et al., 2011
- Not checked yetcites Frank et al., 2007
- Not checked yetcites Fiorillo et al., 2008
plaincorrelational- Asserted: passes — The authors put it forward as true.
- Checkable: passes — It can be checked against evidence.
- Load-bearing: passes — The paper’s conclusions depend on it.
- Based: passes — The paper gives a reason why it holds.
A conclusion the paper draws from its own results — it cites no other source for it, so there is none to check. The quote shows it is in the paper.
In the paper
“Variational free energy provides a bound on Bayesian model evidence (marginal likelihood) that is optimized by bounded rational behavior.”
§ The anatomy of choice: active inference and agency > Conclusion
plaindirect- Asserted: passes — The authors put it forward as true.
- Checkable: passes — It can be checked against evidence.
- Load-bearing: passes — The paper’s conclusions depend on it.
- Based: passes — The paper gives a reason why it holds.
A conclusion the paper draws from its own results — it cites no other source for it, so there is none to check. The quote shows it is in the paper.
In the paper
“This mandates beliefs about action (control) that are distinct from action per se—beliefs that entail a precision.”
§ The anatomy of choice: active inference and agency > Conclusion
plaindirect- Asserted: passes — The authors put it forward as true.
- Checkable: unclear — It is unclear whether it could be checked against evidence.
- Load-bearing: passes — The paper’s conclusions depend on it.
- Based: passes — The paper gives a reason why it holds.
A conclusion the paper draws from its own results — it cites no other source for it, so there is none to check. The quote shows it is in the paper.
In the paper
“These beliefs can be cast in terms of minimizing the relative entropy or divergence between prior goals—over final states—and conditional distributions, given the current state of the world and future choices.”
§ The anatomy of choice: active inference and agency > Conclusion
plaindirect- Asserted: passes — The authors put it forward as true.
- Checkable: passes — It can be checked against evidence.
- Load-bearing: passes — The paper’s conclusions depend on it.
- Based: passes — The paper gives a reason why it holds.
A conclusion the paper draws from its own results — it cites no other source for it, so there is none to check. The quote shows it is in the paper.
In the paper
“This requires (approximate Bayesian) inference on both hidden states of the world and (future) control states.”
§ The anatomy of choice: active inference and agency > Conclusion
plaindirect- Asserted: passes — The authors put it forward as true.
- Checkable: passes — It can be checked against evidence.
- Load-bearing: passes — The paper’s conclusions depend on it.
- Based: passes — The paper gives a reason why it holds.
In the paper
“However, there is one comforting point of convergence between variational Bayes and more neurobiologically plausible predictive coding schemes (Bastos et al., 2012): this is the fact that the solution for both is exactly the same.”
§ The anatomy of choice: active inference and agency > Conclusion
What the sources say
- Not checked yetcites Bastos et al., 2012
plain- Asserted: passes — The authors put it forward as true.
- Checkable: passes — It can be checked against evidence.
- Load-bearing: unclear — It is unclear whether the paper’s conclusions depend on it.
- Based: passes — The paper gives a reason why it holds.
- Probably not a substantial claim. 47
- It may state two separate claims as one. 47
- The quote only partly states this claim. 1
The paper states this without a source or data behind it here, so there is nothing to check it against. The quote shows it is in the paper.
In the paper
“Because utility is defined in terms of a probability distribution—which sums to one—the utility (log probability) of any state is negative and can be at most zero (i.e., cost is non-negative).”
§ The anatomy of choice: active inference and agency > A generative model of agency > Prior beliefs, entropy and expected utility
plain- Asserted: passes — The authors put it forward as true.
- Checkable: passes — It can be checked against evidence.
- Load-bearing: fails — The paper’s conclusions may not depend on it.
- Based: passes — The paper gives a reason why it holds.
Probably not a substantial claim. The paper’s conclusions may not depend on it. It may state two separate claims as one.
The paper states this without a source or data behind it here, so there is nothing to check it against. The quote shows it is in the paper.
In the paper
“As indicated in Equation (4), this means that the value of a choice comprises an exploration bonus and an expected utility, where the former depends upon the current state and the latter does not.”
§ The anatomy of choice: active inference and agency > A generative model of agency > Exploration, exploitation and novelty
hedged- Asserted: passes — The authors put it forward as true.
- Checkable: passes — It can be checked against evidence.
- Load-bearing: passes — The paper’s conclusions depend on it.
- Based: passes — The paper gives a reason why it holds.
It may state two separate claims as one.
The paper states this without a source or data behind it here, so there is nothing to check it against. The quote shows it is in the paper.
In the paper
“The equivalent dynamics in the lower right panel show the expected precision over all updates in terms of simulated dopamine responses.”
§ The anatomy of choice: active inference and agency > Decision-making under uncertainty
plaincorrelational- Asserted: passes — The authors put it forward as true.
- Checkable: passes — It can be checked against evidence.
- Load-bearing: fails — The paper’s conclusions may not depend on it.
- Based: passes — The paper gives a reason why it holds.
Probably not a substantial claim. The paper’s conclusions may not depend on it.
The paper states this without a source or data behind it here, so there is nothing to check it against. The quote shows it is in the paper.
In the paper
“At this point the expected precision increases markedly, and then remains constant until the end of the game (at its maximum value of eight).”
§ The anatomy of choice: active inference and agency > Decision-making under uncertainty
plaindirect- Asserted: passes — The authors put it forward as true.
- Checkable: passes — It can be checked against evidence.
- Load-bearing: unclear — It is unclear whether the paper’s conclusions depend on it.
- Based: passes — The paper gives a reason why it holds.
It may state two separate claims as one.
A result the paper reports from its own data — it cites no other source for it, so there is none to check. The quote shows it is in the paper.
In the paper
“In this example, the low offer was replaced with a high offer on the eleventh trial, which the agent accepted.”
§ The anatomy of choice: active inference and agency > Decision-making under uncertainty
plainSingle case- Asserted: passes — The authors put it forward as true.
- Checkable: passes — It can be checked against evidence.
- Load-bearing: fails — The paper’s conclusions may not depend on it.
- Based: passes — The paper gives a reason why it holds.
Probably not a substantial claim. The paper’s conclusions may not depend on it.
A result the paper reports from its own data — it cites no other source for it, so there is none to check. The quote shows it is in the paper.
In the paper
“Inspection of the upper panels shows that the choice probabilities are essentially the same—with a tendency to wait until the last trial until the low offer becomes more attractive than the high offer (at a utility of four).”
§ The anatomy of choice: active inference and agency > Temporal discounting and marginal utility
plain- Asserted: passes — The authors put it forward as true.
- Checkable: passes — It can be checked against evidence.
- Load-bearing: unclear — It is unclear whether the paper’s conclusions depend on it.
- Based: passes — The paper gives a reason why it holds.
It may state two separate claims as one.
The paper states this without a source or data behind it here, so there is nothing to check it against. The quote shows it is in the paper.
In the paper
“Interestingly, at the point the offer is withdrawn, there is a profound suppression of simulated dopamine firing, followed by phasic bursts on subsequent cues that gently increase with the increasing probability of choosing—despite the fact that nothing can be changed.”
§ The anatomy of choice: active inference and agency > Decision-making under uncertainty
plaindirect- Asserted: passes — The authors put it forward as true.
- Checkable: passes — It can be checked against evidence.
- Load-bearing: unclear — It is unclear whether the paper’s conclusions depend on it.
- Based: passes — The paper gives a reason why it holds.
It may state two separate claims as one.
A result the paper reports from its own data — it cites no other source for it, so there is none to check. The quote shows it is in the paper.
In the paper
“The result is a characteristic convex relationship, in which marginal utility decreases more slowly with the utility of the high offer—reaching its maximum at zero.”
§ The anatomy of choice: active inference and agency > Temporal discounting and marginal utility > Marginal utility and precision
plaindirect- Asserted: passes — The authors put it forward as true.
- Checkable: passes — It can be checked against evidence.
- Load-bearing: unclear — It is unclear whether the paper’s conclusions depend on it.
- Based: passes — The paper gives a reason why it holds.
It may state two separate claims as one.
A conclusion the paper draws from its own results — it cites no other source for it, so there is none to check. The quote shows it is in the paper.
In the paper
“Although variational Bayes relies upon discrete updates, variational updates still possess a dynamics that can be compared to neuronal responses, particularly dopaminergic responses.”
§ The anatomy of choice: active inference and agency > Introduction
plaincorrelational- Asserted: passes — The authors put it forward as true.
- Checkable: passes — It can be checked against evidence.
- Load-bearing: fails — The paper’s conclusions may not depend on it.
- Based: fails — The paper may give no reason why it holds.
Probably not a substantial claim. The paper’s conclusions may not depend on it. The paper may give no reason why it holds.
A conclusion the paper draws from its own results — it cites no other source for it, so there is none to check. The quote shows it is in the paper.
In the paper
“This means that bounded rationality must emerge from free energy minimization and the value of a state (or action) is a consequence of behavior, as opposed to its cause.”
§ The anatomy of choice: active inference and agency > Introduction
plaindirect- Asserted: passes — The authors put it forward as true.
- Checkable: passes — It can be checked against evidence.
- Load-bearing: passes — The paper’s conclusions depend on it.
- Based: passes — The paper gives a reason why it holds.
It may state two separate claims as one.
A conclusion the paper draws from its own results — it cites no other source for it, so there is none to check. The quote shows it is in the paper.
In the paper
“First, because relative entropy can always be decomposed into entropy and expected utility, the ensuing policies maximize expected utility and the entropy over final states.”
§ The anatomy of choice: active inference and agency > Introduction
plaindirect- Asserted: passes — The authors put it forward as true.
- Checkable: passes — It can be checked against evidence.
- Load-bearing: passes — The paper’s conclusions depend on it.
- Based: unclear — It is unclear why the paper says it holds.
It may state two separate claims as one.
- The authors state this as an assumption: Policies are selected under the prior belief that they minimize the divergence, or relative entropy, between a probability distribution over states that can be reached and states agents believe they should occupy, which are states or goals believed a priori to have high utility.
A conclusion the paper draws from its own results — it cites no other source for it, so there is none to check. The quote shows it is in the paper.
In the paper
“This paper suggests that sensitivity can itself be optimized and corresponds to the confidence or precision associated with beliefs about the consequences of choices.”
§ The anatomy of choice: active inference and agency > Introduction
hedgedcorrelational- Asserted: passes — The authors put it forward as true.
- Checkable: passes — It can be checked against evidence.
- Load-bearing: passes — The paper’s conclusions depend on it.
- Based: unclear — It is unclear why the paper says it holds.
It may state two separate claims as one.
A conclusion the paper draws from its own results — it cites no other source for it, so there is none to check. The quote shows it is in the paper.
In the paper
“This sensitivity corresponds to the precision of beliefs about behavior, such that attainable goals are afforded a higher precision or confidence.”
§ The anatomy of choice: active inference and agency > Abstract
plaincorrelational- Asserted: passes — The authors put it forward as true.
- Checkable: passes — It can be checked against evidence.
- Load-bearing: passes — The paper’s conclusions depend on it.
- Based: fails — The paper may give no reason why it holds.
Probably not a substantial claim. The paper may give no reason why it holds.
The paper states this without a source or data behind it here, so there is nothing to check it against. The quote shows it is in the paper.
In the paper
“In active inference, there is no value function: free energy is the only quantity that is optimized.”
§ The anatomy of choice: active inference and agency > Introduction
plain- Asserted: passes — The authors put it forward as true.
- Checkable: passes — It can be checked against evidence.
- Load-bearing: passes — The paper’s conclusions depend on it.
- Based: unclear — It is unclear why the paper says it holds.
It may state two separate claims as one.
A conclusion the paper draws from its own results — it cites no other source for it, so there is none to check. The quote shows it is in the paper.
In the paper
“Third, because policy optimization is absorbed into the more general problem of inferring hidden states of the world, inferences about policies depend upon inferences about hidden states and vice versa.”
§ The anatomy of choice: active inference and agency > Introduction
plaindirect- Asserted: passes — The authors put it forward as true.
- Checkable: passes — It can be checked against evidence.
- Load-bearing: passes — The paper’s conclusions depend on it.
- Based: passes — The paper gives a reason why it holds.
It may state two separate claims as one.
The paper states this without a source or data behind it here, so there is nothing to check it against. The quote shows it is in the paper.
In the paper
“In active inference, beliefs about (hidden or fictive) states of the world maximize model evidence or the marginal likelihood of observations.”
§ The anatomy of choice: active inference and agency > Active inference
plaindirect- Asserted: passes — The authors put it forward as true.
- Checkable: passes — It can be checked against evidence.
- Load-bearing: passes — The paper’s conclusions depend on it.
- Based: fails — The paper may give no reason why it holds.
Probably not a substantial claim. The paper may give no reason why it holds.
A conclusion the paper draws from its own results — it cites no other source for it, so there is none to check. The quote shows it is in the paper.
In the paper
“In other words, under the assumption that action is sampled from posterior beliefs about control, we can treat decision-making and action selection as a pure inference problem that necessarily entails optimizing beliefs about behavior and its consequences.”
§ The anatomy of choice: active inference and agency > Active inference
plaindirect- Asserted: passes — The authors put it forward as true.
- Checkable: passes — It can be checked against evidence.
- Load-bearing: passes — The paper’s conclusions depend on it.
- Based: passes — The paper gives a reason why it holds.
Probably not a substantial claim.
- The authors state this as an assumption: Action is sampled from posterior beliefs about control states.
The paper states this without a source or data behind it here, so there is nothing to check it against. The quote shows it is in the paper.
In the paper
“In contrast to classic formulations, active inference makes a distinction between action as a physical state of the real world and beliefs about (future) action that we will refer to as control states—it is these that constitute a sense of agency.”
§ The anatomy of choice: active inference and agency > Active inference
plaindirect- Asserted: passes — The authors put it forward as true.
- Checkable: passes — It can be checked against evidence.
- Load-bearing: passes — The paper’s conclusions depend on it.
- Based: passes — The paper gives a reason why it holds.
Probably not a substantial claim. It may state two separate claims as one.
A conclusion the paper draws from its own results — it cites no other source for it, so there is none to check. The quote shows it is in the paper.
In the paper
“In biological terms, a partition into conditionally independent representations is nothing more or less than functional segregation in the brain—in which specialized neuronal systems can be regarded as performing variational Bayesian updates by passing messages to each other.”
§ The anatomy of choice: active inference and agency > Introduction
plaincorrelational- Asserted: passes — The authors put it forward as true.
- Checkable: passes — It can be checked against evidence.
- Load-bearing: passes — The paper’s conclusions depend on it.
- Based: fails — The paper may give no reason why it holds.
Probably not a substantial claim. The paper may give no reason why it holds.
In the paper
“Second, because policies are inferred, they are associated with a confidence or precision that is itself optimized. This furnishes a unique and Bayes-optimal sensitivity or inverse temperature—of the sort associated with softmax choice rules and quantal response equilibria (McKelvey and Palfrey, 1995).”
§ The anatomy of choice: active inference and agency > Introduction
What the sources say
- Not checked yetcites McKelvey and Palfrey, 1995
plaindirect- Asserted: passes — The authors put it forward as true.
- Checkable: passes — It can be checked against evidence.
- Load-bearing: passes — The paper’s conclusions depend on it.
- Based: passes — The paper gives a reason why it holds.
It may state two separate claims as one.
In the paper
“This means that beliefs about hidden states depend upon the confidence in policies—leading to an optimism bias (Sharot et al., 2012), in which inferences about ambiguous states are biased toward those that support an optimal policy.”
§ The anatomy of choice: active inference and agency > Introduction
What the sources say
- Not checked yetcites Sharot et al., 2012
plaindirect- Asserted: passes — The authors put it forward as true.
- Checkable: passes — It can be checked against evidence.
- Load-bearing: passes — The paper’s conclusions depend on it.
- Based: passes — The paper gives a reason why it holds.
It may state two separate claims as one.
A conclusion the paper draws from its own results — it cites no other source for it, so there is none to check. The quote shows it is in the paper.
In the paper
“We will see later that these posterior beliefs depend crucially upon prior beliefs about states that will be occupied in the future.”
§ The anatomy of choice: active inference and agency > Active inference > The free-energy principle and active inference
plaindirect- Asserted: passes — The authors put it forward as true.
- Checkable: passes — It can be checked against evidence.
- Load-bearing: passes — The paper’s conclusions depend on it.
- Based: fails — The paper may give no reason why it holds.
Probably not a substantial claim. The paper may give no reason why it holds.
A conclusion the paper draws from its own results — it cites no other source for it, so there is none to check. The quote shows it is in the paper.
In the paper
“In essence, this model represents past hidden states and future choices, under the belief that control from the current state will minimize the divergence between the distribution over final states and a prior distribution or goal.”
§ The anatomy of choice: active inference and agency > A generative model of agency > The generative model
plaindirect- Asserted: passes — The authors put it forward as true.
- Checkable: passes — It can be checked against evidence.
- Load-bearing: passes — The paper’s conclusions depend on it.
- Based: passes — The paper gives a reason why it holds.
Probably not a substantial claim.
A conclusion the paper draws from its own results — it cites no other source for it, so there is none to check. The quote shows it is in the paper.
In the paper
“Mathematically, this divergence can be decomposed into two terms that have important implications for behavior.”
§ The anatomy of choice: active inference and agency > A generative model of agency > Prior beliefs, entropy and expected utility
plain- Asserted: passes — The authors put it forward as true.
- Checkable: passes — It can be checked against evidence.
- Load-bearing: passes — The paper’s conclusions depend on it.
- Based: passes — The paper gives a reason why it holds.
The quote only partly states this claim.
A conclusion the paper draws from its own results — it cites no other source for it, so there is none to check. The quote shows it is in the paper.
In the paper
“This decomposition of value means that agents (believe they) will maximize the entropy of their final states while maximizing expected utility.”
§ The anatomy of choice: active inference and agency > A generative model of agency > Exploration, exploitation and novelty
hedgeddirect- Asserted: passes — The authors put it forward as true.
- Checkable: passes — It can be checked against evidence.
- Load-bearing: passes — The paper’s conclusions depend on it.
- Based: passes — The paper gives a reason why it holds.
It may state two separate claims as one.
A conclusion the paper draws from its own results — it cites no other source for it, so there is none to check. The quote shows it is in the paper.
In the paper
“The third equality shows that minimizing free energy is the same as maximizing the expected log likelihood of observations or accuracy, while minimizing the divergence between the approximate posterior and prior beliefs about hidden variables.”
§ The anatomy of choice: active inference and agency > Active inference > The free-energy principle and active inference
plaindirect- Asserted: passes — The authors put it forward as true.
- Checkable: passes — It can be checked against evidence.
- Load-bearing: passes — The paper’s conclusions depend on it.
- Based: passes — The paper gives a reason why it holds.
It may state two separate claims as one.
A conclusion the paper draws from its own results — it cites no other source for it, so there is none to check. The quote shows it is in the paper.
In the paper
“These arguments suggest that action must minimize variational free energy, because outcomes can only be changed by action.”
§ The anatomy of choice: active inference and agency > Active inference > The free-energy principle and active inference
hedgeddirect- Asserted: passes — The authors put it forward as true.
- Checkable: passes — It can be checked against evidence.
- Load-bearing: passes — The paper’s conclusions depend on it.
- Based: passes — The paper gives a reason why it holds.
It may state two separate claims as one.
None of the sources cited for this claim have been checked yet.
In the paper
“This means that if agents minimize free energy they minimize surprise (approximately). Coincidentally, they maximize model evidence (approximately) and implicitly engage in approximate Bayesian inference (Dayan et al., 1995; Friston, 2010).”
§ The anatomy of choice: active inference and agency > Active inference > The free-energy principle and active inference
What the sources say
- Not checked yetcites Dayan et al., 1995
- Not checked yetcites Friston, 2010
plaindirect- Asserted: passes — The authors put it forward as true.
- Checkable: passes — It can be checked against evidence.
- Load-bearing: passes — The paper’s conclusions depend on it.
- Based: passes — The paper gives a reason why it holds.
It may state two separate claims as one.
The paper states this without a source or data behind it here, so there is nothing to check it against. The quote shows it is in the paper.
In the paper
“In active inference, the sufficient statistics minimize free energy and the ensuing beliefs about control states prescribe action: (1)”
§ The anatomy of choice: active inference and agency > Active inference > The free-energy principle and active inference
plaindirect- Asserted: passes — The authors put it forward as true.
- Checkable: passes — It can be checked against evidence.
- Load-bearing: passes — The paper’s conclusions depend on it.
- Based: fails — The paper may give no reason why it holds.
Probably not a substantial claim. The paper may give no reason why it holds. It may state two separate claims as one.
A conclusion the paper draws from its own results — it cites no other source for it, so there is none to check. The quote shows it is in the paper.
In the paper
“This means that behavior minimizes surprise or maximizes model evidence; either exactly—to produce perfectly rational behavior, or approximately—to minimize a variational bound to produce bounded rational behavior.”
§ The anatomy of choice: active inference and agency > Active inference > The free-energy principle and active inference
plaindirect- Asserted: passes — The authors put it forward as true.
- Checkable: passes — It can be checked against evidence.
- Load-bearing: passes — The paper’s conclusions depend on it.
- Based: passes — The paper gives a reason why it holds.
It may state two separate claims as one.
A conclusion the paper draws from its own results — it cites no other source for it, so there is none to check. The quote shows it is in the paper.
In the paper
“Utility is a fixed attribute of states that agents are attracted to. In contrast, the value of a policy is context sensitive and depends upon the current state.”
§ The anatomy of choice: active inference and agency > A generative model of agency > Prior beliefs, entropy and expected utility
plain- Asserted: passes — The authors put it forward as true.
- Checkable: passes — It can be checked against evidence.
- Load-bearing: passes — The paper’s conclusions depend on it.
- Based: passes — The paper gives a reason why it holds.
Probably not a substantial claim. It may state two separate claims as one.
The paper states this without a source or data behind it here, so there is nothing to check it against. The quote shows it is in the paper.
In the paper
“This model comprises prior beliefs that determine the states an agent or model will frequent.”
§ The anatomy of choice: active inference and agency > A generative model of agency
plaindirect- Asserted: passes — The authors put it forward as true.
- Checkable: passes — It can be checked against evidence.
- Load-bearing: passes — The paper’s conclusions depend on it.
- Based: fails — The paper may give no reason why it holds.
Probably not a substantial claim. The paper may give no reason why it holds.
The paper states this without a source or data behind it here, so there is nothing to check it against. The quote shows it is in the paper.
In the paper
“In the general forms of these models, control states modify the transition probabilities among hidden states, while hidden states modify the transitions among control states (as denoted by the connections with circles).”
§ The anatomy of choice: active inference and agency > A generative model of agency > The generative model
plaindirect- Asserted: passes — The authors put it forward as true.
- Checkable: passes — It can be checked against evidence.
- Load-bearing: passes — The paper’s conclusions depend on it.
- Based: passes — The paper gives a reason why it holds.
Probably not a substantial claim. It may state two separate claims as one.
A conclusion the paper draws from its own results — it cites no other source for it, so there is none to check. The quote shows it is in the paper.
In the paper
“Crucially, the precision of beliefs about policies is determined by a hidden variable γ ϵ ℝ+ that has to be inferred.”
§ The anatomy of choice: active inference and agency > A generative model of agency > The generative model
plaindirect- Asserted: passes — The authors put it forward as true.
- Checkable: passes — It can be checked against evidence.
- Load-bearing: passes — The paper’s conclusions depend on it.
- Based: fails — The paper may give no reason why it holds.
Probably not a substantial claim. The paper may give no reason why it holds.
A conclusion the paper draws from its own results — it cites no other source for it, so there is none to check. The quote shows it is in the paper.
In the paper
“These beliefs specify the attracting states (goals) that action will seek out.”
§ The anatomy of choice: active inference and agency > A generative model of agency
plaindirect- Asserted: passes — The authors put it forward as true.
- Checkable: fails — It may be too vague to check against evidence.
- Load-bearing: passes — The paper’s conclusions depend on it.
- Based: passes — The paper gives a reason why it holds.
Probably not a substantial claim. It may be too vague to check against evidence.
The paper states this without a source or data behind it here, so there is nothing to check it against. The quote shows it is in the paper.
In the paper
“The Markovian models considered here rest on transitions among hidden states that are coupled to transitions among control states.”
§ The anatomy of choice: active inference and agency > A generative model of agency > The generative model
plaincorrelational- Asserted: passes — The authors put it forward as true.
- Checkable: passes — It can be checked against evidence.
- Load-bearing: passes — The paper’s conclusions depend on it.
- Based: passes — The paper gives a reason why it holds.
Probably not a substantial claim.
A conclusion the paper draws from its own results — it cites no other source for it, so there is none to check. The quote shows it is in the paper.
In the paper
“In short, sufficient statistics and implicit posterior beliefs about the state of the world minimize free energy, while action is selected from posterior beliefs about control states.”
§ The anatomy of choice: active inference and agency > Active inference > The free-energy principle and active inference
plaindirect- Asserted: passes — The authors put it forward as true.
- Checkable: passes — It can be checked against evidence.
- Load-bearing: passes — The paper’s conclusions depend on it.
- Based: passes — The paper gives a reason why it holds.
It may state two separate claims as one.
A conclusion the paper draws from its own results — it cites no other source for it, so there is none to check. The quote shows it is in the paper.
In the paper
“These beliefs take the form of a Boltzmann distribution, where the policy with the largest prior probability minimizes the relative entropy or divergence between the distribution over final states, given the current state and policy, and the marginal distribution over final states.”
§ The anatomy of choice: active inference and agency > A generative model of agency > The generative model
plaindirect- Asserted: passes — The authors put it forward as true.
- Checkable: passes — It can be checked against evidence.
- Load-bearing: passes — The paper’s conclusions depend on it.
- Based: fails — The paper may give no reason why it holds.
Probably not a substantial claim. The paper may give no reason why it holds.
A conclusion the paper draws from its own results — it cites no other source for it, so there is none to check. The quote shows it is in the paper.
In the paper
“In summary, variational Bayes involves iterating updates to find the sufficient statistics that minimize free energy and, implicitly, provide Bayesian estimates of the hidden variables.”
§ The anatomy of choice: active inference and agency > Variational bayesian inversion > Variational updates
plaindirect- Asserted: passes — The authors put it forward as true.
- Checkable: passes — It can be checked against evidence.
- Load-bearing: passes — The paper’s conclusions depend on it.
- Based: passes — The paper gives a reason why it holds.
It may state two separate claims as one.
What the paper did — it cites no source for this, so there is none to check. The quote shows it is in the paper.
In the paper
“These updates assume the parameters of the model are known.”
§ The anatomy of choice: active inference and agency > Variational bayesian inversion > Variational updates
plain- Asserted: passes — The authors put it forward as true.
- Checkable: passes — It can be checked against evidence.
- Load-bearing: fails — The paper’s conclusions may not depend on it.
- Based: passes — The paper gives a reason why it holds.
Probably not a substantial claim. The paper’s conclusions may not depend on it.
A conclusion the paper draws from its own results — it cites no other source for it, so there is none to check. The quote shows it is in the paper.
In the paper
“This means the sufficient statistics change over two timescales—a fast timescale that updates posterior beliefs given the current observations—and a slow timescale that updates posterior beliefs as new observations become available and action is taken.”
§ The anatomy of choice: active inference and agency > Variational bayesian inversion > Variational updates
plaindirect- Asserted: passes — The authors put it forward as true.
- Checkable: passes — It can be checked against evidence.
- Load-bearing: passes — The paper’s conclusions depend on it.
- Based: passes — The paper gives a reason why it holds.
It may state two separate claims as one.
A conclusion the paper draws from its own results — it cites no other source for it, so there is none to check. The quote shows it is in the paper.
In the paper
“If we assume that neuronal activity encodes sufficient statistics, then the variational update scheme could provide a metaphor for functional segregation—the segregation of representations corresponding to the mean field assumption, and functional integration—the recursive (reciprocal) exchange of sufficient statistics during approximate Bayesian inference.”
§ The anatomy of choice: active inference and agency > The functional anatomy of decision-making
hedgedconditional- Asserted: passes — The authors put it forward as true.
- Checkable: passes — It can be checked against evidence.
- Load-bearing: passes — The paper’s conclusions depend on it.
- Based: passes — The paper gives a reason why it holds.
Probably not a substantial claim.
- The authors state this as an assumption: Neuronal activity encodes sufficient statistics.
A conclusion the paper draws from its own results — it cites no other source for it, so there is none to check. The quote shows it is in the paper.
In the paper
“The balance between exploration (entropy) and exploitation (expected value) is uniquely determined by the relative utility of future states and not by the temperature parameter—the precision or inverse temperature applies to both exploratory and utilitarian behavior (see Equation 4).”
§ The anatomy of choice: active inference and agency > A generative model of agency > Exploration, exploitation and novelty
plaindirect- Asserted: passes — The authors put it forward as true.
- Checkable: passes — It can be checked against evidence.
- Load-bearing: passes — The paper’s conclusions depend on it.
- Based: passes — The paper gives a reason why it holds.
It may state two separate claims as one.
A conclusion the paper draws from its own results — it cites no other source for it, so there is none to check. The quote shows it is in the paper.
In the paper
“The important thing about this result is that it expresses the optimal sufficient statistics of one subset in terms of the others. This allows one to iteratively re-evaluate each subset, given the others, until convergence.”
§ The anatomy of choice: active inference and agency > Variational bayesian inversion > Variational updates
plaindirect- Asserted: passes — The authors put it forward as true.
- Checkable: passes — It can be checked against evidence.
- Load-bearing: passes — The paper’s conclusions depend on it.
- Based: passes — The paper gives a reason why it holds.
It may state two separate claims as one.
A conclusion the paper draws from its own results — it cites no other source for it, so there is none to check. The quote shows it is in the paper.
In the paper
“This is remarkable because these updates are derived from basic variational principles and yet they have exactly the form of neural networks that use integrate and fire neurons—and are not dissimilar to real neurons with sigmoid activation functions.”
§ The anatomy of choice: active inference and agency > The functional anatomy of decision-making
plaincorrelational- Asserted: passes — The authors put it forward as true.
- Checkable: passes — It can be checked against evidence.
- Load-bearing: unclear — It is unclear whether the paper’s conclusions depend on it.
- Based: passes — The paper gives a reason why it holds.
It may state two separate claims as one.
A conclusion the paper draws from its own results — it cites no other source for it, so there is none to check. The quote shows it is in the paper.
In the paper
“This term can be thought of as an optimism bias in the sense that, when precision is high, perception is biased toward the state that has the greatest potential to realize the agent's goal.”
§ The anatomy of choice: active inference and agency > The functional anatomy of decision-making > Perception
plaindirect- Asserted: passes — The authors put it forward as true.
- Checkable: passes — It can be checked against evidence.
- Load-bearing: fails — The paper’s conclusions may not depend on it.
- Based: passes — The paper gives a reason why it holds.
Probably not a substantial claim. The paper’s conclusions may not depend on it.
In the paper
“If they are not, then it is relatively straightforward to extend the variational Bayesian scheme above to include variational updates for learning unknown parameters, as described in Chapter 3 of (Beal, 2003).”
§ The anatomy of choice: active inference and agency > Variational bayesian inversion > Variational updates
What the sources say
- Not checked yetcites Beal, 2003
plainconditional- Asserted: passes — The authors put it forward as true.
- Checkable: passes — It can be checked against evidence.
- Load-bearing: fails — The paper’s conclusions may not depend on it.
- Based: passes — The paper gives a reason why it holds.
Probably not a substantial claim. The paper’s conclusions may not depend on it.
A conclusion the paper draws from its own results — it cites no other source for it, so there is none to check. The quote shows it is in the paper.
In the paper
“Again, it is remarkable that this rule follows directly from basic variational principles.”
§ The anatomy of choice: active inference and agency > The functional anatomy of decision-making > Action selection
boosted- Asserted: passes — The authors put it forward as true.
- Checkable: passes — It can be checked against evidence.
- Load-bearing: fails — The paper’s conclusions may not depend on it.
- Based: passes — The paper gives a reason why it holds.
Probably not a substantial claim. The paper’s conclusions may not depend on it.
A conclusion the paper draws from its own results — it cites no other source for it, so there is none to check. The quote shows it is in the paper.
In the paper
“In short, there is an optimal precision for any context and the expected precision has to be evaluated carefully on the basis of current beliefs about the state of the world.”
§ The anatomy of choice: active inference and agency > The functional anatomy of decision-making > Evaluating precision
plaincorrelational- Asserted: passes — The authors put it forward as true.
- Checkable: passes — It can be checked against evidence.
- Load-bearing: passes — The paper’s conclusions depend on it.
- Based: passes — The paper gives a reason why it holds.
It may state two separate claims as one.
A conclusion the paper draws from its own results — it cites no other source for it, so there is none to check. The quote shows it is in the paper.
In the paper
“Crucially, every system (encoding the sufficient statistics of a marginal distribution) must receive signals from every system to which it sends signals.”
§ The anatomy of choice: active inference and agency > The functional anatomy of decision-making > Evaluating precision
plaindirect- Asserted: passes — The authors put it forward as true.
- Checkable: passes — It can be checked against evidence.
- Load-bearing: passes — The paper’s conclusions depend on it.
- Based: fails — The paper may give no reason why it holds.
Probably not a substantial claim. The paper may give no reason why it holds.
A conclusion the paper draws from its own results — it cites no other source for it, so there is none to check. The quote shows it is in the paper.
In the paper
“We have associated expected precision with dopaminergic projections from the ventral tegmental area (and substantia nigra), which must be in receipt of messages from the prefrontal cortex and striatum.”
§ The anatomy of choice: active inference and agency > The functional anatomy of decision-making > Evaluating precision
plaincorrelational- Asserted: passes — The authors put it forward as true.
- Checkable: passes — It can be checked against evidence.
- Load-bearing: passes — The paper’s conclusions depend on it.
- Based: fails — The paper may give no reason why it holds.
Probably not a substantial claim. The paper may give no reason why it holds. It may state two separate claims as one.
A conclusion the paper draws from its own results — it cites no other source for it, so there is none to check. The quote shows it is in the paper.
In the paper
“This also illustrates time-dependent transition probabilities that the variational scheme can handle with ease.”
§ The anatomy of choice: active inference and agency > Decision-making under uncertainty
plain- Asserted: passes — The authors put it forward as true.
- Checkable: passes — It can be checked against evidence.
- Load-bearing: fails — The paper’s conclusions may not depend on it.
- Based: passes — The paper gives a reason why it holds.
Probably not a substantial claim. The paper’s conclusions may not depend on it.
A conclusion the paper draws from its own results — it cites no other source for it, so there is none to check. The quote shows it is in the paper.
In the paper
“This means that the optimal precision depends upon the attainability of goals: if a goal cannot be obtained from the current state, then precision will be small—reflecting a reduced confidence in predictions about behavior.”
§ The anatomy of choice: active inference and agency > The functional anatomy of decision-making > Evaluating precision
plaindirect- Asserted: passes — The authors put it forward as true.
- Checkable: passes — It can be checked against evidence.
- Load-bearing: passes — The paper’s conclusions depend on it.
- Based: passes — The paper gives a reason why it holds.
It may state two separate claims as one.
A conclusion the paper draws from its own results — it cites no other source for it, so there is none to check. The quote shows it is in the paper.
In the paper
“In short, precision reports the expected value over states and policies and plays a dual role in biasing perceptual inference and action selection: on the one hand, it biases perceptual inference toward prior beliefs about future (choice dependent) outcomes. On the other hand, it encodes the confidence that a goal can be attained and increases the precision of action selection.”
§ The anatomy of choice: active inference and agency > The functional anatomy of decision-making > Evaluating precision
plaindirect- Asserted: passes — The authors put it forward as true.
- Checkable: passes — It can be checked against evidence.
- Load-bearing: passes — The paper’s conclusions depend on it.
- Based: passes — The paper gives a reason why it holds.
It may state two separate claims as one.
A conclusion the paper draws from its own results — it cites no other source for it, so there is none to check. The quote shows it is in the paper.
In the paper
“Conversely, if precision was too high, precise choices are made but there would be a predisposition to false perceptual inference—through the augmentation of optimism bias.”
§ The anatomy of choice: active inference and agency > The functional anatomy of decision-making > Evaluating precision
hedgeddirect- Asserted: passes — The authors put it forward as true.
- Checkable: passes — It can be checked against evidence.
- Load-bearing: passes — The paper’s conclusions depend on it.
- Based: passes — The paper gives a reason why it holds.
It may state two separate claims as one.
A conclusion the paper draws from its own results — it cites no other source for it, so there is none to check. The quote shows it is in the paper.
In the paper
“This is because neither the entropy nor the expected utility of the final state is affected by subsequent choices.”
§ The anatomy of choice: active inference and agency > Decision-making under uncertainty
plain- Asserted: passes — The authors put it forward as true.
- Checkable: passes — It can be checked against evidence.
- Load-bearing: passes — The paper’s conclusions depend on it.
- Based: passes — The paper gives a reason why it holds.
Probably not a substantial claim.
A conclusion the paper draws from its own results — it cites no other source for it, so there is none to check. The quote shows it is in the paper.
In the paper
“This is potentially important, because choice behavior can, in principle, be used to adjudicate among alternative models used by subjects.”
§ The anatomy of choice: active inference and agency > Temporal discounting and marginal utility > Marginal utility and precision
plainconditional- Asserted: passes — The authors put it forward as true.
- Checkable: passes — It can be checked against evidence.
- Load-bearing: fails — The paper’s conclusions may not depend on it.
- Based: fails — The paper may give no reason why it holds.
Probably not a substantial claim. The paper’s conclusions may not depend on it. The paper may give no reason why it holds.
A conclusion the paper draws from its own results — it cites no other source for it, so there is none to check. The quote shows it is in the paper.
In the paper
“The form of temporal discounting depends upon the generative model and can be quite complicated.”
§ The anatomy of choice: active inference and agency > Temporal discounting and marginal utility > Temporal discounting
plaindirect- Asserted: passes — The authors put it forward as true.
- Checkable: passes — It can be checked against evidence.
- Load-bearing: passes — The paper’s conclusions depend on it.
- Based: passes — The paper gives a reason why it holds.
It may state two separate claims as one.
A conclusion the paper draws from its own results — it cites no other source for it, so there is none to check. The quote shows it is in the paper.
In the paper
“Generally, when relative utilities are large, they will dominate value (overshadowing entropy) and behavior will conform to expected utility theory.”
§ The anatomy of choice: active inference and agency > Temporal discounting and marginal utility
plaindirect- Asserted: passes — The authors put it forward as true.
- Checkable: passes — It can be checked against evidence.
- Load-bearing: unclear — It is unclear whether the paper’s conclusions depend on it.
- Based: passes — The paper gives a reason why it holds.
It may state two separate claims as one.
In the paper
“Temporal discounting is an emergent property of Bayes optimal inference about choice behavior that depends upon the generative model and, implicitly, prior beliefs about time sensitive contingencies—or at least it can be formulated as such (Sozou, 1998).”
§ The anatomy of choice: active inference and agency > Temporal discounting and marginal utility > Temporal discounting
What the sources say
- Not checked yetcites Sozou, 1998
hedgeddirect- Asserted: passes — The authors put it forward as true.
- Checkable: passes — It can be checked against evidence.
- Load-bearing: passes — The paper’s conclusions depend on it.
- Based: passes — The paper gives a reason why it holds.
It may state two separate claims as one.
A conclusion the paper draws from its own results — it cites no other source for it, so there is none to check. The quote shows it is in the paper.
In the paper
“To understand the nature of temporal discounting, one has to understand the generative model upon which that discounting is based—and use observed choice behaviors to select among competing models or hypotheses.”
§ The anatomy of choice: active inference and agency > Temporal discounting and marginal utility > Temporal discounting
plaindirect- Asserted: passes — The authors put it forward as true.
- Checkable: passes — It can be checked against evidence.
- Load-bearing: passes — The paper’s conclusions depend on it.
- Based: passes — The paper gives a reason why it holds.
It may state two separate claims as one.
None of the sources cited for this claim have been checked yet.
In the paper
“In this sense, it mediates the affordance of cues that elicit motor behavior (Cisek, 2007); in much the same way that attention mediates the salience of cues in the perceptual domain.” (Friston et al., 2012b, p. 2).”
§ The anatomy of choice: active inference and agency > Decision-making under uncertainty
What the sources say
- Not checked yetcites Cisek, 2007
- Not checked yetcites Friston et al., 2012b
plaindirect- Asserted: passes — The authors put it forward as true.
- Checkable: passes — It can be checked against evidence.
- Load-bearing: passes — The paper’s conclusions depend on it.
- Based: passes — The paper gives a reason why it holds.
It may state two separate claims as one.
A conclusion the paper draws from its own results — it cites no other source for it, so there is none to check. The quote shows it is in the paper.
In the paper
“In this setting, the ability to compare different formulations of approximate Bayesian inference (in terms of different mean field approximations and prior beliefs) becomes crucial—because different formulations correspond to different hypotheses about how subjects optimize their behavior.”
§ The anatomy of choice: active inference and agency > Conclusion
plaincorrelational- Asserted: passes — The authors put it forward as true.
- Checkable: fails — It may be too vague to check against evidence.
- Load-bearing: passes — The paper’s conclusions depend on it.
- Based: passes — The paper gives a reason why it holds.
Probably not a substantial claim. It may be too vague to check against evidence.
A conclusion the paper draws from its own results — it cites no other source for it, so there is none to check. The quote shows it is in the paper.
In the paper
“Variational Bayes induces distinct probabilistic representations (functional segregation) of hidden states, control states and precision—and highlights the role of reciprocal message passing.”
§ The anatomy of choice: active inference and agency > Conclusion
plaindirect- Asserted: passes — The authors put it forward as true.
- Checkable: passes — It can be checked against evidence.
- Load-bearing: passes — The paper’s conclusions depend on it.
- Based: passes — The paper gives a reason why it holds.
It may state two separate claims as one.
None of the sources cited for this claim have been checked yet.
In the paper
“More generally, the theoretical approach adopted in this paper highlights the necessarily intimate relationship between inferring states of the world and optimal behavior (Toussaint and Storkey, 2006; Gläscher et al., 2010), the confidence or precision of that inference (De Martino et al., 2012), and the functional plurality of dopaminergic neuromodulation (Schultz, 2007).”
§ The anatomy of choice: active inference and agency > Conclusion
What the sources say
- Not checked yetcites Toussaint and Storkey, 2006
- Not checked yetcites Gläscher et al., 2010
- Not checked yetcites De Martino et al., 2012
plaincorrelational- Asserted: passes — The authors put it forward as true.
- Checkable: passes — It can be checked against evidence.
- Load-bearing: passes — The paper’s conclusions depend on it.
- Based: passes — The paper gives a reason why it holds.
Probably not a substantial claim. It may state two separate claims as one.
A conclusion the paper draws from its own results — it cites no other source for it, so there is none to check. The quote shows it is in the paper.
In the paper
“This can be formalized in terms of prior beliefs that controlled state transitions minimize a relative entropy or KL divergence—endowing behavior with a purpose that can be characterized by the states we believe should be occupied.”
§ The anatomy of choice: active inference and agency > Conclusion
plaindirect- Asserted: passes — The authors put it forward as true.
- Checkable: passes — It can be checked against evidence.
- Load-bearing: passes — The paper’s conclusions depend on it.
- Based: fails — The paper may give no reason why it holds.
Probably not a substantial claim. The paper may give no reason why it holds.
A conclusion the paper draws from its own results — it cites no other source for it, so there is none to check. The quote shows it is in the paper.
In the paper
“This paper has considered agency from a rather elementary and formal perspective; namely, that a sense of agency rests upon prior beliefs about how one will behave.”
§ The anatomy of choice: active inference and agency > Conclusion
plaindirect- Asserted: passes — The authors put it forward as true.
- Checkable: passes — It can be checked against evidence.
- Load-bearing: passes — The paper’s conclusions depend on it.
- Based: fails — The paper may give no reason why it holds.
Probably not a substantial claim. The paper may give no reason why it holds.
A conclusion the paper draws from its own results — it cites no other source for it, so there is none to check. The quote shows it is in the paper.
In the paper
“This may be particularly important for expected precision that is required for optimal inference about hidden states (perception) and control states (action selection).”
§ The anatomy of choice: active inference and agency > Conclusion
hedgedconditional- Asserted: passes — The authors put it forward as true.
- Checkable: fails — It may be too vague to check against evidence.
- Load-bearing: passes — The paper’s conclusions depend on it.
- Based: passes — The paper gives a reason why it holds.
Probably not a substantial claim. It may be too vague to check against evidence.
In the paper
“In reinforcement learning, there is an important distinction between model-free and model-based systems (Daw et al., 2005).”
§ The anatomy of choice: active inference and agency > Conclusion
What the sources say
- Not checked yetcites Daw et al., 2005
plain- Asserted: passes — The authors put it forward as true.
- Checkable: passes — It can be checked against evidence.
- Load-bearing: passes — The paper’s conclusions depend on it.
- Based: passes — The paper gives a reason why it holds.
Probably not a substantial claim.
A conclusion the paper draws from its own results — it cites no other source for it, so there is none to check. The quote shows it is in the paper.
In the paper
“Variational Bayes provides a formal account of how posterior expectations about hidden states of the world, control states and precision depend upon each other; and may provide a metaphor for message passing in the brain.”
§ The anatomy of choice: active inference and agency > Conclusion
hedgedcorrelational- Asserted: passes — The authors put it forward as true.
- Checkable: passes — It can be checked against evidence.
- Load-bearing: passes — The paper’s conclusions depend on it.
- Based: fails — The paper may give no reason why it holds.
Probably not a substantial claim. The paper may give no reason why it holds. It may state two separate claims as one.
A conclusion the paper draws from its own results — it cites no other source for it, so there is none to check. The quote shows it is in the paper.
In the paper
“The ensuing scheme appears to have construct validity in relation to normative accounts in psychology and economics.”
§ The anatomy of choice: active inference and agency > Conclusion
hedgedcorrelational- Asserted: passes — The authors put it forward as true.
- Checkable: fails — It may be too vague to check against evidence.
- Load-bearing: passes — The paper’s conclusions depend on it.
- Based: fails — The paper may give no reason why it holds.
Probably not a substantial claim. It may be too vague to check against evidence. The paper may give no reason why it holds.
A conclusion the paper draws from its own results — it cites no other source for it, so there is none to check. The quote shows it is in the paper.
In the paper
“This enables higher levels to contextualize lower level (reflexive or habitual) inference and consequent action selection.”
§ The anatomy of choice: active inference and agency > Conclusion
plaindirect- Asserted: passes — The authors put it forward as true.
- Checkable: passes — It can be checked against evidence.
- Load-bearing: passes — The paper’s conclusions depend on it.
- Based: passes — The paper gives a reason why it holds.
Probably not a substantial claim.
A conclusion the paper draws from its own results — it cites no other source for it, so there is none to check. The quote shows it is in the paper.
In the paper
“This means that both expectations about behavior and the precision of these beliefs have to be optimized.”
§ The anatomy of choice: active inference and agency > Conclusion
plain- Asserted: passes — The authors put it forward as true.
- Checkable: passes — It can be checked against evidence.
- Load-bearing: passes — The paper’s conclusions depend on it.
- Based: passes — The paper gives a reason why it holds.
It may state two separate claims as one.
A conclusion the paper draws from its own results — it cites no other source for it, so there is none to check. The quote shows it is in the paper.
In the paper
“Value can be equated with negative divergence and comprises entropy (exploration or novelty bonus) and expected utility (utilitarian) terms that account for exploratory and exploitative behavior respectively.”
§ The anatomy of choice: active inference and agency > Conclusion
plaincorrelational- Asserted: passes — The authors put it forward as true.
- Checkable: passes — It can be checked against evidence.
- Load-bearing: passes — The paper’s conclusions depend on it.
- Based: passes — The paper gives a reason why it holds.
Probably not a substantial claim. It may state two separate claims as one.
In the paper
“It is the optimization of precision that provides a complete account of bounded rationality (approximate Bayesian inference) and a putative account of the control of dopaminergic firing; cf. (Gurney et al., 2001).”
§ The anatomy of choice: active inference and agency > Conclusion
What the sources say
- Not checked yetcites Gurney et al., 2001
hedgeddirect- Asserted: passes — The authors put it forward as true.
- Checkable: passes — It can be checked against evidence.
- Load-bearing: passes — The paper’s conclusions depend on it.
- Based: passes — The paper gives a reason why it holds.
It may state two separate claims as one.
A conclusion the paper draws from its own results — it cites no other source for it, so there is none to check. The quote shows it is in the paper.
In the paper
“Irrespective of how these beliefs are described, they must—in some sense—entail the belief that our behavior will converge on outcomes that define who we are—in terms of our characteristic states.”
§ The anatomy of choice: active inference and agency > Conclusion
plaindirect- Asserted: passes — The authors put it forward as true.
- Checkable: fails — It may be too vague to check against evidence.
- Load-bearing: passes — The paper’s conclusions depend on it.
- Based: fails — The paper may give no reason why it holds.
Probably not a substantial claim. It may be too vague to check against evidence. The paper may give no reason why it holds.
None of the sources cited for this claim have been checked yet.
In the paper
“This account considers dopamine to report the precision of divergence or prediction errors (in their nuanced or non-classical sense) and partly resolves the dialectic between dopamine as reporting reward prediction errors (Schultz et al., 1997) and the predictability of rewards (Fiorillo et al., 2003; Redgrave and Gurney, 2006; Schultz et al., 2008).”
§ The anatomy of choice: active inference and agency > Conclusion
What the sources say
- Not checked yetcites Schultz et al., 1997
- Not checked yetcites Fiorillo et al., 2003
- Not checked yetcites Redgrave and Gurney, 2006
hedgeddirect- Asserted: passes — The authors put it forward as true.
- Checkable: passes — It can be checked against evidence.
- Load-bearing: passes — The paper’s conclusions depend on it.
- Based: passes — The paper gives a reason why it holds.
It may state two separate claims as one.
A conclusion the paper draws from its own results — it cites no other source for it, so there is none to check. The quote shows it is in the paper.
In the paper
“In contrast, active inference is quintessentially model-based—so does this preclude model-free schemes?”
§ The anatomy of choice: active inference and agency > Conclusion
boosted- Asserted: passes — The authors put it forward as true.
- Checkable: passes — It can be checked against evidence.
- Load-bearing: passes — The paper’s conclusions depend on it.
- Based: fails — The paper may give no reason why it holds.
Probably not a substantial claim. The paper may give no reason why it holds.
A conclusion the paper draws from its own results — it cites no other source for it, so there is none to check. The quote shows it is in the paper.
In the paper
“Furthermore, the computational anatomy afforded by variational Bayes fits comfortably with neuronal message passing in the brain.”
§ The anatomy of choice: active inference and agency > Conclusion
plaincorrelational- Asserted: passes — The authors put it forward as true.
- Checkable: fails — It may be too vague to check against evidence.
- Load-bearing: fails — The paper’s conclusions may not depend on it.
- Based: fails — The paper may give no reason why it holds.
Probably not a substantial claim. It may be too vague to check against evidence. The paper’s conclusions may not depend on it. The paper may give no reason why it holds.
A conclusion the paper draws from its own results — it cites no other source for it, so there is none to check. The quote shows it is in the paper.
In the paper
“Active inference accommodates the distinction between model-free and model-based by placing model-free schemes at the lower levels of hierarchical generative models.”
§ The anatomy of choice: active inference and agency > Conclusion
plaindirect- Asserted: passes — The authors put it forward as true.
- Checkable: passes — It can be checked against evidence.
- Load-bearing: passes — The paper’s conclusions depend on it.
- Based: fails — The paper may give no reason why it holds.
Probably not a substantial claim. The paper may give no reason why it holds.
A conclusion the paper draws from its own results — it cites no other source for it, so there is none to check. The quote shows it is in the paper.
In the paper
“The advantage of having a variational scheme with dynamics (that can be applied to these models) is that, in principle, one can localize the neuronal correlates of implicit Bayesian updates with neuroimaging.”
§ The anatomy of choice: active inference and agency > Conclusion
plainconditional- Asserted: passes — The authors put it forward as true.
- Checkable: passes — It can be checked against evidence.
- Load-bearing: fails — The paper’s conclusions may not depend on it.
- Based: fails — The paper may give no reason why it holds.
Probably not a substantial claim. The paper’s conclusions may not depend on it. The paper may give no reason why it holds.
A conclusion the paper draws from its own results — it cites no other source for it, so there is none to check. The quote shows it is in the paper.
In the paper
“In other words, precision has to nuance an inherent optimism bias when inferring the current state of the world.”
§ The anatomy of choice: active inference and agency > Conclusion
plaindirect- Asserted: passes — The authors put it forward as true.
- Checkable: fails — It may be too vague to check against evidence.
- Load-bearing: passes — The paper’s conclusions depend on it.
- Based: fails — The paper may give no reason why it holds.
Probably not a substantial claim. It may be too vague to check against evidence. The paper may give no reason why it holds.
A conclusion the paper draws from its own results — it cites no other source for it, so there is none to check. The quote shows it is in the paper.
In the paper
“Beliefs about the state of the world depend upon expected value over choices, while beliefs about choices depend upon expected value over states.”
§ The anatomy of choice: active inference and agency > Conclusion
plaindirect- Asserted: passes — The authors put it forward as true.
- Checkable: passes — It can be checked against evidence.
- Load-bearing: passes — The paper’s conclusions depend on it.
- Based: passes — The paper gives a reason why it holds.
It may state two separate claims as one.
A conclusion the paper draws from its own results — it cites no other source for it, so there is none to check. The quote shows it is in the paper.
In the paper
“However, exact Bayesian inference (perfect rationality) cannot be realized physically, which means that optimal behavior rests on approximate Bayesian inference (bounded rationality).”
§ The anatomy of choice: active inference and agency > Conclusion
plaindirect- Asserted: passes — The authors put it forward as true.
- Checkable: passes — It can be checked against evidence.
- Load-bearing: passes — The paper’s conclusions depend on it.
- Based: fails — The paper may give no reason why it holds.
Probably not a substantial claim. The paper may give no reason why it holds. It may state two separate claims as one.
In the paper
“Interestingly, this is precisely the (Variational Laplace) scheme used routinely in data analysis (Friston et al., 2007).”
§ The anatomy of choice: active inference and agency > Conclusion
What the sources say
- Not checked yetcites Friston et al., 2007
plain- Asserted: passes — The authors put it forward as true.
- Checkable: passes — It can be checked against evidence.
- Load-bearing: fails — The paper’s conclusions may not depend on it.
- Based: passes — The paper gives a reason why it holds.
Probably not a substantial claim. The paper’s conclusions may not depend on it.
The authors state this as an assumption.
Policies are selected under the prior belief that they minimize the divergence, or relative entropy, between a probability distribution over states that can be reached and states agents believe they should occupy, which are states or goals believed a priori to have high utility.
“We assume that policies are selected under the prior belief1 they minimize the divergence (relative entropy) between a probability distribution over states that can be reached and states agents believe they should occupy—states or goals that agents believe, a priori, have high utility.”
The authors state this as an assumption.
Action is sampled from posterior beliefs about control states.
“In other words, under the assumption that action is sampled from posterior beliefs about control, we can treat decision-making and action selection as a pure inference problem that necessarily entails optimizing beliefs about behavior and its consequences.”
The authors state this as an assumption.
The agent knows its past actions by observing them.
“For simplicity, we have assumed that the agent knows its past actions by observing them.”
The authors state this as an assumption.
Inference underlies a sense of agency.
“In the context of behavior, we suppose that inference underlies a sense of agency.”
The authors state this as an assumption.
The true generative process is Markovian.
“These particular mean field assumptions are not approximations, because the true generative process is Markovian.”
The authors state this as an assumption.
Neuronal activity encodes sufficient statistics.
“If we assume that neuronal activity encodes sufficient statistics, then the variational update scheme could provide a metaphor for functional segregation—the segregation of representations corresponding to the mean field assumption, and functional integration—the recursive (reciprocal) exchange of sufficient statistics during approximate Bayesian inference.”
The authors state this as an assumption.
The approximate posterior factorizes over past hidden states, future control states, and precision, and factorizes successive states over time.
“Here, we have assumed a factorization over (past) hidden states, (future) control states and precision. Furthermore, we have factorized successive states over time, which means we only have to represent the current state explicitly.”
The authors state this as an assumption.
The approximate marginal over precision is a gamma distribution with shape parameter same as the prior α = 8 and rate parameter optimized.
“Equation (6) assumes the approximate marginal over precision is, like its conjugate prior, a gamma distribution; where the shape parameter is the same as the prior α = 8 and the rate parameter is optimized.”
The authors state this as an assumption.
The entropy term in Equation (4) is small enough to be ignored.
“Assuming the entropy term in Equation (4) small enough to be ignored, it is easy to see that expected marginal utility directly informs choices: (10)”
The paper relies on this without support.
The offer will be withdrawn before the final outcome is reached (prior belief).
“can be explained simply by prior beliefs that the offer will be withdrawn before the final outcome is reached.”
Claims other papers make about this one
Each is checked against this paper’s own text: does it say what the citing paper says it does?
The cited source says what the claim attributes to it.
In the citing paper
“In Active Inference models of choice behaviour (Friston et al., 2014, Friston et al., 2013), precision reports opportunities to achieve a goal (or more precisely, confidence in the opportunities) that invigorate and select action; see Fig. 7.”
From Active Inference, homeostatic regulation and adaptive behavioural control (2015) · cites this paper as Friston et al., 2013
The cited source says what the claim attributes to it.
In the citing paper
“The HGF derivation explicitly includes update equations for the precision associated with beliefs - as do other hierarchical Bayesian architectures based on Markovian processes [Friston et al., 2013].”
From The generalized Hierarchical Gaussian Filter (2026) · cites this paper as Friston et al., 2013
Self-check
Percentages, sums and reported differences re-computed from the paper’s own numbers.
Each contradiction between two passages listed here was confirmed by an independent check.
Rated minor: it would not touch a result — a value no result rests on, a p-value that stays on the same side of the significance level, or a conflict that is clerical, resolved elsewhere in the paper, or outside its own findings.
In the paper
§ The anatomy of choice: active inference and agency > Decision-making under uncertainty
“The expected probabilities of staying (rejecting) or shifting (accepting) are shown in the upper right panel (in green and blue, respectively)”
§ The anatomy of choice: active inference and agency > Decision-making under uncertainty
“Blue corresponds to reject (stay) and green to accept (shift).”
Citations
Cites
Prospect Theory: An Analysis of Decision under Risk
Kahneman, D., & Tversky, A. (1979) · Econometrica · doi:10.2307/1914185 · Cited by 48,524
Prospect theory: An analysis of decision under risk
Kahneman, D. J., & Tversky, A. (1988) · Cambridge University Press eBooks · doi:10.1017/cbo9780511609220.014 · Cited by 32,720
Reinforcement Learning: An Introduction
Sutton, R. S., & Barto, A. G. (1998) · IEEE Transactions on Neural Networks · doi:10.1109/tnn.1998.712192 · Cited by 27,225
Reinforcement Learning: An Introduction
Sutton, R. S., & Barto, A. (2005) · IEEE Transactions on Neural Networks · doi:10.1109/tnn.2004.842673 · Cited by 25,268
Theory of games and economic behavior
Garcia, S. R., & Miller, S. J. (2019) · American Mathematical Society eBooks · doi:10.1090/mbk/121/32 · Cited by 16,777
Information theory and statistical mechanics
Jaynes, E. T. (1957) · Physical Review · doi:10.1103/physrev.106.620 · Cited by 12,931
Chapter 12: What does the Anthropocene hold for citizenship?
(2019) · edoc (University of Basel) · doi:10.1007/978-3 · Cited by 11,533
A neural substrate of prediction and reward
Schultz, W., Dayan, P., & Montague, P. R. (1997) · Science · doi:10.1126/science.275.5306.1593 · Cited by 9,388
Watkins, C. J. C. H., & Dayan, P. (1992) · Machine Learning · doi:10.1007/bf00992698 · Cited by 9,083
The free-energy principle: a unified brain theory?
Friston, K. (2010) · Nature Reviews Neuroscience · doi:10.1038/nrn2787 · Cited by 8,120 · cited 3×
“This idea has been formalized recently as minimizing a variational free energy bound on Bayesian model evidence—to provide a seamless link between occupying a limited number of attracting states and Bayesian inference about the causes of sensory input (Dayan et al., 1995; Friston, 2010).”
BackgroundSelf-citation
Cited by
Sorted by citations
Active inference: a process theory
Friston, K., FitzGerald, T., Rigoli, F., Schwartenbeck, P., & Pezzulo, G. (2017) · Neural Computation · doi:10.1162/neco_a_00912 · Cited by 1,156
Self-citationSense of agency in the human brain
Haggard, P. (2017) · Nature Reviews Neuroscience · doi:10.1038/nrn.2017.14 · Cited by 1,107
Active inference and epistemic value
Friston, K., Rigoli, F., Ognibene, D., Mathys, C., Fitzgerald, T., & Pezzulo, G. (2015) · Cognitive Neuroscience · doi:10.1080/17588928.2015.1020053 · Cited by 731
Self-citationActive Inference, homeostatic regulation and adaptive behavioural control
Pezzulo, G., Rigoli, F., & Friston, K. (2015) · Progress in Neurobiology · doi:10.1016/j.pneurobio.2015.09.001 · Cited by 650
“See Friston et al. (2013) for a formal example using Markov decision processes.”
Self-citationFriston, K., FitzGerald, T., Rigoli, F., Schwartenbeck, P., O⿿Doherty, J., & Pezzulo, G. (2016) · Neuroscience & Biobehavioral Reviews · doi:10.1016/j.neubiorev.2016.06.022 · Cited by 674
Self-citation
Metadata
- Authors
- Friston, K., Schwartenbeck, P., FitzGerald, T., Moutoussis, M., Behrens, T., & Dolan, R. J.
- Affiliations
- Wellcome Centre for Human Neuroimaging (GB)
- University College London (GB)
- University of Oxford (GB)
- Corresponding author
- Friston, Karl
- ORCID
- Venue
- Frontiers in Human Neuroscience
- Publisher
- Frontiers Media SA
- Published
- 2013
- Volume
- 7
- Pages
- 598-598
- ISSN
- 1662-5161 (ISSN-L)
- PMC
- PMC3782702
- OpenAlex
- W2093466600
- Semantic Scholar
- 3144baaeb4cab2bf48a8140de03080c03c4488b9
- Cited by
- 340
- References
- 97
- Citations by year
- 2026: 15 · 2025: 23 · 2024: 28 · 2023: 22 · 2022: 27 · 2021: 37 · 2020: 32 · 2019: 23 · 2018: 24 · 2017: 32 · 2016: 25 · 2015: 24 · 2014: 27 · 2013: 1
- FWCI
- 14.08
- Type
- journal article
- Language
- en
- Open access
- gold
- doi.org
- Licence
- cc-by
- Locations
- Frontiers in Human Neuroscience (publishedVersion, cc-by)
- Europe PMC (PubMed Central) (publishedVersion, cc-by)
- PubMed Central (publishedVersion, cc-by)
- PubMed (publishedVersion)
- DOAJ (DOAJ: Directory of Open Access Journals) (submittedVersion, cc-by-sa)
- UCL Discovery (University College London) (submittedVersion)
- Max Planck Digital Library (submittedVersion)
- MPG.PuRe (Max Planck Society) (submittedVersion)
- UEA Digital Repository (University of East Anglia) (submittedVersion)
- Funders
- Wellcome Trust (091593, 098362, 098362/Z/12/Z, 088130)
- National Institute for Health and Care Research
- Topics
- Life Sciences › Neuroscience › Cognitive Neuroscience › Embodied and Extended Cognition
- Social Sciences › Arts and Humanities › Philosophy › Free Will and Agency
- Social Sciences › Decision Sciences › General Decision Sciences › Decision-Making and Behavioral Economics
- Keywords
- active inference, sense of agency, free energy principle, variational inference, predictive coding, bounded rationality, expected utility, exploration bonus, optimism bias, Kullback-Leibler divergence, decision-making, inverse temperature, optimal control
About these checks
Registry, retraction, Cites and statistics results are computed, not judged, with one exception: a printed reference that no index lists is read once by a model before it counts as a citation error. Claims are extracted by a model and kept only when their quote appears verbatim in the text; each cited source is then checked, with a model’s help, for whether it says what the claim relies on. Those verdicts can be wrong — read the claim’s quote and the cited source before relying on one.
A language model drew the claims from the paper on 2026-10-09, under version 3 of the claim definition (model deepseek-v4.1-flash, prompt extract-v3).
A second model labelled each claim on 2026-10-09 (model jev-1.13-20260917, definition revision gold-guideline-v0.2).
Statistics and arithmetic are recomputed, not judged.
Confidence bands are shown only for fields calibrated on our annotated test set. None is calibrated yet, so no band is shown.
What counts as a claim ›How we measure confidence ›How we check this ›
Are you an author, or do you see a problem with this page? Request a review
