

The DOI matches its Crossref record; 196 of the 197 references it cites were found in a registry or an index.
When Null Hypothesis Significance Testing Is Unsuitable for Research: A Reassessment
Open accessPublished version of a preprint
Abstract
Null hypothesis significance testing (NHST) has several shortcomings that are likely contributing factors behind the widely debated replication crisis of (cognitive) neuroscience, psychology, and biomedical science in general. We review these shortcomings and suggest that, after sustained negative experience, NHST should no longer be the default, dominant statistical practice of all biomedical and psychological research. If theoretical predictions are weak we should not rely on all or nothing hypothesis tests. Different inferential methods may be most suitable for different types of research questions. Whenever researchers use NHST they should justify its use, and publish pre-study power calculations and effect sizes, including negative findings. Hypothesis-testing studies should be pre-registered and optimally raw data published. The current statistics lite educational approach for students that has sustained the widespread, spurious use of NHST should be phased out.
Overview
The claims and statistics of this paper haven’t been checked yet.
Run the check — free, no account needed. It reads the open-access text and checks the sources it cites.
Integrity signals
Registry
Cites
Statistics
Figures
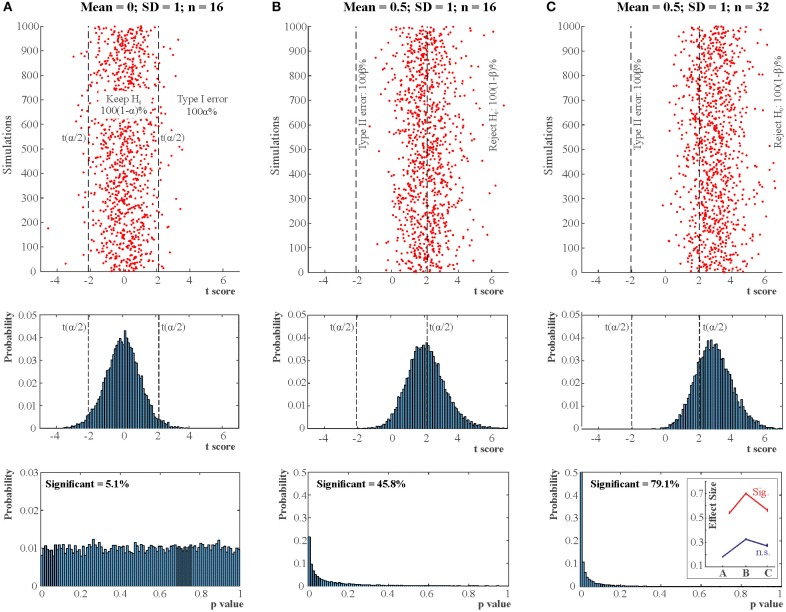
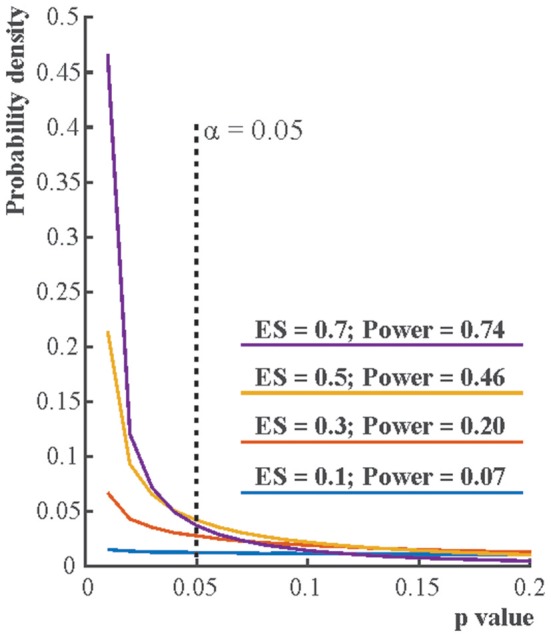
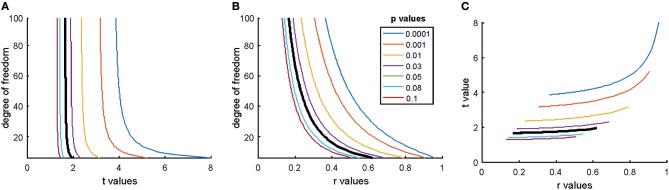
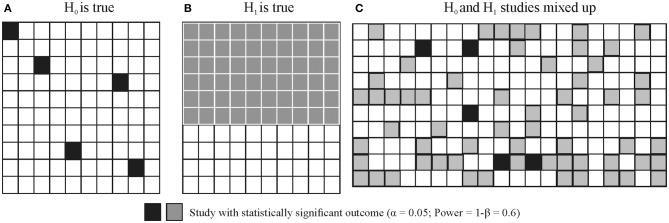
Verification
Claims the paper makes
The claims and statistics of this paper haven’t been checked yet.
Run the check — free, no account needed. It reads the open-access text and checks the sources it cites.
Claims other papers make about this one
Each is checked against this paper’s own text: does it say what the citing paper says it does?
The source backs part of the claim, not all of it — or backs it for a different population, condition or comparison.
In the citing paper
“In cases where complications arise it can be extremely useful to analyse the data with multiple methods to test the robustness of conclusions24,126.”
From A phylogenetic approach to comparative genomics (2025) · cites this paper as [126]
Experimental — accuracy not yet measuredIn the citing paper
“The use of statistical methods has been demonstrated to be suboptimal in some fields.”
From How to design preclinical studies in nanomedicine and cell therapy to maximize the prospects of clinical translation (2018) · cites this paper as [19]
In the citing paper
“Major threats that have high prevalence include the misuse and misinterpretation of null-hypothesis testing methods19,20”
From How to design preclinical studies in nanomedicine and cell therapy to maximize the prospects of clinical translation (2018) · cites this paper as [19]
Self-check
Percentages, sums and reported differences re-computed from the paper’s own numbers.
The self-check needs the paper’s full text.
Citations
Cites
Controlling the False Discovery Rate: A Practical and Powerful Approach to Multiple Testing
Benjamini, Y., & Hochberg, Y. (1995) · Journal of the Royal Statistical Society Series B: Statistical Methodology · doi:10.1111/j.2517-6161.1995.tb02031.x · Cited by 109,482
Gelman, A., Carlin, J. B., Stern, H. S., & Rubin, D. B. (2003) · doi:10.1201/9780429258480 · Cited by 27,276
(1988) · Cited by 16,582
Why Most Published Research Findings Are False
Ioannidis, J. P. A. (2005) · PLoS Medicine · doi:10.1371/journal.pmed.0020124 · Cited by 10,505
Self-citationThe control of the false discovery rate in multiple testing under dependency
Benjamini, Y., & Yekutieli, D. (2001) · The Annals of Statistics · doi:10.1214/aos/1013699998 · Cited by 10,490
Statistical significance for genomewide studies
Storey, J. D., & Tibshirani, R. (2003) · Proceedings of the National Academy of Sciences · doi:10.1073/pnas.1530509100 · Cited by 9,692
Estimating the reproducibility of psychological science
Open Science Collaboration (2015) · Science · doi:10.1126/science.aac4716 · Cited by 8,515 · cited 2×
“, 2014) are in a crisis of producing too many false positive non-replicable results (Begley and Ellis, 2012; Aarts et al., 2015).”
BackgroundStatistical Decision Theory and Bayesian Analysis
Berger, J. O. (1985) · Springer Series in Statistics · doi:10.1007/978-1-4757-4286-2 · Cited by 7,722
Power failure: why small sample size undermines the reliability of neuroscience
Button, K. S., Ioannidis, J. P. A., Mokrysz, C., Nosek, B. A., Flint, J., Robinson, E. S. J., & Munafò, M. R. (2013) · Nature Reviews Neuroscience · doi:10.1038/nrn3475 · Cited by 7,641 · cited 6×
“While power in principle can be adjusted easily by increasing sample size, power in many/most fields of biomedical science and psychology has been notoriously low and the situation has not improved much during the past 50 years (Cohen, 1962; Sedlmeier and Gigerenzer, 1989; Rossi, 1990; Hallahan and Rosenthal, 1996; Bu…”
BackgroundInfluentialSelf-citationSimmons, J. P., Nelson, L. D., & Simonsohn, U. (2011) · Psychological Science · doi:10.1177/0956797611417632 · Cited by 6,567
Research works printed but not linked: 5
- Chaisson, 2017, Astronomy Today
- Cohen, 1988, Statistical Power Analysis for the Behavioural Sciences
- Fisher, 1925, Statistical Methods for Research Workers, First Edition.
- Jeffreys, The Theory of Probability.
- Smolin, 2006, The Trouble with Physics
Cited by
Sorted by citations
Brysbaert, M. (2019) · Journal of Cognition · doi:10.5334/joc.72 · Cited by 996
Reporting guidelines for human microbiome research: the STORMS checklist
Mirzayi, C. A., Renson, A., Massive Analysis and Quality Control Society, Furlanello, C., Sansone, S., Zohra, F., Elsafoury, S., Geistlinger, L., Kasselman, L. J., Eckenrode, K. B., et al. (2021) · Nature Medicine · doi:10.1038/s41591-021-01552-x · Cited by 587
Szucs, D., & Ioannidis, J. P. (2020) · NeuroImage · doi:10.1016/j.neuroimage.2020.117164 · Cited by 453
Self-citationKline, R. B. (2018) · Canadian Studies in Population · doi:10.25336/csp29418 · Cited by 336
Bayesian Random-Effects Meta-Analysis Using the bayesmeta R Package
Röver, C. (2020) · Journal of Statistical Software · doi:10.18637/jss.v093.i06 · Cited by 310
Metadata
- Authors
- Szucs, D., & Ioannidis, J. P. A.
- Affiliations
- Stanford Medicine (US)
- Venue
- Frontiers in Human Neuroscience
- Publisher
- Frontiers Media SA
- Published
- 2017-08-03
- Volume
- 11
- Pages
- 390-390
- ISSN
- 1662-5161 (ISSN-L)
- PMC
- PMC5540883
- OpenAlex
- W2951307730
- Cited by
- 298
- References
- 197
- Citations by year
- 2026: 18 · 2025: 28 · 2024: 21 · 2023: 34 · 2022: 44 · 2021: 31 · 2020: 48 · 2019: 39 · 2018: 29 · 2017: 6
- FWCI
- 6.14
- Type
- journal article
- Language
- en
- Open access
- gold
- doi.org
- Licence
- cc-by
- Locations
- Frontiers in Human Neuroscience (publishedVersion, cc-by)
- bioRxiv (Cold Spring Harbor Laboratory) (acceptedVersion, cc-by-nc-nd)
- PubMed Central (publishedVersion, cc-by)
- PubMed (publishedVersion)
- DOAJ (DOAJ: Directory of Open Access Journals) (submittedVersion, cc-by-sa)
- Apollo (University of Cambridge) (submittedVersion, cc-by)
- Apollo (cc-by)
- Funders
- James S. McDonnell Foundation (220020370)
- Topics
- Physical Sciences › Mathematics › Statistics and Probability › Statistical Methods and Bayesian Inference
- Social Sciences › Decision Sciences › Statistics, Probability and Uncertainty › Meta-analysis and systematic reviews
- Physical Sciences › Mathematics › Statistics and Probability › Statistics Education and Methodologies
- Keywords
- null hypothesis significance testing, replication crisis, statistical inference, preregistration, power analysis, effect size, negative results, statistics education, research methodology critique, hypothesis testing
About these checks
Registry, retraction, Cites and statistics results are computed, not judged, with one exception: a printed reference that no index lists is read once by a model before it counts as a citation error. Claims are extracted by a model and kept only when their quote appears verbatim in the text; each cited source is then checked, with a model’s help, for whether it says what the claim relies on. Those verdicts can be wrong — read the claim’s quote and the cited source before relying on one.
Statistics and arithmetic are recomputed, not judged.
Confidence bands are shown only for fields calibrated on our annotated test set. None is calibrated yet, so no band is shown.
What counts as a claim ›How we measure confidence ›How we check this ›
Are you an author, or do you see a problem with this page? Request a review
