

The DOI matches its Crossref record; 51 of the 51 references it cites were found in a registry or an index.
Microstructure Informed Tractography: Pitfalls and Open Challenges
Open accessAbstract
One of the major limitations of diffusion MRI tractography is that the fiber tracts recovered by existing algorithms are not truly quantitative. Local techniques for estimating more quantitative features of the tissue microstructure exist, but their combination with tractography has always been considered intractable. Recent advances in local and global modeling made it possible to fill this gap and a number of promising techniques for microstructure informed tractography have been suggested, opening new and exciting perspectives for the quantification of brain connectivity. The ease-of-use of the proposed solutions made it very attractive for researchers to include such advanced methods in their analyses; however, this apparent simplicity should not hide some critical open questions raised by the complexity of these very high-dimensional problems, otherwise some fundamental issues may be pushed into the background. The aim of this article is to raise awareness in the diffusion MRI community, notably researchers working on brain connectivity, about some potential pitfalls and modeling choices that make the interpretation of the outcomes from these novel techniques rather cumbersome. Through a series of experiments on synthetic and real data, we illustrate practical situations where erroneous and severely biased conclusions may be drawn about the connectivity if these pitfalls are overlooked, like the presence of partial/missing/duplicate fibers or the critical importance of the diffusion model adopted. Microstructure informed tractography is a young but very promising technology, and by acknowledging its current limitations as done in this paper, we hope our observations will trigger further research in this direction and new ideas for truly quantitative and biologically meaningful analyses of the connectivity.
Overview
The claims and statistics of this paper haven’t been checked yet.
Run the check — free, no account needed. It reads the open-access text and checks the sources it cites.
Integrity signals
Registry
Cites
Statistics
Figures
Verification
Claims the paper makes
The claims and statistics of this paper haven’t been checked yet.
Run the check — free, no account needed. It reads the open-access text and checks the sources it cites.
Claims other papers make about this one
Each is checked against this paper’s own text: does it say what the citing paper says it does?
The source backs part of the claim, not all of it — or backs it for a different population, condition or comparison.
In the citing paper
“Structural connectome analyses are most convincing when integrated with neuroanatomical knowledge, functional data, and careful control of tractography biases (Assaf et al., 2019; Daducci et al., 2016).”
From 40 Years of diffusion MRI in the brain: From history to emerging frontiers (2026) · cites this paper as Daducci et al., 2016
Experimental — accuracy not yet measuredThe source backs part of the claim, not all of it — or backs it for a different population, condition or comparison.
In the citing paper
“Higher angular-resolution methods, better distortion correction, and anatomically informed tractography improve matters, yet they do not eliminate the inverse problem (Daducci et al., 2016; Tournier et al., 2011).”
From 40 Years of diffusion MRI in the brain: From history to emerging frontiers (2026) · cites this paper as Daducci et al., 2016
Experimental — accuracy not yet measuredThe cited source says what the claim attributes to it.
In the citing paper
“despite the fact that white matter fibers synapse in the gray matter (Daducci et al., 2016)”
From Quantitative mapping of the brain’s structural connectivity using diffusion MRI tractography: A review (2022) · cites this paper as Daducci et al., 2016
The cited source says what the claim attributes to it.
In the citing paper
“Tractography, therefore, visualizes a model of anatomical connectivity constrained by diffusion data, not anatomy itself (Daducci et al., 2016; Tournier et al., 2011).”
From 40 Years of diffusion MRI in the brain: From history to emerging frontiers (2026) · cites this paper as Daducci et al., 2016
Self-check
Percentages, sums and reported differences re-computed from the paper’s own numbers.
The self-check needs the paper’s full text.
Citations
Cites
Donoho, D. L. (2006) · IEEE Transactions on Information Theory · doi:10.1109/tit.2006.871582 · Cited by 23,994
Donoho, D. L. (2004) · Cited by 16,703
Candes, E. J., Romberg, J., & Tao, T. (2006) · IEEE Transactions on Information Theory · doi:10.1109/tit.2005.862083 · Cited by 15,639
N4ITK: Improved N3 Bias Correction
Tustison, N. J., Avants, B., Cook, P. A., Zheng, Y., Egan, A., Yushkevich, P. A., & Gee, J. C. (2010) · IEEE Transactions on Medical Imaging · doi:10.1109/tmi.2010.2046908 · Cited by 6,413
The basis of anisotropic water diffusion in the nervous system—A technical review.
Beaulieu, C. (2002) · NMR in Biomedicine · doi:10.1002/nbm.782 · Cited by 4,628
Le Bihan, D., Breton, E., Lallemand, D., Grenier, P., Cabanis, E., & Laval-Jeantet, M. (1986) · Radiology · doi:10.1148/radiology.161.2.3763909 · Cited by 3,912
NODDI: Practical in vivo neurite orientation dispersion and density imaging of the human brain
Zhang, H., Schneider, T., Wheeler-Kingshott, C. A., & Alexander, D. C. (2012) · NeuroImage · doi:10.1016/j.neuroimage.2012.03.072 · Cited by 3,288
Characterization and propagation of uncertainty in diffusion-weighted MR imaging
Behrens, T. E. J., Woolrich, M. W., Jenkinson, M., Johansen‐Berg, H., Nunes, R. G., Clare, S., Matthews, P. M., Brady, J. M., & Smith, S. M. (2003) · Magnetic Resonance in Medicine · doi:10.1002/mrm.10609 · Cited by 3,038
The Human Connectome Project: A data acquisition perspective
Essen, D. C. V., Uǧurbil, K., Auerbach, E. J., Barch, D. M., Behrens, T. E. J., Bucholz, R. D., Chang, A., Chen, L., Corbetta, M., Curtiss, S. W., et al. (2012) · NeuroImage · doi:10.1016/j.neuroimage.2012.02.018 · Cited by 2,638
White matter integrity, fiber count, and other fallacies: The do's and don'ts of diffusion MRI
Jones, D. K., Knösche, T. R., & Turner, R. (2013) · NeuroImage · doi:10.1016/j.neuroimage.2012.06.081 · Cited by 2,402 · cited 6×
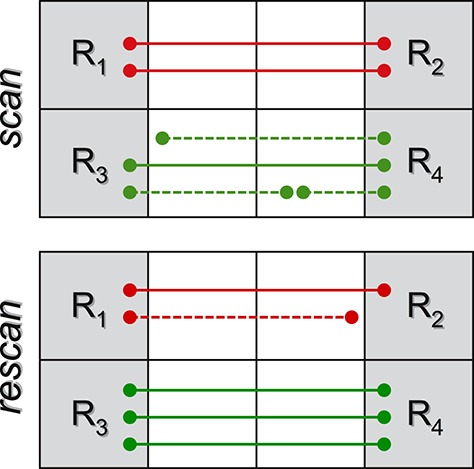
“…the connection strength between the four regions R1, . . . ,R4 is quantified by the fiber count (Jones et al., 2012), then a reduction inR1 ↔ R2 connectivity is observed between the two sessions (from 2 to 1), and an increase in R3 ↔ R4 (from 1 to 3), as the dashed tracts do not connect and so do…”
BackgroundInfluential
Cited by
Sorted by citations
Tractography-based connectomes are dominated by false-positive connections
Maier-Hein, K. H., Neher, P., Houde, J.-C., Côté, M.-A., Garyfallidis, E., Zhong, J., Chamberland, M., Yeh, F.-C., Lin, Y.-C., Ji, Q., et al. (2016) · doi:10.1101/084137 · Cited by 1,376
Self-citationDiffusion MRI fiber tractography of the brain
Jeurissen, B., Descoteaux, M., Mori, S., & Leemans, A. (2019) · NMR in Biomedicine · doi:10.1002/nbm.3785 · Cited by 574
Self-citationZhang, F., Daducci, A., He, Y., Schiavi, S., Seguin, C., Smith, R. E., Yeh, C.-H., Zhao, T., & O’Donnell, L. J. (2022) · NeuroImage · doi:10.1016/j.neuroimage.2021.118870 · Cited by 302
Self-citationBuilding connectomes using diffusion MRI: why, how and but
Sotiropoulos, S. N., & Zalesky, A. (2019) · NMR in Biomedicine · doi:10.1002/nbm.3752 · Cited by 290
Limits to anatomical accuracy of diffusion tractography using modern approaches
Schilling, K. G., Nath, V., Hansen, C., Parvathaneni, P., Blaber, J., Gao, Y., Neher, P., Aydogan, D. B., Shi, Y., Ocampo-Pineda, M., et al. (2019) · NeuroImage · doi:10.1016/j.neuroimage.2018.10.029 · Cited by 260
Self-citation
Metadata
- Authors
- Daducci, A., Dal Palú, A., Descoteaux, M., & Thiran, J.-P.
- Affiliations
- Université de Sherbrooke (CA)
- Centre Hospitalier Universitaire Vaudois (CH)
- Corresponding author
- Daducci, Alessandro
- Venue
- Frontiers in Neuroscience
- Publisher
- Frontiers Media SA
- Published
- 2016-06-06
- Volume
- 10
- Pages
- 247-247
- ISSN
- 1662-453X (ISSN-L)
- PMC
- PMC4893481
- OpenAlex
- W2404527239
- Cited by
- 138
- References
- 51
- Citations by year
- 2026: 9 · 2025: 17 · 2024: 9 · 2023: 8 · 2022: 8 · 2021: 12 · 2020: 14 · 2019: 23 · 2018: 16 · 2017: 21 · 2016: 1
- FWCI
- 17.65
- Type
- journal article
- Language
- en
- Open access
- gold
- doi.org
- Licence
- cc-by
- Locations
- Frontiers in Neuroscience (publishedVersion, cc-by)
- Europe PMC (PubMed Central) (publishedVersion, cc-by)
- PubMed Central (publishedVersion, cc-by)
- PubMed (publishedVersion)
- DOAJ (DOAJ: Directory of Open Access Journals) (submittedVersion)
- Figshare (submittedVersion, cc-by)
- Infoscience (Ecole Polytechnique Fédérale de Lausanne) (submittedVersion)
- Infoscience (Ecole Polytechnique Fédérale de Lausanne) (submittedVersion, cc-by-nc-nd)
- Figshare (cc-by)
- Funders
- École Polytechnique Fédérale de Lausanne
- Centre d'Imagerie BioMédicale
- Topics
- Health Sciences › Medicine › Radiology, Nuclear Medicine and Imaging › Advanced Neuroimaging Techniques and Applications
- Life Sciences › Neuroscience › Cognitive Neuroscience › Functional Brain Connectivity Studies
- Health Sciences › Medicine › Radiology, Nuclear Medicine and Imaging › Advanced MRI Techniques and Applications
- Keywords
- diffusion MRI, brain connectivity
About these checks
Registry, retraction, Cites and statistics results are computed, not judged, with one exception: a printed reference that no index lists is read once by a model before it counts as a citation error. Claims are extracted by a model and kept only when their quote appears verbatim in the text; each cited source is then checked, with a model’s help, for whether it says what the claim relies on. Those verdicts can be wrong — read the claim’s quote and the cited source before relying on one.
Statistics and arithmetic are recomputed, not judged.
Confidence bands are shown only for fields calibrated on our annotated test set. None is calibrated yet, so no band is shown.
What counts as a claim ›How we measure confidence ›How we check this ›
Are you an author, or do you see a problem with this page? Request a review
