

The DOI matches its Crossref record; 66 of the 66 references it cites were found in a registry or an index.
Indole, a Signaling Molecule Produced by the Gut Microbiota, Negatively Impacts Emotional Behaviors in Rats
Open accessAbstract
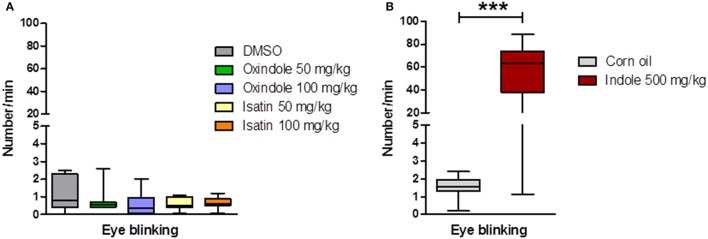
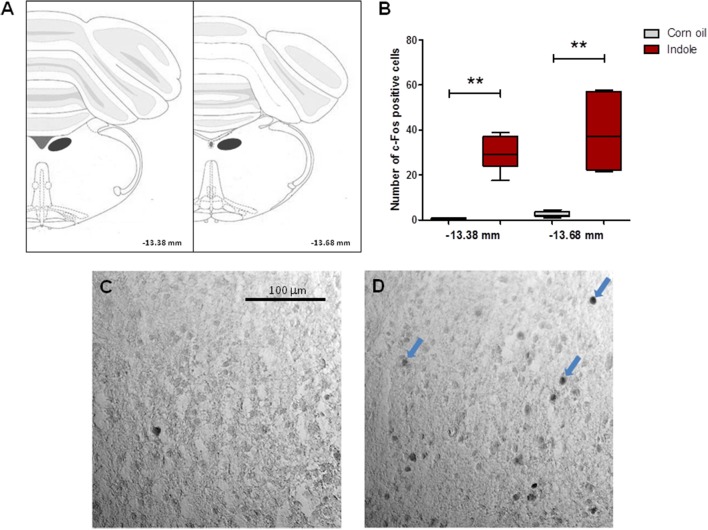
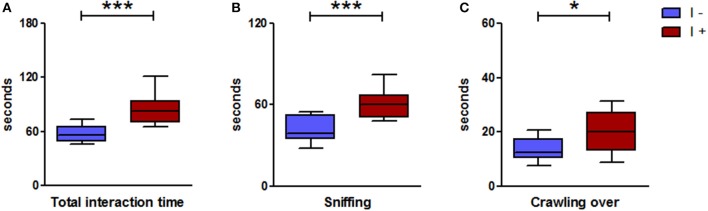
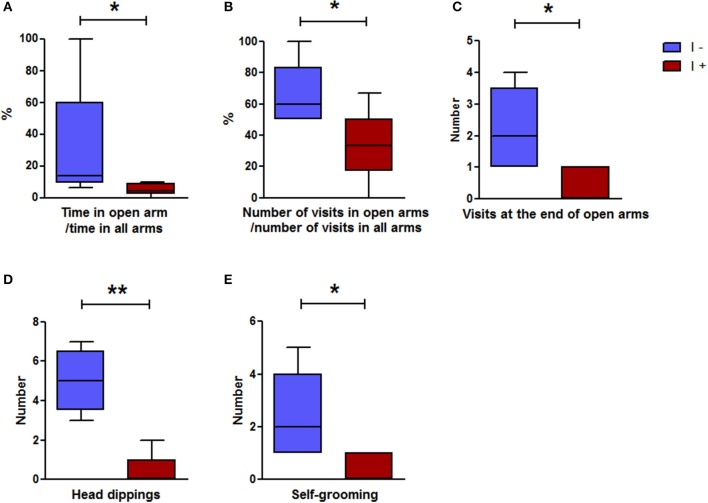
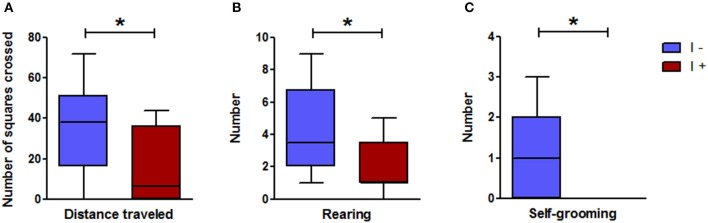
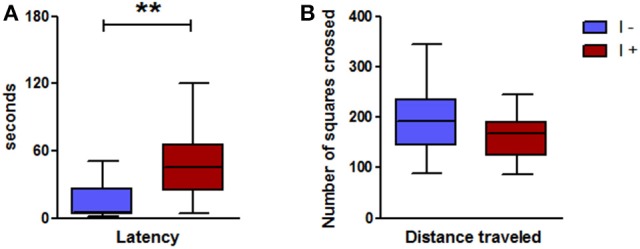
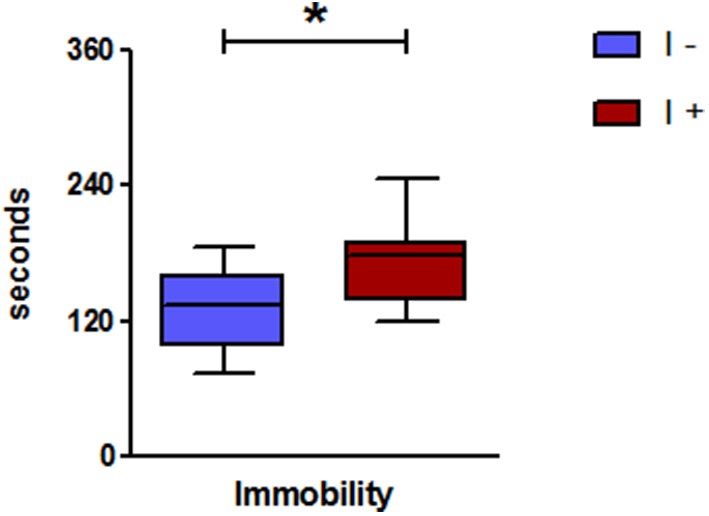
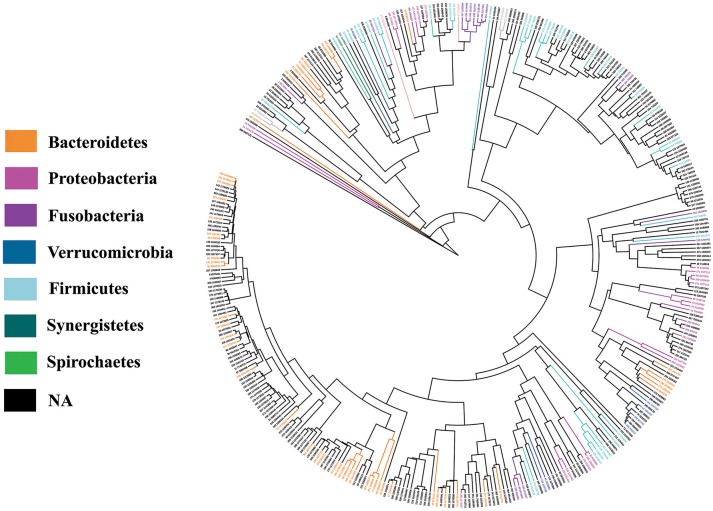
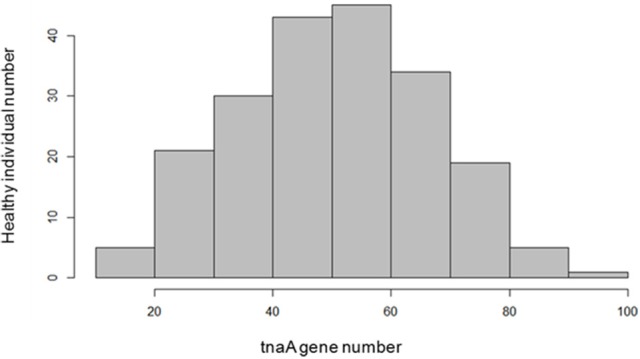
Gut microbiota produces a wide and diverse array of metabolites that are an integral part of the host metabolome. The emergence of the gut microbiome-brain axis concept has prompted investigations on the role of gut microbiota dysbioses in the pathophysiology of brain diseases. Specifically, the search for microbe-related metabolomic signatures in human patients and animal models of psychiatric disorders has pointed out the importance of the microbial metabolism of aromatic amino acids. Here, we investigated the effect of indole on brain and behavior in rats. Indole is produced by gut microbiota from tryptophan, through the tryptophanase enzyme encoded by the tnaA gene. First, we mimicked an acute and high overproduction of indole by injecting this compound in the cecum of conventional rats. This treatment led to a dramatic decrease of motor activity. The neurodepressant oxidized derivatives of indole, oxindole and isatin, accumulated in the brain. In addition, increase in eye blinking frequency and in c-Fos protein expression in the dorsal vagal complex denoted a vagus nerve activation. Second, we mimicked a chronic and moderate overproduction of indole by colonizing germ-free rats with the indole-producing bacterial species Escherichia coli. We compared emotional behaviors of these rats with those of germ-free rats colonized with a genetically-engineered counterpart strain unable to produce indole. Rats overproducing indole displayed higher helplessness in the tail suspension test, and enhanced anxiety-like behavior in the novelty, elevated plus maze and open-field tests. Vagus nerve activation was suggested by an increase in eye blinking frequency. However, unlike the conventional rats dosed with a high amount of indole, the motor activity was not altered and neither oxindole nor isatin could be detected in the brain. Further studies are required for a comprehensive understanding of the mechanisms supporting indole effects on emotional behaviors. As our findings suggest that people whose gut microbiota is highly prone to produce indole could be more likely to develop anxiety and mood disorders, we addressed the issue of the inter-individual variability of indole producing potential in humans. An in silico investigation of metagenomic data focused on the tnaA gene products definitively proved this inter-individual variability.
Overview
The claims and statistics of this paper haven’t been checked yet.
Run the check — free, no account needed. It reads the open-access text and checks the sources it cites.
Integrity signals
Registry
Cites
Statistics
Figures
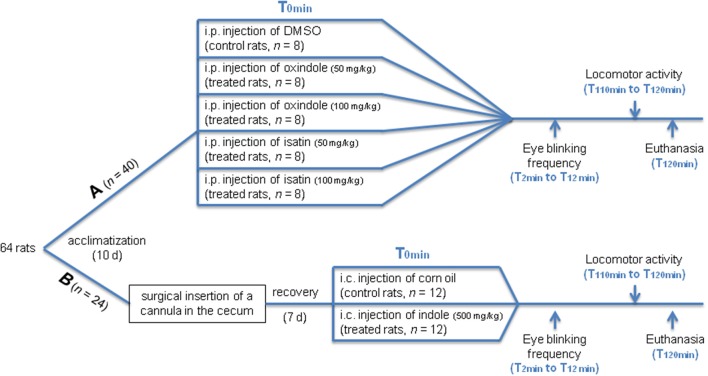
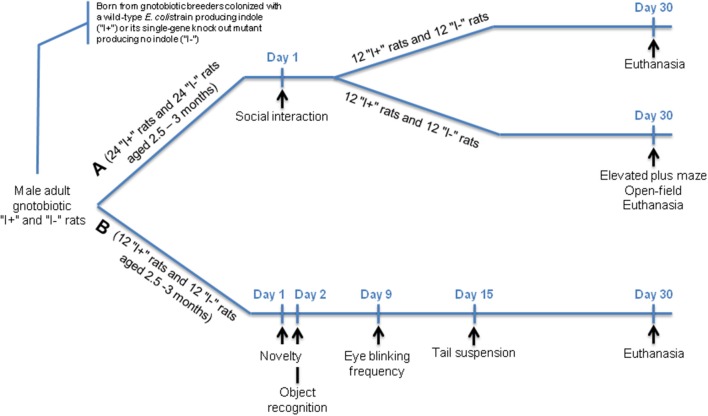
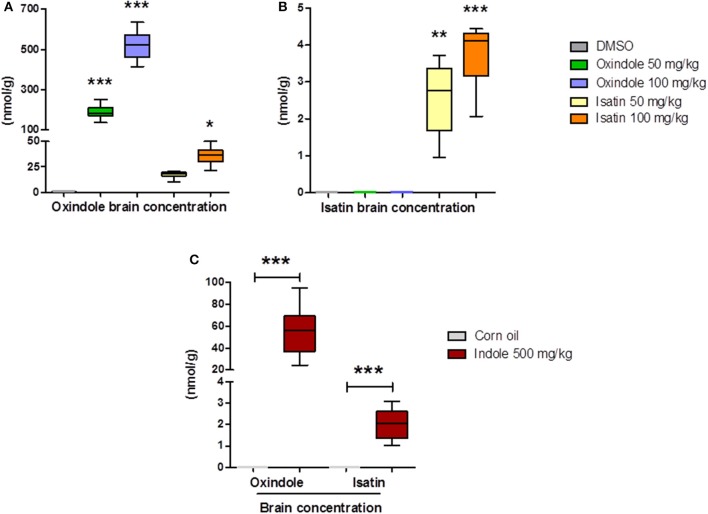
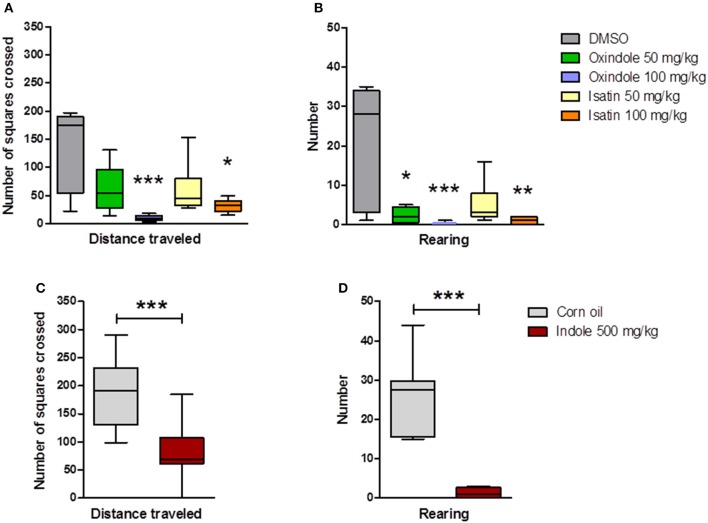
Verification
Claims the paper makes
The claims and statistics of this paper haven’t been checked yet.
Run the check — free, no account needed. It reads the open-access text and checks the sources it cites.
Claims other papers make about this one
Each is checked against this paper’s own text: does it say what the citing paper says it does?
The cited source says what the claim attributes to it.
In the citing paper
“Further, an increase in the concentration of indole in the gut, a microbial metabolite, has been linked to the activation of the vagus nerve (Jaglin et al., 2018)”
From The Microbiota-Gut-Brain Axis (2019) · cites this paper as Jaglin et al., 2018
In the citing paper
“Although many important beneficial functions (e.g., antioxidative effect) have been linked to indoles, overproduction of these metabolites resulted in anxiety-and depression-like behavior in animals (404).”
From Diet and the Microbiota–Gut–Brain Axis: Sowing the Seeds of Good Mental Health (2021) · cites this paper as [404]
In the citing paper
“Isatin, another bacterial and host metabolite of indole (Gillam et al., 2000) has been demonstrated to affect anxiety-like behavior in rodents (Jaglin et al., 2018).”
From The Microbiota-Gut-Brain Axis (2019) · cites this paper as Jaglin et al., 2018
Self-check
Percentages, sums and reported differences re-computed from the paper’s own numbers.
The self-check needs the paper’s full text.
Citations
Cites
Thompson, J. D., Higgins, D. G., & Gibson, T. J. (1994) · Nucleic Acids Research · doi:10.1093/nar/22.22.4673 · Cited by 64,617
MAFFT: a novel method for rapid multiple sequence alignment based on fast Fourier transform
Katoh, K. (2002) · Nucleic Acids Research · doi:10.1093/nar/gkf436 · Cited by 17,027
Construction of Escherichia coli K‐12 in‐frame, single‐gene knockout mutants: the Keio collection
Baba, T., Ara, T., Hasegawa, M., Takai, Y., Okumura, Y., Baba, M., Datsenko, K. A., Tomita, M., Wanner, B. L., & Mori, H. (2006) · Molecular Systems Biology · doi:10.1038/msb4100050 · Cited by 7,858
Diversity, stability and resilience of the human gut microbiota
Lozupone, C. A., Stombaugh, J. I., Gordon, J. I., Jansson, J. K., & Knight, R. (2012) · Nature · doi:10.1038/nature11550 · Cited by 5,533
Mind-altering microorganisms: the impact of the gut microbiota on brain and behaviour
Cryan, J. F., & Dinan, T. G. (2012) · Nature Reviews Neuroscience · doi:10.1038/nrn3346 · Cited by 4,572
Bravo, J. A., Forsythe, P., Chew, M. V., Escaravage, E., Savignac, H. M., Dinan, T. G., Bienenstock, J., & Cryan, J. F. (2011) · Proceedings of the National Academy of Sciences · doi:10.1073/pnas.1102999108 · Cited by 3,888
Hsiao, E. Y., McBride, S. W., Hsien, S., Sharon, G., Hyde, E. R., McCue, T., Codelli, J. A., Chow, J., Reisman, S. E., Petrosino, J. F., et al. (2013) · Cell · doi:10.1016/j.cell.2013.11.024 · Cited by 3,283
A new one-trial test for neurobiological studies of memory in rats. 1: behavioral data
Ennaceur, A., & Delacour, J. (1988) · Behavioural Brain Research · doi:10.1016/0166-4328(88)90157-x · Cited by 3,223
Sudo, N., Chida, Y., Aiba, Y., Sonoda, J., Oyama, N., Yu, X., Kubo, C., & Koga, Y. (2004) · The Journal of Physiology · doi:10.1113/jphysiol.2004.063388 · Cited by 2,735
Metabolomics analysis reveals large effects of gut microflora on mammalian blood metabolites
Wikoff, W. R., Anfora, A. T., Liu, J., Schultz, P. G., Lesley, S. A., Peters, E. C., & Siuzdak, G. (2009) · Proceedings of the National Academy of Sciences · doi:10.1073/pnas.0812874106 · Cited by 2,677
Research works printed but not linked: 1
- Paxinos, 2005, The Rat Brain in Stereotaxic Coordinates, 5th Edn.
Cited by
Sorted by citations
Items 201–268 of 268
Introduction to microbiomes in health and diseases
Agrawal, P., Mendhey, P., Kumar, R., Patel, S., Kaushik, P. K., Dadsena, A., & Kumar, S. (2025) · International review of cytology · doi:10.1016/bs.ircmb.2024.12.010 · Cited by 2
Host and microbiota interaction in depression syndrome
Mohsenipour, Z., Keshavarz, P., & Moghanloo, Z. S. (2025) · Brain Disorders · doi:10.1016/j.dscb.2025.100291 · Cited by 2
Identification of overlooked tryptophan catabolism pathways in bacteria: a focus on rhizobacteria
Lautrey, A., Legendre, L., Wisniewski‐Dyé, F., & Prigent‐Combaret, C. (2025) · Heliyon · doi:10.1016/j.heliyon.2025.e44009 · Cited by 2
Zhao, X., & Ren, W. (2025) · Neuroscience & Biobehavioral Reviews · doi:10.1016/j.neubiorev.2025.106452 · Cited by 2
Dutta, S., Dutta, T. K., Nanda, P. K., Dhar, P., Das, A. K., & Bhunia, A. K. (2026) · Probiotics and Antimicrobial Proteins · doi:10.1007/s12602-026-11136-1 · Cited by 2
Wichienchot, S., & Keawyok, K. (2021) · Functional Foods in Health and Disease · doi:10.31989/ffhd.v11i12.841 · Cited by 2
Potent of strategic approaches for tauopathies ranging from single-cell transcriptome to microbiome
Kim, S., Yang, S., Yang, E.-J., Kang, M., & Joo, J. (2023) · Animal Cells and Systems · doi:10.1080/19768354.2023.2285826 · Cited by 2
Exploration of CYP4B1 Substrate Promiscuity Across Three Species
Röder, A., Hutter, M. C., Heitzer, E., Franz, P. J., Hüsken, S., Wiek, C., & Girhard, M. (2025) · Catalysts · doi:10.3390/catal15050454 · Cited by 2
Zhang, Z., & Huang, W. M. (2025) · Journal of Multidisciplinary Healthcare · doi:10.2147/jmdh.s543841 · Cited by 3
Urruchi, A. E. P., Elizalde, L. E. R., Cornejo, F. D. M. Z., Calvet, M. M., Cuba, M. V. B., & Domínguez, F. F. (2024) · Health Psychology Research · doi:10.52965/001c.117647 · Cited by 1
Vineetha, K. K., Archana, P. R., Rao, B. K., Ballal, M., Dutta, B., Vani Lakshmi, R., & Bhat, R. G. (2024) · Rapid Communications in Mass Spectrometry · doi:10.1002/rcm.9923 · Cited by 1
McDonnell, K. (2025) · Journal of Clinical Medicine · doi:10.3390/jcm14062040 · Cited by 1
2,3,7,8-tetrachlorodibenzofuran modulates intestinal microbiota and tryptophan metabolism in mice
Shen, H., Wang, D., Huang, Y., Yang, Y., Ji, S., Zhu, W., & Liu, Q. (2025) · Life Sciences · doi:10.1016/j.lfs.2025.123679 · Cited by 1
Substance Addiction Development: The Microbiota–Gut–Brain Axis Role
Chaves-Jiménez, G., Baltodano-Rodas, C., Morales-Vargas, J. I., Ortiz-Quesada, A., & Pereira-Brenes, J. (2025) · Biochemistry (Moscow) Supplement Series B Biomedical Chemistry · doi:10.1134/s1990750824601279 · Cited by 1
Giorgini, G., Mir, H.-D., Etienne, C., Dumais, E., Maximin, E., Silvestri, C., Flamand, N., Naudon, L., Rabot, S., & Marzo, V. D. (2026) · Journal of Lipid Research · doi:10.1016/j.jlr.2026.101070 · Cited by 1
Self-citationNeves, L. B. M., Daniel Domingues, S., Jr., Baldessarini, B. L., Laino, P. H., & Lima, B. C. (2026) · Progress in Neuro-Psychopharmacology and Biological Psychiatry · doi:10.1016/j.pnpbp.2026.111860 · Cited by 1
Antsiferov, O. V., Cherevatenko, R. F., Корокин, М. В., Gureev, V. V., Gureeva, A. V., Zatolokina, M. A., Avdeyeva, E. V., Zhilinkova, L. A., & Kolesnik, I. M. (2021) · Research Results in Pharmacology · doi:10.3897/rrpharmacology.7.75301 · Cited by 1
The Microbiome and Amino Acid Metabolism
Diether, N. E., & Willing, B. P. (2022) · Royal Society of Chemistry eBooks · doi:10.1039/9781839160950-00048 · Cited by 1
Densil, A., George, M. E., Mahdi, H., Chami, A., Mark, A., Luo, C., Wang, Y., Ali, A., Tang, P., Dong, A., et al. (2023) · Frontiers in Systems Biology · doi:10.3389/fsysb.2023.1274184 · Cited by 1
The Gut Microbiota and NDG: What Is the Interplay
Haiba, S., Idriss, S., & Awad, M. (2024) · Springer eBooks · doi:10.1007/978-981-19-3949-5_30-1 · Cited by 1
Moore, M. L., Ford, J., Schladweiler, M. C. J., Dye, J. A., Jackson, T. W., & Miller, C. N. (2024) · Metabolomics · doi:10.1007/s11306-024-02099-x · Cited by 2
Interplay Between Gut-microbiota and Neurodegeneration
Ashique, S., Pal, R., Kumar, S., Verma, B., Kumar, N., Kahwa, I., Farid, A., Mishra, N., Kumar, P., & Taghizadeh‐Hesary, F. (2024) · BENTHAM SCIENCE PUBLISHERS eBooks · doi:10.2174/9789815238754124010009 · Cited by 1
Mao, Y., Liu, M., Su, K., Xie, J., Liu, W., Wu, L., & Zhang, X. (2024) · Algal Research · doi:10.1016/j.algal.2024.103715 · Cited by 1
Liens entre microbiote intestinal et comportement de type anxiodépressif chez le rongeur
Rabot, S., Naudon, L., & Daugé, V. (2018) · Phytothérapie · doi:10.3166/phyto-2018-0090 · Cited by 1
Self-citationYang, K., Chen, Y., Xiao-qing, Z., Zhen, Q., Gui, W., Ban, Y., He, Y., Pan, S., & Ding, M. (2022) · Journal of Liquid Chromatography & Related Technologies · doi:10.1080/10826076.2022.2124267 · Cited by 1
Microbiome Engineering for Metabolic Disorders
Aggarwal, N., Koh, E., Srivastava, S. K., Sieow, B. F., & Hwang, I. Y. (2022) · Wiley eBooks · doi:10.1002/9783527825462.ch2 · Cited by 1
Carvalho, R. D. D. O., Rabah, H., Carmo, F. L. R. D., Ariute, J. C., Aburjaile, F. F., Brenig, B., Guédon, É., Loir, Y. L., Jan, G., & Azevedo, V. (2023) · Research Square · doi:10.21203/rs.3.rs-2769592/v1 · Cited by 1
Lubkowicz, D. (2023) · doi:10.17760/d20620612 · Cited by 1
Yu, J., Ning, J., Huang, S., Chen, S.-D., Yang, Y., & Dong, Q. (2021) · Research Square · doi:10.21203/rs.3.rs-885681/v1
Arrieumerlou, C. (2020) · Faculty Opinions – Post-Publication Peer Review of the Biomedical Literature · doi:10.3410/f.738114953.793577276
Daugé, V. (2020) · Cerveau & Psycho · doi:10.3917/cerpsy.123.0032
Self-citationElectrochemistry meets mass spectrometry
Sanz, J. A. (2022) · University of Groningen research database (University of Groningen / Centre for Information Technology) · doi:10.33612/diss.256856845
Aoki, R., & Ayako, A. O. K. I. (2022) · KAGAKU TO SEIBUTSU · doi:10.1271/kagakutoseibutsu.60.189
Sing, J., Whitley, O., & Davis, S. (2023) · bioRxiv (Cold Spring Harbor Laboratory) · doi:10.1101/2023.10.02.560614
Nutritional Modulation of Gut Microbiota Alleviates Metabolic and Neurological Disorders
Rajeswari, M., Pola, S., & Sravani, D. S. L. (2023) · Springer eBooks · doi:10.1007/978-981-99-5114-7_6
Research progress of probiotics application in psychiatric diseases
Xia, Z. (2024) · International Conference on Biological Engineering and Medical Science (ICBioMed) · doi:10.1117/12.3012846
Role of probiotics in brain health
Thakur, A. K., Shekhar, N., Tyagi, S., & Rani, S. (2024) · Elsevier eBooks · doi:10.1016/b978-0-443-18951-7.00009-8
Research Progress of Gut Microbiota on Parkinson’s Disease
袁, 薇. (2024) · Advances in Clinical Medicine · doi:10.12677/acm.2024.141154
Gut–brain communication through microbes
Green, M., & Foster, J. A. (2024) · Elsevier eBooks · doi:10.1016/b978-0-323-90144-4.00002-1
The Gut Microbiota and NDG: What Is the Interplay
Haiba, S., Idriss, S., & Awad, M. (2024) · Springer eBooks · doi:10.1007/978-981-99-7557-0_30
Ma, J., Tian, Y., Hu, J., Liang, Y., Tang, F.-D., & Zhang, Y. (2024) · Research Square · doi:10.21203/rs.3.rs-5352779/v1
Tryptophan metabolism: role in modulating the function of the "brain–gut axis"
Sliusar, N. A., & Салтанова, С. Д. (2024) · Medicine Today and Tomorrow · doi:10.35339/msz.2024.93.3.sls
Future prospective of microbiome-gut brain axis for treatment of CNS disorders
Mane, R., Kashid, S., Mazahir, F., & Yadav, A. K. (2025) · Elsevier eBooks · doi:10.1016/b978-0-443-21680-0.00019-5
Rubab, S. L., Asad, M., Khan, H. A., Al‐Hussain, S. A., Irfan, A., & Zaki, M. E. A. (2025) · Scientific Reports · doi:10.1038/s41598-025-01099-8
Amino Acid Metabolism and Communication Between Microbes of the Intestinal Microbiota and Host Cells
Blachier, F. (2025) · Fascinating life sciences · doi:10.1007/978-3-031-93393-6_10
Gut Microbiota-Mediated Modulation of Neurodevelopmental Behavior in CLCN4- Deficient MicePreprint
Choi, Y., Bose, S., Oh, J., Song, E., Nam, Y., Jeon, S., & Kim, H. (2025) · Research Square · doi:10.21203/rs.3.rs-7514097/v1
Bermudez-Martin, P., Becker, J. A. J., Caramello, N., Fernández, S. P., Campos, R. C., Canaguier, J., Barbosa, S., Martínez-Gili, L., Myridakis, A., Dumas, M., et al. (2021) · Figshare · doi:10.6084/m9.figshare.14936553
Self-citationBarone, M., Garelli, S., Rampelli, S., Agostini, A., Matysik, S., D’Amico, F., Krautbauer, S., Mazza, R., Salituro, N., Fanelli, F., et al. (2023) · Figshare · doi:10.6084/m9.figshare.22599332
Cheng, C., Shivanagoudra, S. R., Mukunth, A., Biradar, S., Matos, Y. A. S., Klemashevich, C. L., Kim, D. M., Wright, G. A., Ghosh, S., Jala, V. R., et al. (2025) · bioRxiv (Cold Spring Harbor Laboratory) · doi:10.64898/2025.12.21.695859
Pocheron, A.-L. (2019) · theses.fr (ABES) · doi:10.70675/29969b86z2649z4b67zb315za23a1106f4ef
Mir, H.-D. (2018) · theses.fr (ABES) · doi:10.70675/1a6c01fbzd7e5z437bz9cc4z84ed7d02c18d
Bermudez-Martin, P. (2020) · theses.fr (ABES) · doi:10.70675/d0d223ffzbc0ez44d9z8475z153f265e94f5
Roussin, L. (2023) · theses.fr (ABES) · doi:10.70675/998d3bd1z4618z400dz998cz89e524b35aef · Cited by 1
Peptidoglycan : a key elicitor of the gut- brain axis
Fioriti, F. (2023) · theses.fr (ABES) · doi:10.70675/9e7ce0aaz9b66z467bzbc3fz6fa3bf65d9a6
Chaurasiya, V., & Babre, N. (2026) · Next research. · doi:10.1016/j.nexres.2026.101755
MICROBIOTA-GUT-BRAIN AXIS IN MAJOR DEPRESSION: PATHOPHYSIOLOGY AND PSYCHOBIOTIC INTERVENTIONS
Pietrzak, J., Błonka, D., Jaskulska, A., Skudzińska, M., Wołk, K., Pohrybieniuk, J., Kochański, F., Grys, M. I., Bartold, M., & Rajczyk, K. (2026) · International Journal of Innovative Technologies in Social Science · doi:10.31435/ijitss.1(49).2026.4809
The gut–brain–epigenetic axis in brain health
Louwies, T. (2026) · Elsevier eBooks · doi:10.1016/b978-0-443-15572-7.00057-7
Efficient selective removal of indole by Mg/Al-LDH@MOF: mechanistic insights and adsorption behavior
Zhang, W., Peng, D., Wang, A., Lin, H., Yan, X., Xu, Z., Yan, M., & Deng, Z. (2026) · RSC Advances · doi:10.1039/d6ra04492a
Jiani, W., Yinghe, Y., Jiani, Z., Zhao, T., Liu, Y., & Bo, J. (2026) · Discover Neuroscience · doi:10.1186/s13064-026-00322-0
Microbiome and Diseases: Gut–Brain Axis and Neurological Disorders
de Castilhos, J., & Stein‐Thoeringer, C. K. (2026) · Springer eBooks · doi:10.1007/978-3-032-26410-7_18
The emerging role of microbiota in neuro-oncology
Morad, G., Soto, R. A., Ajami, N. J., Ferguson, S. D., & Wargo, J. A. (2026) · Nature Reviews Neurology · doi:10.1038/s41582-026-01266-z
Exploring the role of infectious pathogens in Alzheimer’s disease neuroinflammation
Vaiasicca, S., Mangiaterra, G., Citterio, B., Piccioni, G., Orlando, F., Giorgetti, B., Cianfruglia, L., Giacconi, R., Fumarola, S., Cardelli, M., et al. (2026) · Frontiers in Cellular and Infection Microbiology · doi:10.3389/fcimb.2026.1919289
Gut microbiota primes stroke severity via the AHR in intestinal dendritic cells
Jiménez, R. D., Ruggles, A., Adedokun, M. A., Sorbie, A., Fink, D., Laudani, S., Simats, A., He, Y., Pahl, V., Díaz-Marugán, L., et al. (2026) · Cell · doi:10.1016/j.cell.2026.09.013
Strategic Formation of Indoles Using Phenyl Hydrazine as a Key Reagent
Verma, A. K., Yadav, A., Negi, D. S., & Puri, S. (2026) · European Journal of Organic Chemistry · doi:10.1002/ejoc.70878
Nanoparticles and the gut-microbiome: a dual strategy for oral brain delivery
Negahdari, R., Pouyanfar, N., Masoudifar, R., Aftabi, P., Fendereski, F., Anvari, Z., Masoumi, N., Faizi, M., & Ghorbani‐Bidkorbeh, F. (2026) · International Journal of Pharmaceutics · doi:10.1016/j.ijpharm.2026.127477
Wang, J., Li, Y., Liangkun, M., & 孙胤 (2026) · Journal of Functional Foods · doi:10.1016/j.jff.2026.107555
Metadata
- Authors
- Jaglin, M., Rhimi, M., Philippe, C., Pons, N., Bruneau, A., Goustard, B., Daugé, V., Maguin, E., Naudon, L., & Rabot, S.
- Affiliations
- AgroParisTech (FR)
- Université Paris-Saclay (FR)
- Centre National de la Recherche Scientifique (FR)
- Corresponding author
- Naudon, Laurent
- Rabot, Sylvie
- ORCID
- Venue
- Frontiers in Neuroscience
- Publisher
- Frontiers Media SA
- Published
- 2018-04-09
- Volume
- 12
- Pages
- 216-216
- ISSN
- 1662-453X (ISSN-L)
- PMC
- PMC5900047
- OpenAlex
- W2793407886
- Cited by
- 269
- References
- 66
- Citations by year
- 2026: 17 · 2025: 33 · 2024: 52 · 2023: 37 · 2022: 42 · 2021: 33 · 2020: 34 · 2019: 17 · 2018: 4
- FWCI
- 7.83
- Type
- journal article
- Language
- en
- Open access
- gold
- doi.org
- Locations
- Frontiers in Neuroscience (publishedVersion, cc-by)
- Europe PMC (PubMed Central) (publishedVersion, cc-by)
- PubMed Central (publishedVersion, cc-by)
- PubMed (publishedVersion)
- HAL (submittedVersion, other-oa)
- HAL (submittedVersion, cc-by)
- HAL (submittedVersion)
- DOAJ (DOAJ: Directory of Open Access Journals) (submittedVersion, cc-by-sa)
- Funders
- Institut National de la Recherche Agronomique
- Centre National de la Recherche Scientifique
- Ministère de l'Education Nationale, de l'Enseignement Supérieur et de la Recherche
- Topics
- Life Sciences › Biochemistry, Genetics and Molecular Biology › Molecular Biology › Gut microbiota and health
- Life Sciences › Neuroscience › Biological Psychiatry › Tryptophan and brain disorders
- Health Sciences › Medicine › Gastroenterology › Gastrointestinal motility and disorders
- Keywords
- indole, gut microbiota, gut-brain axis, tryptophan metabolism, tryptophanase, germ-free rats, Escherichia coli, anxiety-like behavior, helplessness, dorsal vagal complex, blinking, oxindoles, isatin, interindividual variability, metagenomics, emotional behavior
About these checks
Registry, retraction, Cites and statistics results are computed, not judged, with one exception: a printed reference that no index lists is read once by a model before it counts as a citation error. Claims are extracted by a model and kept only when their quote appears verbatim in the text; each cited source is then checked, with a model’s help, for whether it says what the claim relies on. Those verdicts can be wrong — read the claim’s quote and the cited source before relying on one.
Statistics and arithmetic are recomputed, not judged.
Confidence bands are shown only for fields calibrated on our annotated test set. None is calibrated yet, so no band is shown.
What counts as a claim ›How we measure confidence ›How we check this ›
Are you an author, or do you see a problem with this page? Request a review
