

The DOI matches its Crossref record; 29 of the 29 references it cites were found in a registry or an index.
Abnormality of m6A mRNA Methylation Is Involved in Alzheimer’s Disease
Open accessAbstract
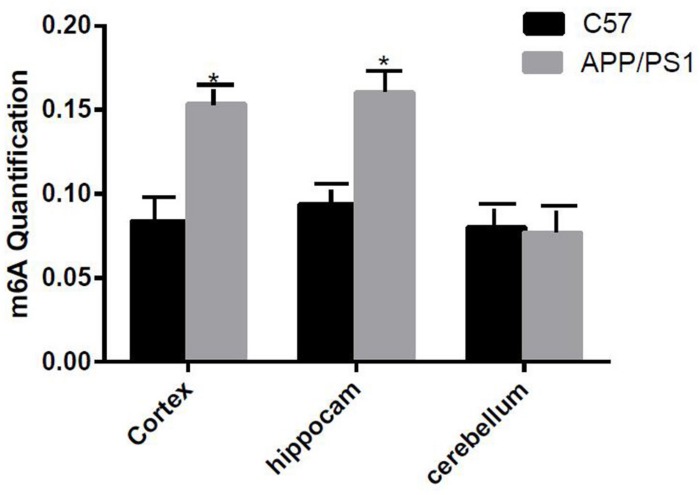
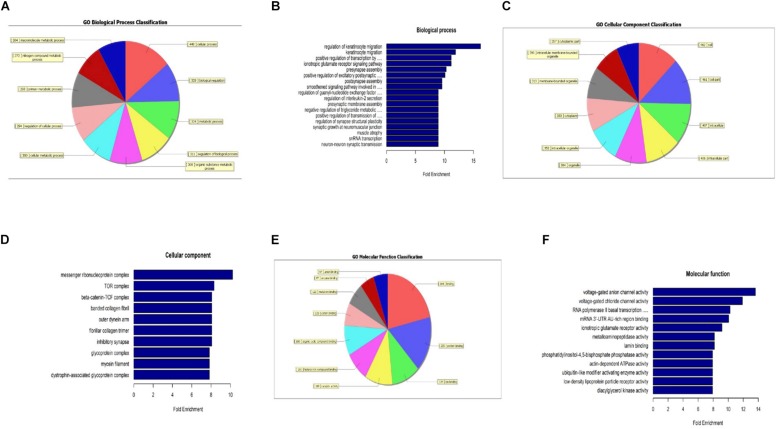
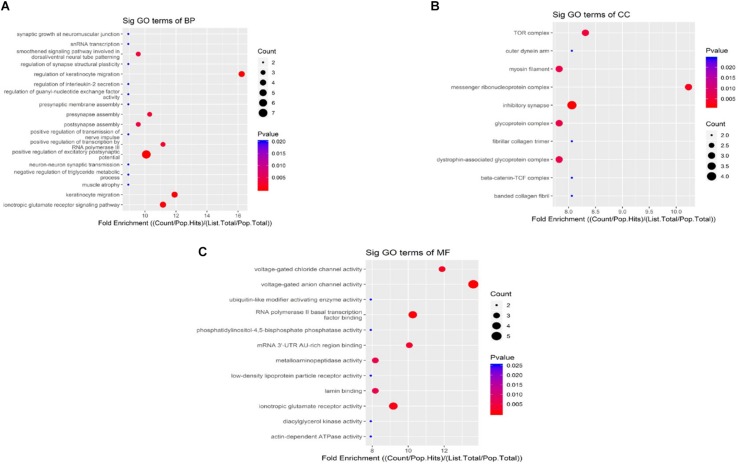
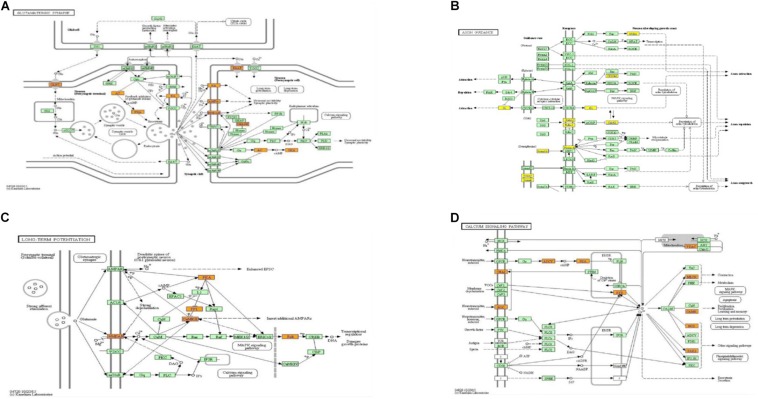
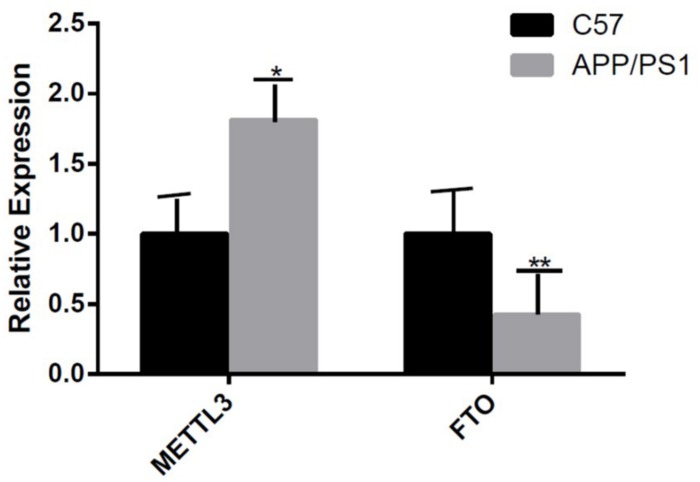
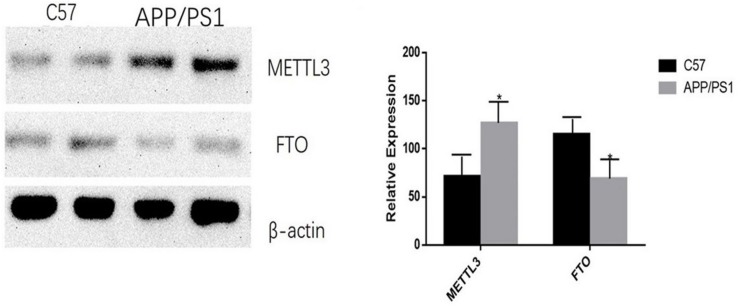
Alzheimer's disease (AD), the most common form of dementia, is highly prevalent in older adults. The main clinical feature is the progressive decline of memory function, which eventually leads to the decline of cognitive function. At present, the pathogenesis of AD is unclear. In the disease process, synaptic changes are the key. Recent studies have shown that the dysregulation of RNA methylation is related to many biological processes, including neurodevelopment and neurodegenerative diseases. N6-methyladenosine (m6A) is the most abundant modification in eukaryotic RNA. In this study, RNA m6A methylation was quantified in APP/PS1 transgenic mice, which is an AD mouse model, and C57BL/6 control mice, and data showed that m6A methylation was elevated in the cortex and the hippocampus of APP/PS1 transgenic mice. Next, the alterations of m6A RNA methylation in AD and in C57BL/6 mice were investigated using high-throughput sequencing. Genome-wide maps of m6A mRNA showed that the degrees of m6A methylation were higher in many genes and lower in others in AD mice. Interestingly, the expression of the m6A methyltransferase METTL3 was elevated and that of the m6A demethylase FTO was decreased in AD mice. The data were analyzed by gene ontology (GO) and Kyoto Encyclopedia of Genes and Genomes (KEGG) pathway analyses, and pathways that might be related to synaptic or neuron development and growth were constructed. The related pathways and genes predicted the potential roles of the differentially expressed m6A methylation RNA in AD. Collectively, our findings demonstrate that the m6A methylation of RNA promotes the development of AD.
Overview
The claims and statistics of this paper haven’t been checked yet.
Run the check — free, no account needed. It reads the open-access text and checks the sources it cites.
Integrity signals
Registry
Cites
Statistics
Figures
Verification
Claims the paper makes
The claims and statistics of this paper haven’t been checked yet.
Run the check — free, no account needed. It reads the open-access text and checks the sources it cites.
Claims other papers make about this one
Each is checked against this paper’s own text: does it say what the citing paper says it does?
The cited source doesn’t support the claim as written.
In the citing paper
“Interestingly, m6A does not appear to accumulate in models of Aβ amyloidosis, which accumulate aggregates extracellularly (Han et al., 2020).”
From β-amyloid accumulation enhances microtubule associated protein tau pathology in an APPNL-G-F/MAPTP301S mouse model of Alzheimer’s disease (2024) · cites this paper as Han et al., 2020
Checked by a reasoning model — may be wrong.
Experimental — accuracy not yet measuredThe source backs part of the claim, not all of it — or backs it for a different population, condition or comparison.
In the citing paper
“Total m6A levels were also reported in a previous manuscript examining m6A in an AD model utilizing over-expression of only APP, which is a model that exhibits Aβ accumulation without corresponding MAPT pathology (Han et al., 2020).”
From β-amyloid accumulation enhances microtubule associated protein tau pathology in an APPNL-G-F/MAPTP301S mouse model of Alzheimer’s disease (2024) · cites this paper as Han et al., 2020
Experimental — accuracy not yet measuredThe check wasn’t confident either way, so it gives no verdict — never disputed.
In the citing paper
“Data from this manuscript suggest that the absence of MAPT pathology in this model produced a corresponding absence of m6A accumulation (Han et al., 2020).”
From β-amyloid accumulation enhances microtubule associated protein tau pathology in an APPNL-G-F/MAPTP301S mouse model of Alzheimer’s disease (2024) · cites this paper as Han et al., 2020
Experimental — accuracy not yet measured
Self-check
Percentages, sums and reported differences re-computed from the paper’s own numbers.
The self-check needs the paper’s full text.
Citations
Cites
Analysis of Relative Gene Expression Data Using Real-Time Quantitative PCR and the 2−ΔΔCT Method
Livak, K. J., & Schmittgen, T. D. (2001) · Methods · doi:10.1006/meth.2001.1262 · Cited by 180,860
Comprehensive Analysis of mRNA Methylation Reveals Enrichment in 3′ UTRs and near Stop Codons
Meyer, K. D., Saletore, Y., Zumbo, P., Elemento, O., Mason, C. E., & Jaffrey, S. R. (2012) · Cell · doi:10.1016/j.cell.2012.05.003 · Cited by 4,223
N6-Methyladenosine in nuclear RNA is a major substrate of the obesity-associated FTO
Jia, G., Fu, Y., Zhao, X., Dai, Q., Zheng, G., Yang, Y., Yi, C., Lindahl, T., Pan, T., Yang, Y.-G., et al. (2011) · Nature Chemical Biology · doi:10.1038/nchembio.687 · Cited by 4,106
Mutation of the mouse klotho gene leads to a syndrome resembling ageing
Kuro-o, M., Matsumura, Y., Aizawa, H., Kawaguchi, H., Suga, T., Utsugi, T., Ohyama, Y., Kurabayashi, M., Kaname, T., Kume, E., et al. (1997) · Nature · doi:10.1038/36285 · Cited by 3,837
Clinical and biomarker changes in dominantly inherited Alzheimer's disease
Bateman, R. J., Xiong, C., Benzinger, T. L. S., Fagan, A. M., Goate, A., Fox, N. C., Marcus, D. S., Cairns, N. J., Xie, X., Blazey, T. M., et al. (2012) · New England Journal of Medicine · doi:10.1056/nejmoa1202753 · Cited by 3,814
A METTL3–METTL14 complex mediates mammalian nuclear RNA N6-adenosine methylation
Liu, J., Yue, Y., Han, D., Wang, X., Fu, Y., Zhang, L., Jia, G., Yu, M., Lu, Z., Deng, X., et al. (2014) · Nature Chemical Biology · doi:10.1038/nchembio.1432 · Cited by 3,433
Vu, L., Pickering, B. F., Cheng, Y., Zaccara, S., Nguyen, D. T. T., Minuesa, G., Chou, T., Chow, A., Saletore, Y., MacKay, M. J., et al. (2017) · Nature Medicine · doi:10.1038/nm.4416 · Cited by 1,249
Dynamic m6A mRNA methylation directs translational control of heat shock response
Zhou, J. L., Wan, J., Gao, X., Zhang, X., Jaffrey, S. R., & Qian, S. (2015) · Nature · doi:10.1038/nature15377 · Cited by 1,228
Zhao, X., Yang, Y., Sun, B.-F., Shi, Y. X., Yang, X., Xiao, W., Hao, Y.-J., Ping, X., Chen, Y., Wang, W., et al. (2014) · Cell Research · doi:10.1038/cr.2014.151 · Cited by 1,201
Neurotoxicity of Amyloid -Protein: Synaptic and Network Dysfunction
Mucke, L., & Selkoe, D. J. (2012) · Cold Spring Harbor Perspectives in Medicine · doi:10.1101/cshperspect.a006338 · Cited by 1,000
A majority of m6A residues are in the last exons, allowing the potential for 3′ UTR regulationPreprint
Ke, S., Alemu, E. A., Mertens, C., Gantman, E. C., Fak, J. J., Mele, A., Haripal, B., Zucker-Scharff, I., Moore, M. J., Park, C. Y., et al. (2015) · Genes & Development · doi:10.1101/gad.269415.115 · Cited by 815
(2014) · doi:10.1523/jneurosci · Cited by 715
Hess, M. E., Heß, S., Meyer, K. D., Verhagen, L. A. W., Koch, L., Brönneke, H. S., Dietrich, M. O., Jordan, S. D., Saletore, Y., Elemento, O., et al. (2013) · Nature Neuroscience · doi:10.1038/nn.3449 · Cited by 559
N6-Methyl-Adenosine (m6A) in RNA: An Old Modification with A Novel Epigenetic Function
Niu, Y., Zhao, X., Yong-sheng, W., Li, M., Wang, X., & Yang, Y. (2012) · Genomics Proteomics & Bioinformatics · doi:10.1016/j.gpb.2012.12.002 · Cited by 522
Epitranscriptomic m6A Regulation of Axon Regeneration in the Adult Mammalian Nervous System
Weng, Y., Wang, X., An, R., Cassin, J., Vissers, C. B., Liu, Y., Liu, Y., Xu, T., Wang, X., Wong, S. Z. H., et al. (2018) · Neuron · doi:10.1016/j.neuron.2017.12.036 · Cited by 402
Fat mass and obesity-associated (FTO) protein regulates adult neurogenesis
Li, L., Zang, L., Zhang, F., Chen, J., Shen, H., Shu, L., Liang, F., Feng, C., Chen, D., Tao, H., et al. (2017) · Human Molecular Genetics · doi:10.1093/hmg/ddx128 · Cited by 337
RNA m6A methylation participates in regulation of postnatal development of the mouse cerebellum
Ma, C., Chang, M., Lv, H., Zhang, Z., Zhang, W., He, X., Wu, G., Zhao, S., Zhang, Y., Wang, D., et al. (2018) · Genome biology · doi:10.1186/s13059-018-1435-z · Cited by 250
Self-citationWidagdo, J., Zhao, Q., Kempen, M.-J., Tan, M. C., Ratnu, V. S., Wei, W., Leighton, L. J., Spadaro, P. A., Edson, J., Anggono, V., et al. (2016) · Journal of Neuroscience · doi:10.1523/jneurosci.4053-15.2016 · Cited by 247
Li, J., Han, Y., Zhang, H., Qian, Z., Jia, W., Gao, Y., Zheng, H., & Li, B. (2019) · Biochemical and Biophysical Research Communications · doi:10.1016/j.bbrc.2019.03.093 · Cited by 233
METTL3-mediated N6-methyladenosine mRNA modification enhances long-term memory consolidation
Zhang, Z., Wang, M., Xie, D., Huang, Z., Zhang, L., Yang, Y., Ma, D., Li, W., Zhou, Q., Wang, X., et al. (2018) · Cell Research · doi:10.1038/s41422-018-0092-9 · Cited by 211
Synaptic pathology: A shared mechanism in neurological disease
Henstridge, C. M., Pickett, E. K., & Spires‐Jones, T. L. (2016) · Ageing Research Reviews · doi:10.1016/j.arr.2016.04.005 · Cited by 176
The role of the fat mass and obesity associated gene (FTO) in breast cancer risk
Kaklamani, V., Yi, N., Sadim, M. S., Siziopikou, K. P., Zhang, K., Xu, Y., Tofilon, S., Agarwal, S., Pasche, B., & Mantzoros, C. S. (2011) · BMC Medical Genetics · doi:10.1186/1471-2350-12-52 · Cited by 171
Self-citationChang, M., Lv, H., Zhang, W., Ma, C., He, X., Zhao, S., Zhang, Z.-W., Zeng, Y., Song, S., Niu, Y., et al. (2017) · Open Biology · doi:10.1098/rsob.170166 · Cited by 158
Mettl14 Is Essential for Epitranscriptomic Regulation of Striatal Function and Learning
Koranda, J. L., Dore, L., Shi, H., Patel, M. J., Vaasjo, L. O., Rao, M. N., Chen, K., Lu, Z., Yi, Y., Chi, W., et al. (2018) · Neuron · doi:10.1016/j.neuron.2018.06.007 · Cited by 144
FTO is involved in Alzheimer's disease by targeting TSC1-mTOR-Tau signaling
Li, H., Ren, Y., Mao, K., Hua, F., Yang, Y., Wei, N., Yue, C., Li, D., & Zhang, H. (2018) · Biochemical and Biophysical Research Communications · doi:10.1016/j.bbrc.2018.02.201 · Cited by 143
Xiong, H., Callaghan, D., Wodzinska, J., Xu, J., Premyslova, M., Liu, Q., Connelly, J., & Zhang, W. (2011) · Neuroscience Bulletin · doi:10.1007/s12264-011-1015-7 · Cited by 106
Update: Mechanisms Underlying N 6 -Methyladenosine Modification of Eukaryotic mRNA
Wang, Y., & Zhao, J. C. (2016) · Trends in Genetics · doi:10.1016/j.tig.2016.09.006 · Cited by 60
Self-citationIzco, M., Martinez, P. M., Corrales, A., Fandos, N., García-Cerro, S., Insua, D., Montañés, M., Pérez‐Grijalba, V., Rueda, N., Vidal, V., et al. (2014) · Neuroscience · doi:10.1016/j.neuroscience.2014.01.003 · Cited by 46
Fu, Y., Zorman, B., Sumazin, P., Sanna, P. P., & Repunte‐Canonigo, V. (2019) · PLoS ONE · doi:10.1371/journal.pone.0203566 · Cited by 12
Cited by
Sorted by citations
The role of m6A modification in the biological functions and diseases
Jiang, X., Liu, B., Nie, Z., Duan, L., Xiong, Q., Jin, Z., Yang, C., & Chen, Y. (2021) · Signal Transduction and Targeted Therapy · doi:10.1038/s41392-020-00450-x · Cited by 2,335
Epigenetic regulation of aging: implications for interventions of aging and diseases
Kang, W., Liu, H., Hu, Q., Wang, L., Liu, J., Zheng, Z., Zhang, W., Ren, J., Zhu, F., & Liu, G. (2022) · Signal Transduction and Targeted Therapy · doi:10.1038/s41392-022-01211-8 · Cited by 732
Phase separation and neurodegenerative diseases: a disturbance in the force
Zbinden, A., Pérez-Berlanga, M., De Rossi, P., & Polymenidou, M. (2020) · Developmental Cell · doi:10.1016/j.devcel.2020.09.014 · Cited by 500
Shafik, A. M., Zhang, F., Guo, Z., Dai, Q., Pajdzik, K., Li, Y., Kang, Y., Yao, B., Wu, H., He, C., et al. (2021) · Genome biology · doi:10.1186/s13059-020-02249-z · Cited by 264
mRNA modifications in cardiovascular biology and disease: with a focus on m6A modification
Kumari, R., Ranjan, P., Suleiman, Z. G., Goswami, S. K., Li, J., Prasad, R., & Verma, S. K. (2021) · Cardiovascular Research · doi:10.1093/cvr/cvab160 · Cited by 221
Metadata
- Authors
- Han, M., Liu, Z., Xu, Y., Liu, X., Wang, D., Li, F., Wang, Y., & Bi, J.
- Affiliations
- Second Hospital of Shandong University (CN)
- Shandong University (CN)
- Corresponding author
- Wang, Yun
- Venue
- Frontiers in Neuroscience
- Publisher
- Frontiers Media SA
- Published
- 2020-02-28
- Volume
- 14
- Pages
- 98-98
- ISSN
- 1662-453X (ISSN-L)
- PMC
- PMC7058666
- OpenAlex
- W3008232393
- Cited by
- 286
- References
- 29
- Citations by year
- 2026: 26 · 2025: 25 · 2024: 43 · 2023: 64 · 2022: 52 · 2021: 62 · 2020: 14
- FWCI
- 16.79
- Type
- journal article
- Language
- en
- Open access
- gold
- doi.org
- Licence
- Locations
- Frontiers in Neuroscience (publishedVersion, cc-by)
- PubMed Central (publishedVersion, cc-by)
- PubMed (publishedVersion)
- DOAJ (DOAJ: Directory of Open Access Journals) (submittedVersion, cc-by-sa)
- Funders
- National Natural Science Foundation of China
- Topics
- Life Sciences › Biochemistry, Genetics and Molecular Biology › Molecular Biology › RNA modifications and cancer
- Life Sciences › Neuroscience › Cellular and Molecular Neuroscience › Alzheimer's disease research and treatments
- Life Sciences › Biochemistry, Genetics and Molecular Biology › Molecular Biology › RNA regulation and disease
- Keywords
- Alzheimer's disease, N6-methyladenosine, RNA methylation, APP/PS1 mice, synaptic dysfunction, hippocampus, cortex, neurodegeneration
About these checks
Registry, retraction, Cites and statistics results are computed, not judged, with one exception: a printed reference that no index lists is read once by a model before it counts as a citation error. Claims are extracted by a model and kept only when their quote appears verbatim in the text; each cited source is then checked, with a model’s help, for whether it says what the claim relies on. Those verdicts can be wrong — read the claim’s quote and the cited source before relying on one.
Statistics and arithmetic are recomputed, not judged.
Confidence bands are shown only for fields calibrated on our annotated test set. None is calibrated yet, so no band is shown.
What counts as a claim ›How we measure confidence ›How we check this ›
Are you an author, or do you see a problem with this page? Request a review
