Student or educator? Sign up with your school email and get 6 months of Pro free.
Cited by 65

The DOI matches its Crossref record.

The Anti-tumor Effects of p-Coumaric Acid on Melanoma A375 and B16 Cells

Hu, Xue, Yang, Zihui, Liu, Wenjing, Pan, Zhaohai, Zhang, Xin, Li, Minjing, Liu, Xiaona, Zheng, Qiusheng, Li, Defang·2020·Frontiers in Oncology

Overview

The claims and statistics of this paper haven’t been checked yet.

Run the check — free, no account needed. It reads the open-access text and checks the sources it cites.

A few free checks a day · papers already verified open instantly · results are public

Integrity signals

Registry

Crossref · 10.3389/fonc.2020.558414

Cites

Statistics

Figures

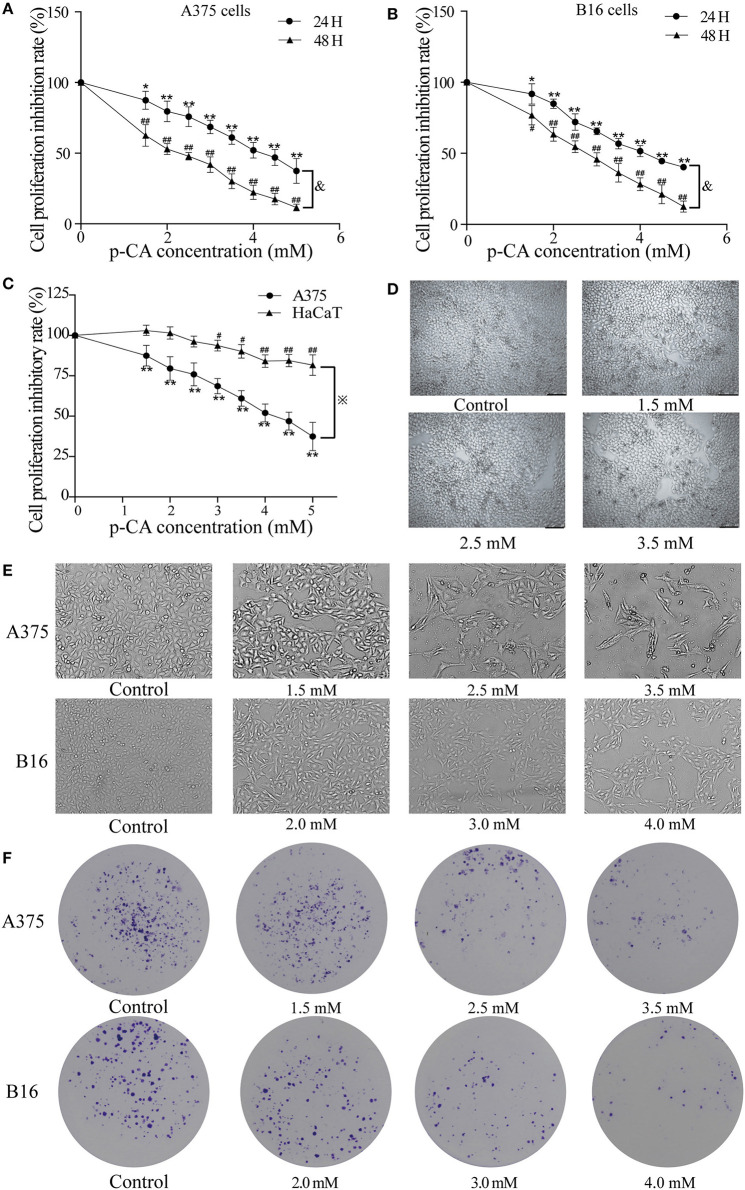
Figure 1 p-CA inhibits proliferation and colony formation of A375 and B16 cells. (A,B) A375 and B16 cells were treated with p-CA. After incubation for 24 or 48 h, the proliferation rates of A375 and B16 cells were measured by CCK-8 assay. (C) HaCaT, A375 and B16 cells were treated with p-CA. After incubation for 24 h, the proliferation rates of HaCaT, A375 and B16 cells were measured by CCK-8 assay. (D) Morphological changes of p-CA-treated HaCaT cells were observed under a phase contrast microscope. (E) Morphological changes of A375 and B16 cells were observed under a phase contrast microscope. Scale bar, 50 μm. (F) The cell colonies were stained with crystal violet and observed under an inverted microscope. All data are expressed as the mean ± SD of three independent experiments. &P < 0.05 compared with the A375 or B16 cells after p-CA treatment for 24 h. *P < 0.05, **P < 0.01, #P < 0.05, ##P < 0.01 compared with the control.
Figure 1 p-CA inhibits proliferation and colony formation of A375 and B16 cells. (A,B) A375 and B16 cells were treated with p-CA. After incubation for 24 or 48 h, the proliferation rates of A375 and B16 cells were measured by CCK-8 assay. (C) HaCaT, A375 and B16 cells were treated with p-CA. After incubation for 24 h, the proliferation rates of HaCaT, A375 and B16 cells were measured by CCK-8 assay. (D) Morphological changes of p-CA-treated HaCaT cells were observed under a phase contrast microscope. (E) Morphological changes of A375 and B16 cells were observed under a phase contrast microscope. Scale bar, 50 μm. (F) The cell colonies were stained with crystal violet and observed under an inverted microscope. All data are expressed as the mean ± SD of three independent experiments. &P < 0.05 compared with the A375 or B16 cells after p-CA treatment for 24 h. *P < 0.05, **P < 0.01, #P < 0.05, ##P < 0.01 compared with the control.CC BY · PubMed Central
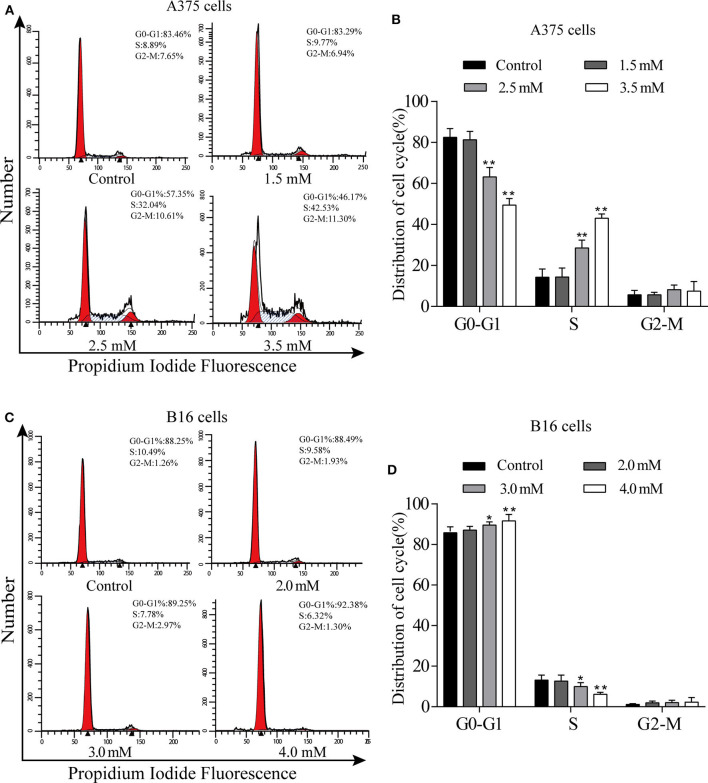
Figure 2 p-CA causes A375 and B16 cell cycle arrest. (A) The cell cycle distribution of A375 cells treated with p-CA was measured by flow cytometry. (B) Statistical analysis of the cell cycle distribution of A375 cells treated with p-CA. (C) The cell cycle distribution of B16 cells treated with p-CA was measured by flow cytometry. (D) Statistical analysis of the cell cycle distribution of B16 cells treated with p-CA. All data are expressed as the mean ± SD of three independent experiments. *P < 0.05, **P < 0.01 compared with the control.
Figure 2 p-CA causes A375 and B16 cell cycle arrest. (A) The cell cycle distribution of A375 cells treated with p-CA was measured by flow cytometry. (B) Statistical analysis of the cell cycle distribution of A375 cells treated with p-CA. (C) The cell cycle distribution of B16 cells treated with p-CA was measured by flow cytometry. (D) Statistical analysis of the cell cycle distribution of B16 cells treated with p-CA. All data are expressed as the mean ± SD of three independent experiments. *P < 0.05, **P < 0.01 compared with the control.CC BY · PubMed Central
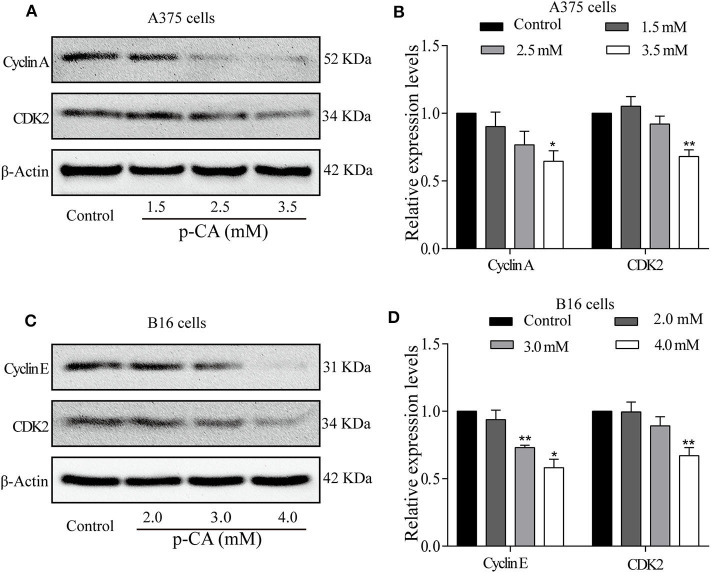
Figure 3 p-CA regulates the activity of Cyclin–CDK complexes and cell cycle progression. (A) The protein levels of Cyclin A and CDK2 in A375 cells treated with p-CA, as measured by western blot. (B) Statistical analysis of Cyclin A and CDK2 levels in A375 cells. The ratio of protein levels was standardized according to the value of the control. (C) The protein levels of Cyclin E and CDK2 in B16 cells treated with p-CA, as measured by western blot. (D) Statistical analysis of Cyclin E and CDK2 levels in B16 cells. The ratio of protein levels was standardized according to the value of the control. All data are expressed as the mean ± SD of three independent experiments. *P < 0.05, **P < 0.01 compared with the control.
Figure 3 p-CA regulates the activity of Cyclin–CDK complexes and cell cycle progression. (A) The protein levels of Cyclin A and CDK2 in A375 cells treated with p-CA, as measured by western blot. (B) Statistical analysis of Cyclin A and CDK2 levels in A375 cells. The ratio of protein levels was standardized according to the value of the control. (C) The protein levels of Cyclin E and CDK2 in B16 cells treated with p-CA, as measured by western blot. (D) Statistical analysis of Cyclin E and CDK2 levels in B16 cells. The ratio of protein levels was standardized according to the value of the control. All data are expressed as the mean ± SD of three independent experiments. *P < 0.05, **P < 0.01 compared with the control.CC BY · PubMed Central
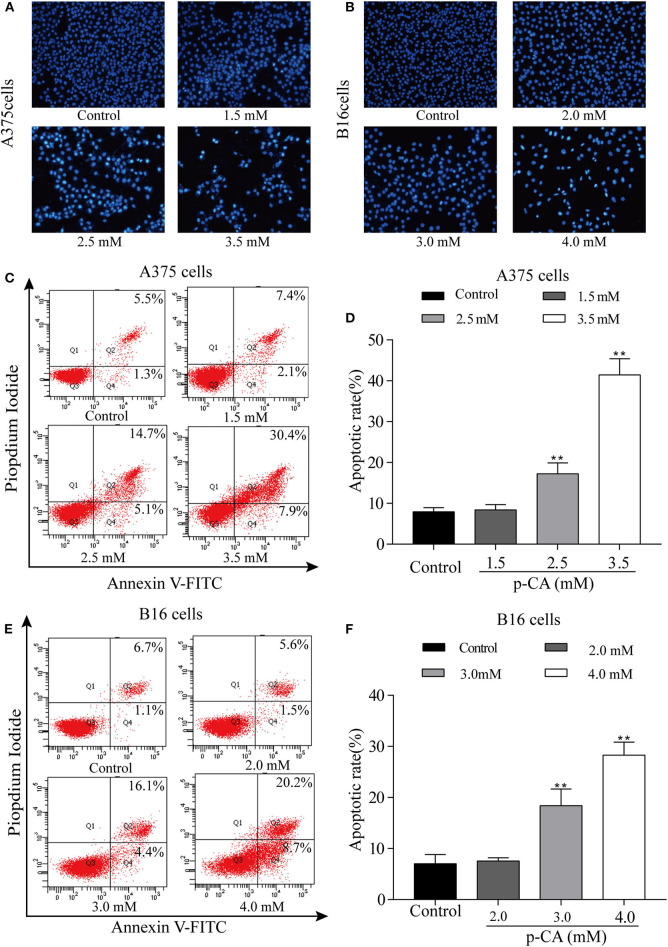
Figure 4 p-CA induces A375 and B16 cell apoptosis. (A,B) After Hoechst 33,258 staining, the nucleus of A375 and B16 cells treated with p-CA showed morphological changes typical of apoptosis. (C) The apoptosis rate of A375 cells treated with p-CA was measured by Annexin V-FITC/PI double staining. (D) Statistical analysis of the apoptosis rate of A375 cells treated with p-CA. (E) The apoptosis rate of B16 cells treated with p-CA was measured by Annexin V-FITC/PI double staining. (F) Statistical analysis of the apoptosis rate of B16 cells treated with p-CA. All data are expressed as the mean ± SD of three independent experiments. **P < 0.01 compared with the control.
Figure 4 p-CA induces A375 and B16 cell apoptosis. (A,B) After Hoechst 33,258 staining, the nucleus of A375 and B16 cells treated with p-CA showed morphological changes typical of apoptosis. (C) The apoptosis rate of A375 cells treated with p-CA was measured by Annexin V-FITC/PI double staining. (D) Statistical analysis of the apoptosis rate of A375 cells treated with p-CA. (E) The apoptosis rate of B16 cells treated with p-CA was measured by Annexin V-FITC/PI double staining. (F) Statistical analysis of the apoptosis rate of B16 cells treated with p-CA. All data are expressed as the mean ± SD of three independent experiments. **P < 0.01 compared with the control.CC BY · PubMed Central
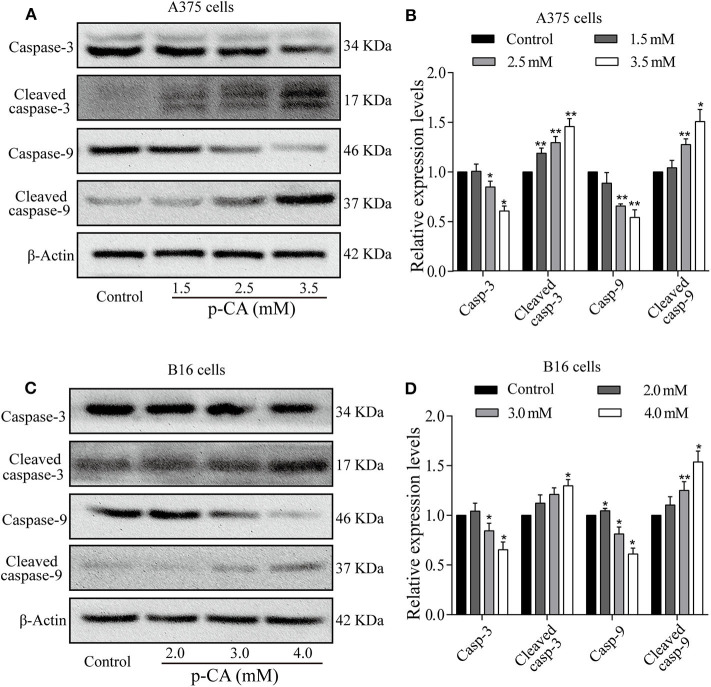
Figure 5 Effects of p-CA on apoptosis-related proteins. (A) The protein levels of caspase-3/9 and cleaved caspase-3/9 in A375 cells treated with p-CA were measured by western blot. (B) The relative protein levels of caspase-3/9 and cleaved caspase-3/9 in A375 cells treated with p-CA were statistically analyzed. (C) The protein levels of caspase-3/9 and cleaved caspase-3/9 in B16 cells treated with p-CA were measured by western blot. (D) The relative protein levels of caspase-3/9 and cleaved caspase-3/9 in B16 cells treated with p-CA were statistically analyzed. The ratio of protein levels is normalized according to the value of the control group. All data are expressed as the mean ± SD of three independent experiments. *P < 0.05, **P < 0.01 compared with the control.
Figure 5 Effects of p-CA on apoptosis-related proteins. (A) The protein levels of caspase-3/9 and cleaved caspase-3/9 in A375 cells treated with p-CA were measured by western blot. (B) The relative protein levels of caspase-3/9 and cleaved caspase-3/9 in A375 cells treated with p-CA were statistically analyzed. (C) The protein levels of caspase-3/9 and cleaved caspase-3/9 in B16 cells treated with p-CA were measured by western blot. (D) The relative protein levels of caspase-3/9 and cleaved caspase-3/9 in B16 cells treated with p-CA were statistically analyzed. The ratio of protein levels is normalized according to the value of the control group. All data are expressed as the mean ± SD of three independent experiments. *P < 0.05, **P < 0.01 compared with the control.CC BY · PubMed Central
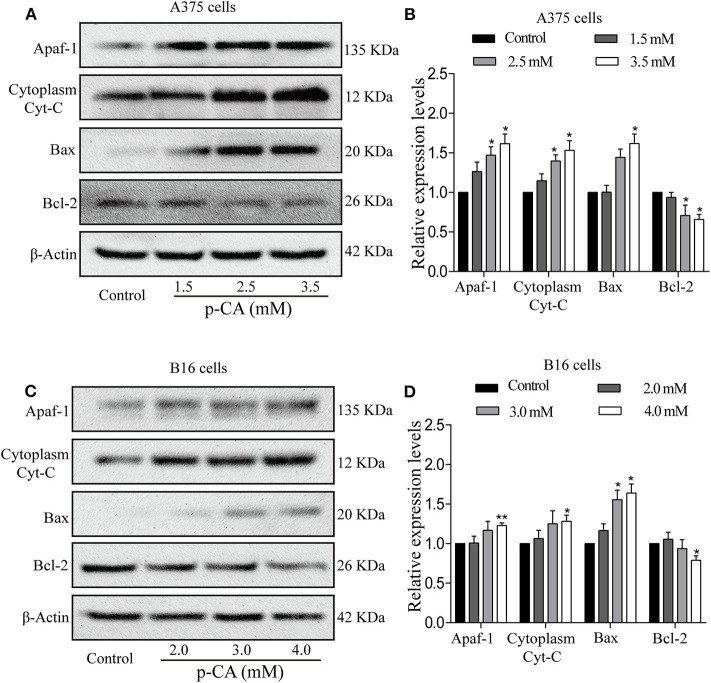
Figure 6 p-CA induces A375 and B16 cell apoptosis through the Bcl-2/Bax signaling pathway. (A) The protein levels of Apaf1, cytoplasmic Cyto-C, Bax, and Bcl-2 in A375 cells treated with p-CA were measured by western blot. (B) Statistical analysis of the relative protein levels of Apaf1, cytoplasmic Cyto-C, Bax, and Bcl-2 in A375 cells treated with p-CA. The ratio of protein levels was normalized according to the value of the control. (C) The protein levels of Apaf1, cytoplasmic Cyto-C, Bax, and Bcl-2 in B16 cells treated with p-CA were measured by western blot. (D) Statistical analysis of the relative protein levels of Apaf1, cytoplasmic Cyto-C, Bax, and Bcl-2 in B16 cells treated with p-CA. The ratio of protein levels was normalized according to the value of the control. All data are expressed as the mean ± SD of three independent experiments. *P < 0.05, **P < 0.01 compared with the corresponding control.
Figure 6 p-CA induces A375 and B16 cell apoptosis through the Bcl-2/Bax signaling pathway. (A) The protein levels of Apaf1, cytoplasmic Cyto-C, Bax, and Bcl-2 in A375 cells treated with p-CA were measured by western blot. (B) Statistical analysis of the relative protein levels of Apaf1, cytoplasmic Cyto-C, Bax, and Bcl-2 in A375 cells treated with p-CA. The ratio of protein levels was normalized according to the value of the control. (C) The protein levels of Apaf1, cytoplasmic Cyto-C, Bax, and Bcl-2 in B16 cells treated with p-CA were measured by western blot. (D) Statistical analysis of the relative protein levels of Apaf1, cytoplasmic Cyto-C, Bax, and Bcl-2 in B16 cells treated with p-CA. The ratio of protein levels was normalized according to the value of the control. All data are expressed as the mean ± SD of three independent experiments. *P < 0.05, **P < 0.01 compared with the corresponding control.CC BY · PubMed Central

Verification

Claims the paper makes

The claims and statistics of this paper haven’t been checked yet.

Run the check — free, no account needed. It reads the open-access text and checks the sources it cites.

A few free checks a day · papers already verified open instantly · results are public

Claims other papers make about this one

Each is checked against this paper’s own text: does it say what the citing paper says it does?

Self-check

Percentages, sums and reported differences re-computed from the paper’s own numbers.

The self-check needs the paper’s full text.

Citations

Cites

No references could be resolved yet.

Research works printed but not linked: 25

  1. Leonardi, 2018, Cutaneous melanoma: from pathogenesis to therapy (Review), Int J Oncol., 52, 1071, 10.3892/ijo.2018.4287 · DOI
  2. Kwiatkowska, 2019, Beyond PD-1 immunotherapy in malignant melanoma, Dermatol Ther., 9, 243, 10.1007/s13555-019-0292-3 · DOI
  3. Pei, 2016, p-Coumaric acid and its conjugates: dietary sources, pharmacokinetic properties and biological activities, J Sci Food Agric., 96, 2952, 10.1002/jsfa.7578 · DOI
  4. Shen, 2019, Protective effects of p-coumaric acid against oxidant and hyperlipidemia-an in vitro and in vivo evaluation, Biomed Pharmacother., 111, 579, 10.1016/j.biopha.2018.12.074 · DOI · Paper page
  5. Sharma, 2018, Antiproliferative effect of p-Coumaric acid targets UPR activation by downregulating Grp78 in colon cancer, Chem Biol Interact., 291, 16, 10.1016/j.cbi.2018.06.001 · DOI
  6. Amalan, 2016, Antidiabetic and antihyperlipidemic activity of p-coumaric acid in diabetic rats, role of pancreatic GLUT 2: In vivo approach, Biomed Pharmacother., 84, 230, 10.1016/j.biopha.2016.09.039 · DOI
  7. Jaganathan, 2013, Events associated with apoptotic effect of p-Coumaric acid in HCT-15 colon cancer cells, World J Gastroenterol., 19, 7726, 10.3748/wjg.v19.i43.7726 · DOI
  8. Nasr Bouzaiene, 2015, The effects of caffeic, coumaric and ferulic acids on proliferation, superoxide production, adhesion and migration of human tumor cells in vitro, Eur J Pharmacol., 766, 99, 10.1016/j.ejphar.2015.09.044 · DOI
  9. Sharma, 2019, Supplementation of p-coumaric acid exhibits chemopreventive effect via induction of Nrf2 in a short-term preclinical model of colon cancer, Eur J Cancer Prev., 28, 472, 10.1097/CEJ.0000000000000496 · DOI
  10. Arruda, 2020, Effect of light, oxygen and temperature on the stability of artepillin C and p-coumaric acid from Brazilian green propolis, J Pharm Biomed Anal., 178, 112922, 10.1016/j.jpba.2019.112922 · DOI
  11. Wang, 2009, Centrosome-associated regulators of the G2/M checkpoint as targets for cancer therapy, Mol Cancer., 8, 8, 10.1186/1476-4598-8-8 · DOI
  12. Wang, 2017, Cell cycle arrest as a therapeutic target of acute kidney injury, Curr Protein Pept Sci., 18, 1224, 10.2174/1389203717666160915162238 · DOI
  13. Park, 2003, Cell cycle and cancer, J Biochem Mol Biol., 36, 60, 10.5483/BMBRep.2003.36.1.060 · DOI
  14. Roberts, 1994, Cyclins, Cdks, and cyclin kinase inhibitors, Cold Spring Harb Symp Quant Biol., 59, 31, 10.1101/SQB.1994.059.01.006 · DOI
  15. Bertoli, 2013, Control of cell cycle transcription during G1 and S phases, Nat Rev Mol Cell Biol., 14, 518, 10.1038/nrm3629 · DOI
  16. Chen, 1996, Association of spindle assembly checkpoint component XMAD2 with unattached kinetochores, Science., 274, 242, 10.1126/science.274.5285.242 · DOI
  17. Bartek, 2001, Mammalian G1- and S-phase checkpoints in response to DNA damage, Curr Opin Cell Biol., 13, 738, 10.1016/S0955-0674(00)00280-5 · DOI
  18. Kerr, 1972, Apoptosis: a basic biological phenomenon with wide-ranging implications in tissue kinetics, Br J Cancer., 26, 239, 10.1038/bjc.1972.33 · DOI
  19. Cohen, 1997, Caspases: the executioners of apoptosis, Biochem J., 326, 1, 10.1042/bj3260001 · DOI
  20. Gamen, 1998, Caspases are the main executioners of Fas-mediated apoptosis, irrespective of the ceramide signalling pathway, Cell Death Differ., 5, 241, 10.1038/sj.cdd.4400344 · DOI
  21. Liao, 2015, The impact of Caspase-8 on non-small cell lung cancer brain metastasis in II/III stage patient, Neoplasma., 9, 91, 10.4149/neo_2015_043 · DOI
  22. Bratton, 2000, Protein complexes activate distinct caspase cascades in death receptor and stress-induced apoptosis, Exp Cell Res., 256, 27, 10.1006/excr.2000.4835 · DOI
  23. Takahashi, 1999, Caspase: executioner and undertaker of apoptosis, Int J Hematol., 70, 226
  24. Cecka, 2008, Expression of bcl-2 in breast cancer: correlation with clinicopathological characteristics and survival, Acta Medica., 51, 107, 10.14712/18059694.2017.11 · DOI
  25. Strasser, 2011, Deciphering the rules of programmed cell death to improve therapy of cancer and other diseases, EMBO J., 30, 3667, 10.1038/emboj.2011.307 · DOI

Cited by

See all 65

Metadata

Authors
Hu, X., Yang, Z., Liu, W., Pan, Z., Zhang, X., Li, M., Liu, X., Zheng, Q., & Li, D.
Venue
Frontiers in Oncology
Published
2020-10-16
Volume
10
ISSN
2234-943X
Cited by
65
References
0
Funders
Innovative Research Group Project of the National Natural Science Foundation of China (31870338, 81872162)

About these checks

Registry, retraction, Cites and statistics results are computed, not judged, with one exception: a printed reference that no index lists is read once by a model before it counts as a citation error. Claims are extracted by a model and kept only when their quote appears verbatim in the text; each cited source is then checked, with a model’s help, for whether it says what the claim relies on. Those verdicts can be wrong — read the claim’s quote and the cited source before relying on one.

Statistics and arithmetic are recomputed, not judged.

Confidence bands are shown only for fields calibrated on our annotated test set. None is calibrated yet, so no band is shown.

What counts as a claim ›How we measure confidence ›How we check this ›

Are you an author, or do you see a problem with this page? Request a review

How to cite

Cite CoChat for the checks on this page, and the paper for its own findings.

This page
CoChat. (2026). Citation check: The Anti-tumor Effects of p-Coumaric Acid on Melanoma A375 and B16 Cells. https://app.cochat.ai/papers/10.3389/fonc.2020.558414
The paper
Hu, X., Yang, Z., Liu, W., Pan, Z., Zhang, X., Li, M., Liu, X., Zheng, Q., & Li, D. (2020). The Anti-tumor Effects of p-Coumaric Acid on Melanoma A375 and B16 Cells. Frontiers in Oncology. https://doi.org/10.3389/fonc.2020.558414

Data sources

Bibliographic data: Semantic Scholar, OpenAlex, Crossref.

Contains information from the Semantic Scholar Academic Graph Datasets, made available under the ODC Attribution License (ODC-BY 1.0).

Semantic Scholar’s data is described in: Kinney, R., et al. (2023). The Semantic Scholar Open Data Platform. arXiv:2301.10140.