

The DOI matches its Crossref record; 29 of the 29 references it cites were found in a registry or an index; none of the 23 sources its claims cite is checked for support yet.
Immediate Effects of Smoking on Cardiorespiratory Responses During Dynamic Exercise: Arm Vs. Leg Ergometry
Open accessAbstract
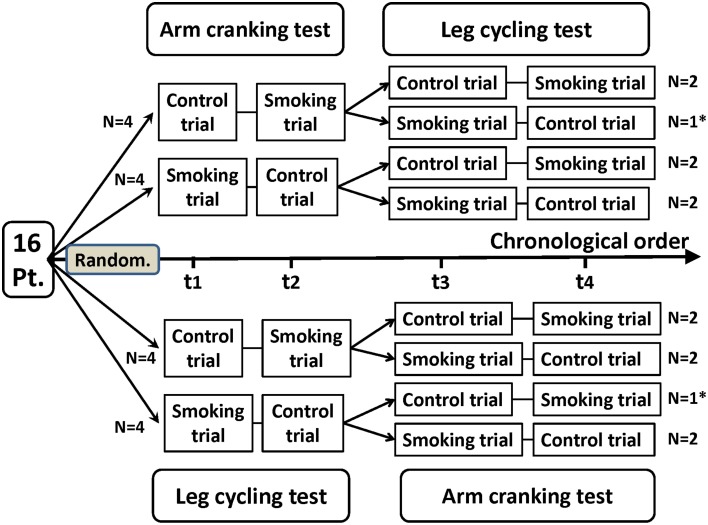
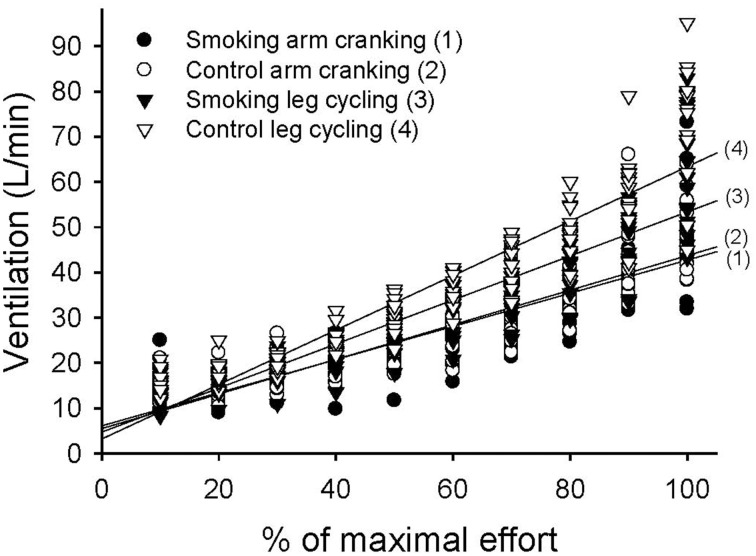
PURPOSE: This study compared the immediate effects of smoking on cardiorespiratory responses to dynamic arm and leg exercises. METHODS: This randomized crossover study recruited 14 college students. Each participant underwent two sets of arm-cranking (AC) and leg-cycling (LC) exercise tests. The testing sequences of the control trial (participants refrained from smoking for 8 h before testing) and the experimental trial (participants smoked two cigarettes immediately before testing) were randomly chosen. We observed immediate changes in pulmonary function and heart rate variability after smoking and before the exercise test. The participants then underwent graded exercise tests of their arms and legs until reaching exhaustion. We compared the peak work achieved and time to exhaustion during the exercise tests with various cardiorespiratory indices [i.e., heart rate, oxygen consumption (VO2), minute ventilation (VE)]. The differences between the smoking and control trials were calculated using paired t-tests. For the exercise test periods, VO2, heart rate, and VE values were calculated at every 10% increment of the maximal effort time. The main effects of the time and trial, as well as their trial-by-time (4 × 10) interaction effects on the outcome measures, were investigated using repeated measure ANOVA with trend analysis. RESULTS: 5 min after smoking, the participants exhibited reduced forced vital capacities and forced expiratory volumes in the first second (P < 0.05), in addition to elevated resting heart rates (P < 0.001). The high-frequency, low-frequency, and the total power of the heart rate variability were also reduced (P < 0.05) at rest. For the exercise test periods, smoking reduced the time to exhaustion (P = 0.005) and the ventilatory threshold (P < 0.05) in the LC tests, whereas no significant effects were observed in the AC tests. A trend analysis revealed a significant trial-by-time interaction effect for heart rate, VO2, and VE during the graded exercise test (all P < 0.001). Lower VO2 and VE levels were exhibited in the exercise response of the smoking trial than in those of the control LC trials, whereas no discernable inter-trial difference was observed in the AC trials. Moreover, the differences in heart rate and VE response between the LC and AC exercises were significantly smaller after the participants smoked. CONCLUSION: This study verified that smoking significantly decreased performance and cardiorespiratory responses to leg exercises. However, the negative effects of smoking on arm exercise performance were not as pronounced.
Overview
CoChat Summary
TL;DR
In a randomized crossover trial of 14 young male smokers, smoking two cigarettes immediately reduced pulmonary function and heart rate variability and impaired leg-cycling exercise performance more than arm-cranking performance. The negative effects on arm exercise were not as pronounced, with no significant smoking-related change in arm time to exhaustion.
Key findings
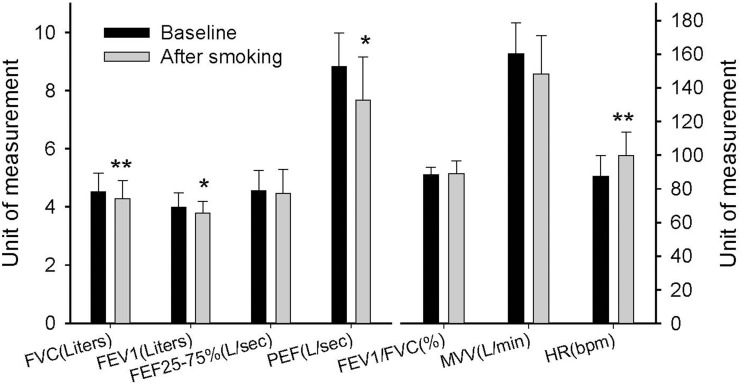
- Five minutes after smoking, FVC (P = 0.003), FEV1 (P = 0.033), and PEF (P = 0.013) decreased, and resting heart rate increased (P < 0.001).
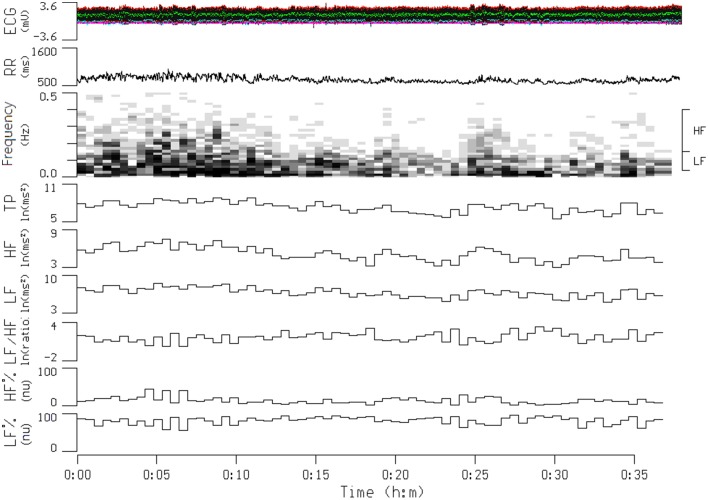
- HRV decreased after smoking: R-R interval fell from 712.73 ± 93.06 to 622.29 ± 103.82 ms (P = 0.001), total power from 7.59 ± 0.72 to 6.79 ± 1.00 ln(ms²) (P = 0.014), LF from 7.03 ± 0.79 to 6.27 ± 1.08 ln(ms²) (P = 0.026), and HF from 5.25 ± 0.83 to 4.38 ± 1.33 ln(ms²) (P = 0.028).
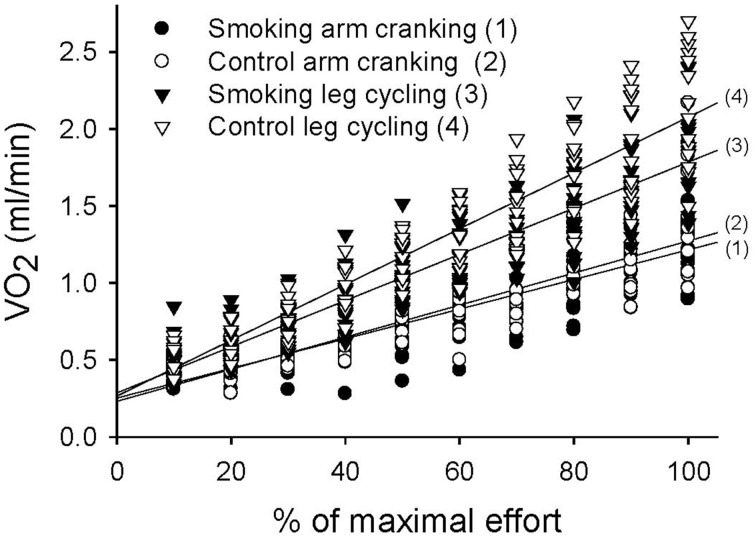
- In leg cycling, smoking reduced peak power (P = 0.005) and time to exhaustion (P = 0.005); at the ventilatory threshold, VO2 (P = 0.002), VE (P < 0.001), heart rate (P = 0.038), and RER (P = 0.048) were lower in the smoking trial.
- In arm cranking, peak power was lower after smoking (P = 0.036), but time to exhaustion did not differ significantly (P = 0.098); no significant smoking effects were observed for arm VO2, VE, RER, or workload at the ventilatory threshold.
Methods
- Randomized crossover design: 16 moderately trained male smokers initially volunteered, 14 completed all sessions (mean age 20.4 ± 1.5 years; smoking duration 4.0 ± 2.0 years; 9.9 ± 2.9 cigarettes/day).
- Each participant completed four sessions: control trials after refraining from smoking for at least 8 h, and experimental trials after smoking two cigarettes (10 mg tar and 0.7 mg nicotine each) immediately before arm-cranking and leg-cycling graded exercise tests to exhaustion.
- Pulmonary function and HRV were measured before and after smoking; exercise outcomes included peak power, time to exhaustion, ventilatory threshold, and VO2, heart rate, and VE calculated at every 10% increment of maximal effort time. Paired t-tests and repeated-measures MANOVA with trend analysis were used.
Limitations
- Stated: the study investigated immediate smoking responses in moderately trained people during maximal arm and leg exercise and cannot determine the impact of smoking on arm aerobic performance in elite athletes.
- Evident: the final sample was small (n = 14), all male, young, and regular smokers, limiting generalizability to women, older adults, non-smokers, or other training levels.
- Evident: the authors note that muscle glycogen and lactate concentrations were not measured, so proposed mechanisms related to substrate use remain indirect.
Model-written summary. Check it against the paper before relying on it.
Integrity signals
Registry
Cites
Statistics
Figures
Verification
Claims the paper makes
0 Valid · 1 Not valid · 18 Not checked · 100 Own results and interpretations
A result the paper reports from its own data — it cites no other source for it, so there is none to check. The quote shows it is in the paper.
In the paper
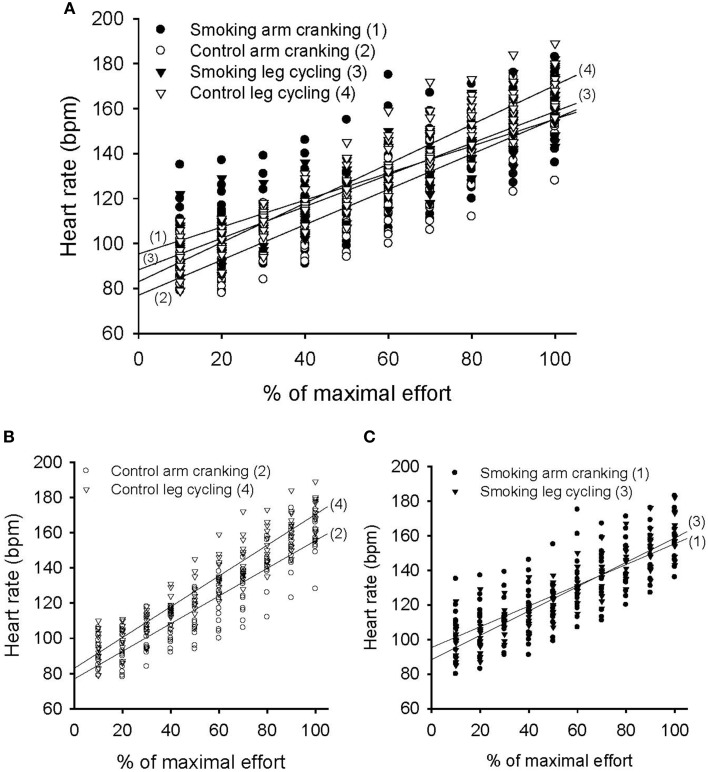
“The intertrial difference in heart rate responses was also significant (F = 5.08, P = 0.005) (Figure 6A).”
§ Immediate Effects of Smoking on Cardiorespiratory Responses During Dynamic Exercise: Arm Vs. Leg Ergometry > Results
plain- Asserted: passes — The authors put it forward as true.
- Checkable: passes — It can be checked against evidence.
- Load-bearing: passes — The paper’s conclusions depend on it.
- Based: passes — The paper gives a reason why it holds.
A result the paper reports from its own data — it cites no other source for it, so there is none to check. The quote shows it is in the paper.
In the paper
“The MANOVA comparison of the VO2 data collected during the exercise tests resulted in a significant trial-by-time interaction [F(27, 351) = 21.62, P < 0.001]; the intertrial difference in VO2 was also significant [F(3, 39) = 58.46, P < 0.001] (Figure 4).”
§ Immediate Effects of Smoking on Cardiorespiratory Responses During Dynamic Exercise: Arm Vs. Leg Ergometry > Results
plainn = 14- Asserted: passes — The authors put it forward as true.
- Checkable: passes — It can be checked against evidence.
- Load-bearing: passes — The paper’s conclusions depend on it.
- Based: passes — The paper gives a reason why it holds.
A result the paper reports from its own data — it cites no other source for it, so there is none to check. The quote shows it is in the paper.
In the paper
“A trend analysis revealed a significant trial-by-time interaction effect for heart rate, VO2, and VE during the graded exercise test (all P < 0.001).”
§ Immediate Effects of Smoking on Cardiorespiratory Responses During Dynamic Exercise: Arm Vs. Leg Ergometry > Abstract
plainstates an association- Asserted: passes — The authors put it forward as true.
- Checkable: passes — It can be checked against evidence.
- Load-bearing: passes — The paper’s conclusions depend on it.
- Based: passes — The paper gives a reason why it holds.
A result the paper reports from its own data — it cites no other source for it, so there is none to check. The quote shows it is in the paper.
In the paper
“However, the post-hoc analysis revealed significant differences between the control and smoking LC trials (regression line 4 vs. line 3 in Figure 4, mean difference = 0.15 ± 0.04, P = 0.027), between the control AC and LC trials (line 2 vs. line 4, mean difference = −0.46±0.04, P < 0.001), and between the smoking AC and LC trials (line 1 vs. line 3, mean difference = −0.33±0.03, P < 0.001).”
§ Immediate Effects of Smoking on Cardiorespiratory Responses During Dynamic Exercise: Arm Vs. Leg Ergometry > Results
plainn = 14- Asserted: passes — The authors put it forward as true.
- Checkable: passes — It can be checked against evidence.
- Load-bearing: passes — The paper’s conclusions depend on it.
- Based: passes — The paper gives a reason why it holds.
A result the paper reports from its own data — it cites no other source for it, so there is none to check. The quote shows it is in the paper.
In the paper
“In the AC test, although the peak power was lower in the smoking trial than in the control trial (P = 0.036), there was no significant difference in time to exhaustion (P = 0.098).”
§ Immediate Effects of Smoking on Cardiorespiratory Responses During Dynamic Exercise: Arm Vs. Leg Ergometry > Results
plainn = 14- Asserted: passes — The authors put it forward as true.
- Checkable: passes — It can be checked against evidence.
- Load-bearing: passes — The paper’s conclusions depend on it.
- Based: passes — The paper gives a reason why it holds.
87 more claims
Create a free account to see all 119 claims and to verify the 22 references still open.
- It may state two separate claims as one. 19
- Probably not a substantial claim. 9
Statistics recomputed
Every reported test result, recomputed from its test statistic and degrees of freedom. A result shows as not adding up only once an independent check has confirmed it.
- ConsistentF(27, 351) = 21.62reported p < .001 · recomputed p < .001
“F(27, 351) = 21.62, p < .001”
- ConsistentF(3, 39) = 58.46reported p < .001 · recomputed p < .001
“F(3, 39) = 58.46, p < .001”
- ConsistentF(9, 117) = 317.94reported p < .001 · recomputed p < .001
“F(9, 117) = 317.94, p < .001”
Self-check
Percentages, sums and reported differences re-computed from the paper’s own numbers.
Self-check results appear here once an independent check has confirmed them.
Citations
Cites
Heart Rate Variability: Standards of Measurement, Physiological Interpretation, and Clinical Use
Electrophysiology, T. F. O. T. E. S. O. C. T. N. A. (1996) · Circulation · doi:10.1161/01.cir.93.5.1043 · Cited by 17,159
Data on the distribution of fibre types in thirty-six human muscles
Johnson, M. A., Polgar, J., Weightman, D., & Appleton, D. (1973) · Journal of the Neurological Sciences · doi:10.1016/0022-510x(73)90023-3 · Cited by 2,200
Effect of aging on gender differences in neural control of heart rate
Kuo, T. B. J., Lin, T., Yang, C. C. H., Li, C.-L., Chen, C.-F., & Chou, P. (1999) · American Journal of Physiology-Heart and Circulatory Physiology · doi:10.1152/ajpheart.1999.277.6.h2233 · Cited by 562
Self-citationTransfer function analysis of autonomic regulation. I. Canine atrial rate response
Berger, R. D., Saul, J. P., & Cohen, R. J. (1989) · American Journal of Physiology-Heart and Circulatory Physiology · doi:10.1152/ajpheart.1989.256.1.h142 · Cited by 501
Short- and long-term effects of cigarette smoking on heart rate variability
Hayano, J., Yamada, M., Sakakibara, Y., Fujinami, T., Yokoyama, K., Watanabe, Y., & Takata, K. (1990) · The American Journal of Cardiology · doi:10.1016/0002-9149(90)90030-5 · Cited by 321
Cardiopulmonary Exercise Testing: Relevant but Underused
Forman, D. E., MYERS, J. N., Lavie, C. J., Guazzi, M., Celli, B. R., & Arena, R. A. (2010) · Postgraduate Medicine · doi:10.3810/pgm.2010.11.2225 · Cited by 126
Yang, C. C. H., Lai, C., Hsien Yong, L. A. I., & Kuo, T. B. J. (2002) · Neuroscience Letters · doi:10.1016/s0304-3940(02)00661-4 · Cited by 109
Continuous, on-line, real-time spectral analysis of systemic arterial pressure signals
Kuo, T. B. J., & Chan, S. H. H. (1993) · American Journal of Physiology-Heart and Circulatory Physiology · doi:10.1152/ajpheart.1993.264.6.h2208 · Cited by 107
Yang, C. C. H., Shaw, F., Lai, C. J., Lai, C., & Kuo, T. B. J. (2002) · Neuroscience Letters · doi:10.1016/s0304-3940(02)01200-4 · Cited by 103
Research works printed but not linked: 2
- Pate, 1991, Guidelines for exercise test administration, 55
- 2004, Circulatory adaptations to exercise, 164
Cited by
Practices and Applications of Heart Rate Variability Monitoring in Endurance Athletes
Lundstrom, C. J., Foreman, N. A., & Biltz, G. R. (2022) · International Journal of Sports Medicine · doi:10.1055/a-1864-9726 · Cited by 138
Liu, H.-L., Lee, Z.-X., Chuang, T.-W., & Wu, H.-C. (2021) · Planta · doi:10.1007/s00425-021-03751-9 · Cited by 39
Unraveling the link between cardiorespiratory fitness and cancer: a state-of-the-art review
Kunutsor, S. K., Kaminsky, L. A., Lehoczki, A., & Laukkanen, J. A. (2024) · GeroScience · doi:10.1007/s11357-024-01222-z · Cited by 26
Tobacco Use and Its Health Effects among Professional Athletes in Qatar
Chaabane, Z., Murlasits, Z., Mahfoud, Z. R., & Goebel, R. T. (2016) · Canadian Respiratory Journal · doi:10.1155/2016/2684090 · Cited by 19
Pepera, G., & Panagiota, Z. (2021) · African Health Sciences · doi:10.4314/ahs.v21i1.15 · Cited by 19
Metadata
- Authors
- Chen, C.-L., Tang, J.-S., Li, P.-C., & Chou, P.-L.
- Affiliations
- I-Shou University (TW)
- Chung Hwa University of Medical Technology (TW)
- Kaohsiung Medical University (TW)
- Corresponding author
- Chen, Chien-Liang
- Venue
- Frontiers in Physiology
- Publisher
- Frontiers Media SA
- Published
- 2015-12-10
- Volume
- 6
- Pages
- 376-376
- ISSN
- 1664-042X (ISSN-L)
- PMC
- PMC4674552
- OpenAlex
- W2190520568
- Cited by
- 20
- References
- 29
- Citations by year
- 2026: 3 · 2025: 2 · 2024: 4 · 2022: 4 · 2021: 2 · 2019: 1 · 2018: 1 · 2017: 2 · 2016: 1
- FWCI
- 0.86
- Type
- journal article
- Language
- en
- Open access
- gold
- doi.org
- Licence
- cc-by
- Locations
- Frontiers in Physiology (publishedVersion, cc-by)
- Europe PMC (PubMed Central) (publishedVersion, cc-by)
- PubMed (publishedVersion)
- PubMed Central (publishedVersion, cc-by)
- DOAJ (DOAJ: Directory of Open Access Journals) (submittedVersion, cc-by-sa)
- Frontiers in Physiology (cc-by)
- Funders
- I-Shou University (ISU100-04-05)
- Topics
- Health Sciences › Medicine › Physiology (medical) › Cardiovascular and exercise physiology
- Health Sciences › Medicine › Public Health, Environmental and Occupational Health › Smoking Behavior and Cessation
- Health Sciences › Medicine › Cardiology and Cardiovascular Medicine › Heart Rate Variability and Autonomic Control
- Keywords
- cardiorespiratory responses, dynamic exercise, arm-cranking exercise, time to exhaustion, ventilatory threshold, oxygen consumption, heart rate variability, lung function, exercise performance
About these checks
Registry, retraction, Cites and statistics results are computed, not judged, with one exception: a printed reference that no index lists is read once by a model before it counts as a citation error. Claims are extracted by a model and kept only when their quote appears verbatim in the text; each cited source is then checked, with a model’s help, for whether it says what the claim relies on. Those verdicts can be wrong — read the claim’s quote and the cited source before relying on one.
A language model drew the claims from the paper on 2026-11-14, under version 3 of the claim definition (model deepseek-v4.1-flash, prompt extract-v3).
A second model labelled each claim on 2026-11-14 (model jev-1.13-20260917, definition revision gold-guideline-v0.2).
Statistics and arithmetic are recomputed, not judged.
Confidence bands are shown only for fields calibrated on our annotated test set. None is calibrated yet, so no band is shown.
What counts as a claim ›How we measure confidence ›How we check this ›
Are you an author, or do you see a problem with this page? Request a review
How to cite
Cite CoChat for the checks on this page, and the paper for its own findings.
- This page
- CoChat. (2026). Citation check: Immediate Effects of Smoking on Cardiorespiratory Responses During Dynamic Exercise: Arm Vs. Leg Ergometry. https://app.cochat.ai/papers/10.3389/fphys.2015.00376
- The paper
- Chen, C.-L., Tang, J.-S., Li, P.-C., & Chou, P.-L. (2015). Immediate Effects of Smoking on Cardiorespiratory Responses During Dynamic Exercise: Arm Vs. Leg Ergometry. Frontiers in Physiology. https://doi.org/10.3389/fphys.2015.00376
Data sources
Bibliographic data: Semantic Scholar, OpenAlex, Crossref.
Contains information from the Semantic Scholar Academic Graph Datasets, made available under the ODC Attribution License (ODC-BY 1.0).
Semantic Scholar’s data is described in: Kinney, R., et al. (2023). The Semantic Scholar Open Data Platform. arXiv:2301.10140.
