

The DOI matches its Crossref record; 1 of the 1 references it cites were found in a registry or an index.
Integrated GWAS and transcriptomic analysis reveal the candidate salt-responding genes regulating Na(+)/K(+) balance in barley (Hordeum vulgare L.)
Open accessAbstract
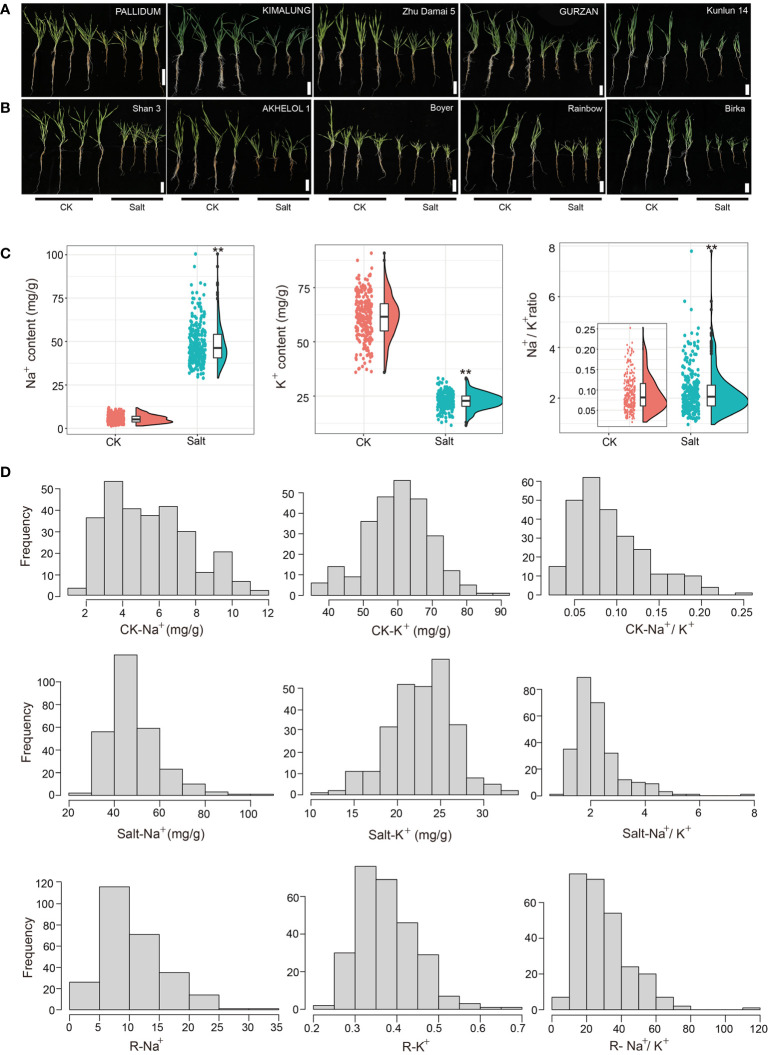
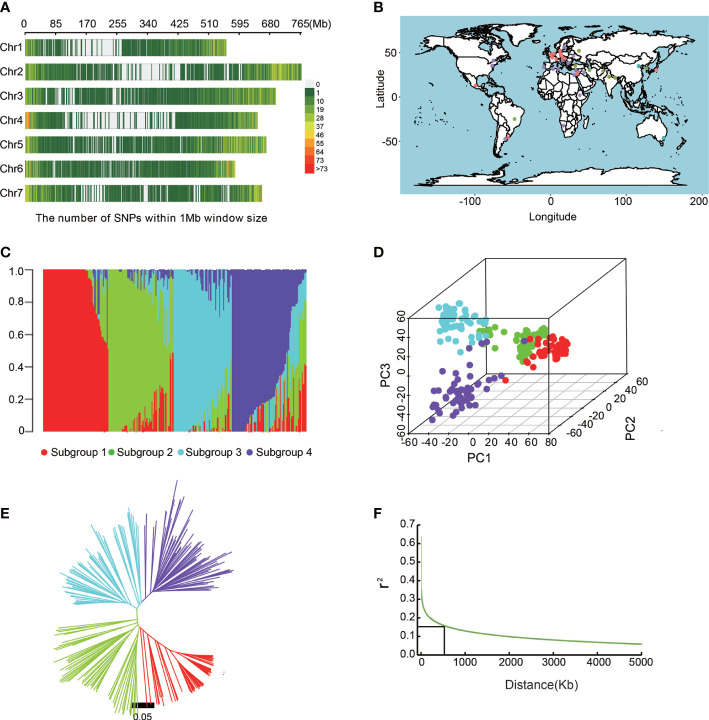
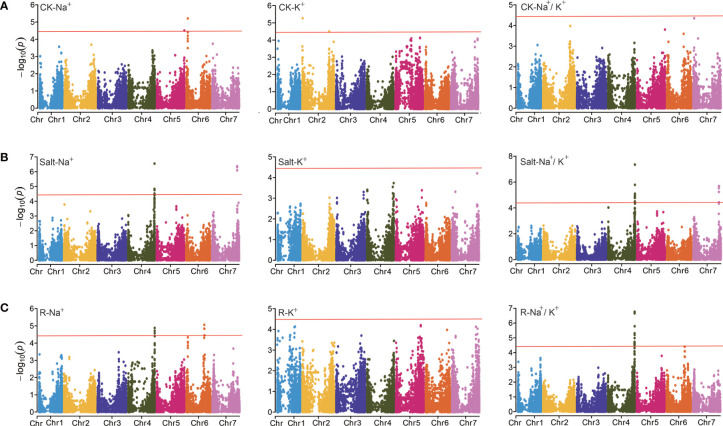
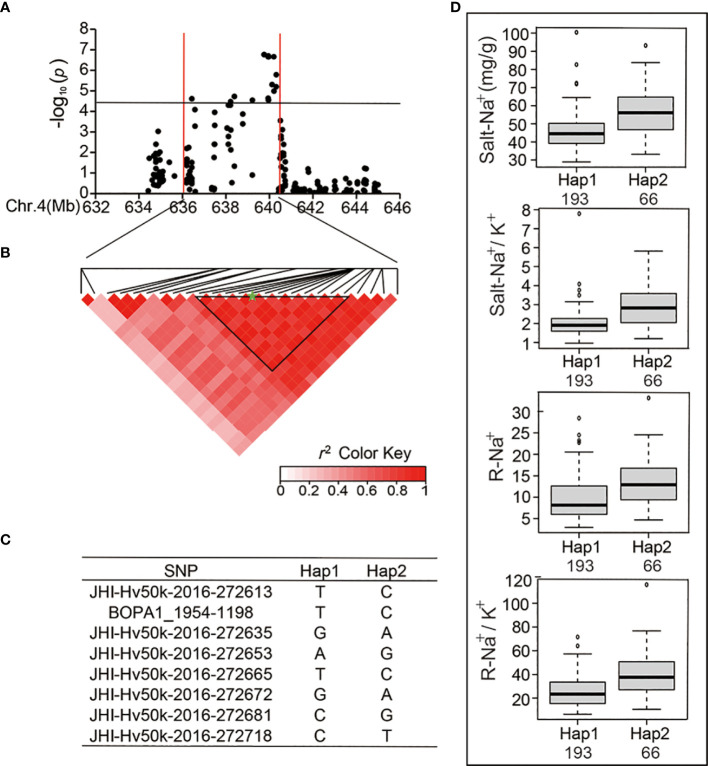
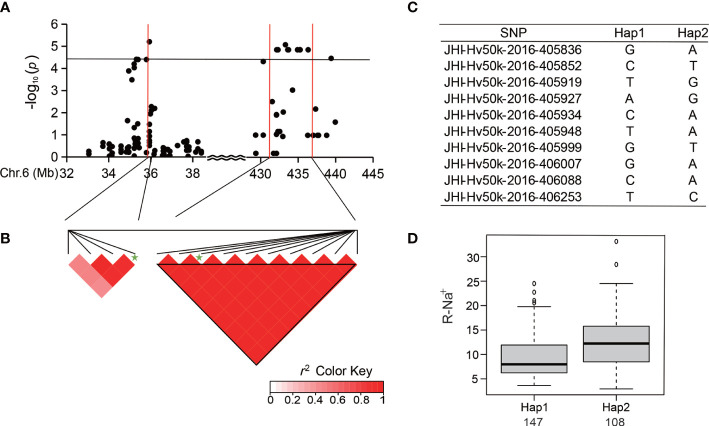
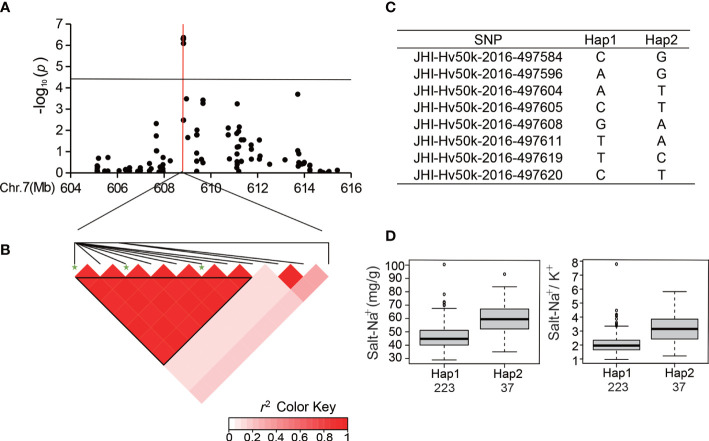
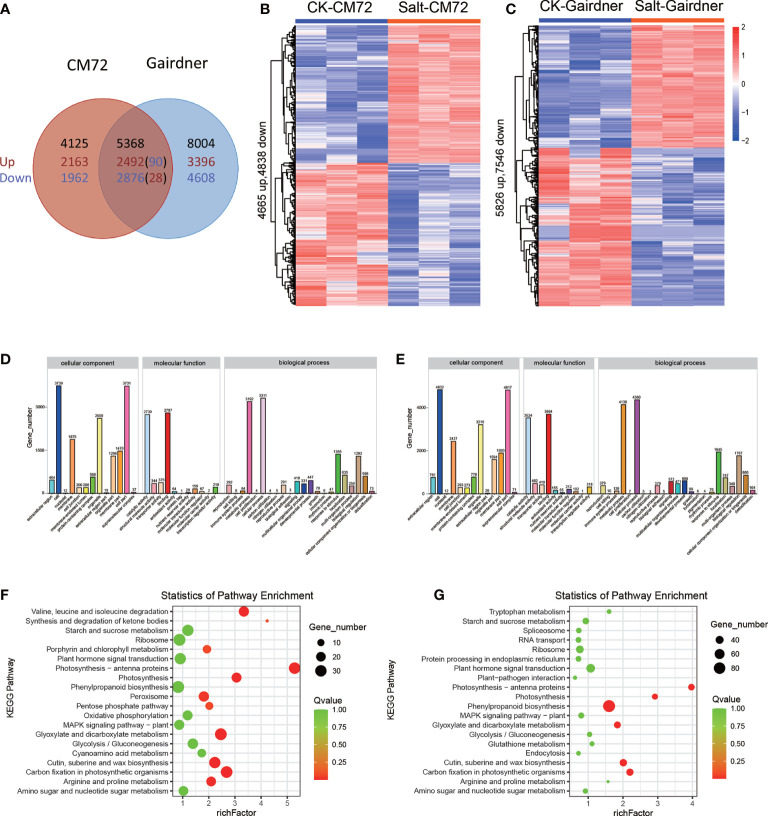
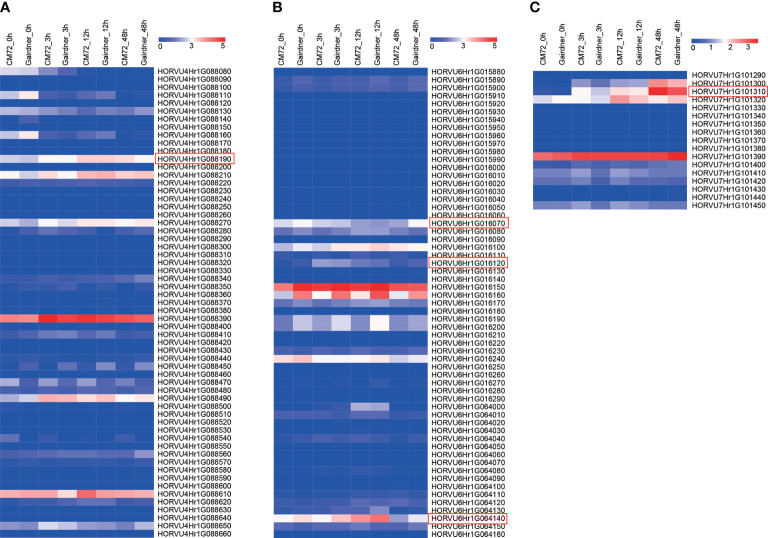
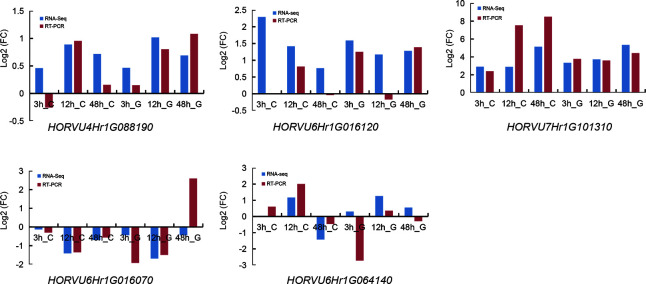
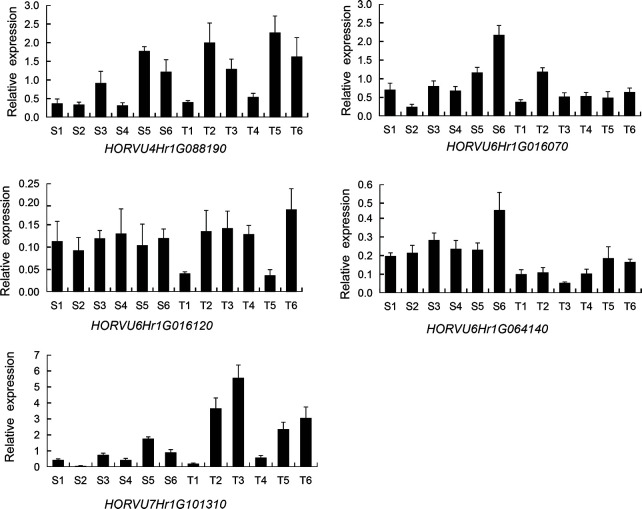
Salt stress is one of the main abiotic stresses affecting crop yield and quality. Barley has strong salt tolerance, however, the underlying genetic basis is not fully clear, especially in the seedling stage. This study examined the ionic changes in barley core germplasms under the control and salt conditions. Genome-wide association study (GWAS) analysis revealed 54 significant SNPs from a pool of 25,342 SNPs distributed in 7 chromosomes (Chr) of the Illumina Barley 50K SNP array. These SNPs are associated with ion homeostasis traits, sodium (Na+) and potassium (K+) content, and Na+/K+ ratio representing five genomic regions on Chr 2, 4, 5, 6, and 7 in the leaves of worldwide barley accessions. And there are 3 SNP peaks located on the Chr 4, 6, and 7, which could be the “hot spots” regions for mining and identifying candidate genes for salt tolerance. Furthermore, 616 unique candidate genes were screened surrounding the significant SNPs, which are associated with transport proteins, protein kinases, binding proteins, and other proteins of unknown function. Meanwhile, transcriptomic analysis (RNA-Seq) was carried out to compare the salt-tolerant (CM72) and salt-sensitive (Gairdner) genotypes subjected to salt stress. And there was a greater accumulation of differentially expressed genes(DEGs) in Gairdner compared to CM72, mainly enriched in metabolic pathway, biosynthesis of secondary metabolites, photosynthesis, signal transduction,emphasizing the different transcriptional response in both genotypes following salt exposure. Combined GWAS and RNA-Seq analysis revealed 5 promising salt-responding genes (PGK2, BASS3, SINAT2, AQP, and SYT3) from the hot spot regions, which were verified between the salt-tolerant and salt-sensitive varieties by qRT-PCR. In all, these results provide candidate SNPs and genes responsible for salinity responding in barley, and a new idea for studying such genetic basis in similar crops.
Overview
The claims and statistics of this paper haven’t been checked yet.
Run the check — free, no account needed. It reads the open-access text and checks the sources it cites.
Integrity signals
Registry
Cites
Statistics
Figures
Verification
Claims the paper makes
The claims and statistics of this paper haven’t been checked yet.
Run the check — free, no account needed. It reads the open-access text and checks the sources it cites.
Claims other papers make about this one
Each is checked against this paper’s own text: does it say what the citing paper says it does?
The cited source says what the claim attributes to it.
In the citing paper
“Based on comprehensive GWAS and transcriptomics analysis, SYT3 and the other four most promising salt responsive genes were screened [41].”
From Transcriptome-Based WGCNA Analysis Reveals the Mechanism of Drought Resistance Differences in Sweetpotato (Ipomoea batatas (L.) Lam.) (2023) · cites this paper as [41]
Self-check
Percentages, sums and reported differences re-computed from the paper’s own numbers.
The self-check needs the paper’s full text.
Citations
Cites
A physical, genetic and functional sequence assembly of the barley genome
The International Barley Genome Sequencing Consortium (2012) · Nature · doi:10.1038/nature11543 · Cited by 1,456
Research works printed but not linked: 93
- Angessa, 2017, Early growth stages salinity stress tolerance in CM72 x gairdner doubled haploid barley population, PloS One, 12, e179715, 10.1371/journal.pone.0179715 · DOI
- Assaha, 2017, The role of na+ and k+ transporters in salt stress adaptation in glycophytes, Front. Physiol., 18, 10.3389/fphys.2017.00509 · DOI
- Attitalla, 2011, Modified CTAB method for high quality genomic DNA extraction from medicinal plants, Pak. J. Biol. Sci., 14, 998, 10.3923/pjbs.2011.998.999 · DOI
- Atwell, 2010, Genome-wide association study of 107 phenotypes in a common set of arabidopsis thaliana inbred lines, Nature, 465, 627, 10.1038/nature08800 · DOI · Paper page
- Bahieldin, 2015, RNA-Seq analysis of the wild barley (H. spontaneum) leaf transcriptome under salt stress, Comptes Rendus. Biol., 338, 285, 10.1016/j.crvi.2015.03.010 · DOI
- Bao, 2014, The tumor necrosis factor receptor-associated factor (TRAF)-like family protein SEVEN IN ABSENTIA 2 (SINA2) promotes drought tolerance in an ABA-dependent manner in arabidopsis, New Phytol., 202, 174, 10.1111/nph.12644 · DOI
- Bayer, 2017, Development and evaluation of a barley 50k iSelect SNP array, Front. Plant Sci., 8, 10.3389/fpls.2017.01792 · DOI
- Bulik-Sullivan, 2015, LD score regression distinguishes confounding from polygenicity in genome-wide association studies, Nat. Genet., 47, 291, 10.1038/ng.3211 · DOI · Paper page
- Chang, 2015, Second-generation PLINK: rising to the challenge of larger and richer datasets, Gigascience, 4, 10.1186/s13742-015-0047-8 · DOI · Paper page
- Chang, 2016, An aquaporin gene from halophyte sesuvium portulacastrum, SpAQP1, increases salt tolerance in transgenic tobacco, Plant Cell Rep., 35, 385, 10.1007/s00299-015-1891-9 · DOI
- Chen, 2018, Phosphorylation of arabidopsis SINA2 by CDKG1 affects its ubiquitin ligase activity, BMC Plant Biol., 18, 147, 10.1186/s12870-018-1364-8 · DOI
- Chen, 2015, Genome-wide association implicates candidate genes conferring resistance to maize rough dwarf disease in maize, PloS One, 10, e142001, 10.1371/journal.pone.0142001 · DOI
- Comadran, 2012, Natural variation in a homolog of antirrhinum CENTRORADIALIS contributed to spring growth habit and environmental adaptation in cultivated barley, Nat. Genet., 44, 1388, 10.1038/ng.2447 · DOI
- Cuin, 2005, Exogenously supplied compatible solutes rapidly ameliorate NaCl-induced potassium efflux from barley roots, Plant Cell Physiol., 46, 1924, 10.1093/pcp/pci205 · DOI
- Cuin, 2007, Amino acids regulate salinity-induced potassium efflux in barley root epidermis, Planta, 225, 753, 10.1007/s00425-006-0386-x · DOI
- Danshina, 2010, Phosphoglycerate kinase 2 (PGK2) is essential for sperm function and male fertility in mice, Biol. Reprod., 82, 136, 10.1095/biolreprod.109.079699 · DOI
- Elakhdar, 2016, Population structure and marker–trait association of salt tolerance in barley (Hordeum vulgare l.), Comptes Rendus Biologies, 339, 454, 10.1016/j.crvi.2016.06.006 · DOI
- Evanno, 2005, Detecting the number of clusters of individuals using the software STRUCTURE: a simulation study, Mol. Ecol., 14, 2611, 10.1111/j.1365-294X.2005.02553.x · DOI
- Fang, 2017, Genomic analyses in cotton identify signatures of selection and loci associated with fiber quality and yield traits, Nat. Genet., 49, 1089, 10.1038/ng.3887 · DOI
- Fan, 2016, Genome-wide association study reveals a new QTL for salinity tolerance in barley (Hordeum vulgare l.), Front. Plant Sci., 7, 10.3389/fpls.2016.00946 · DOI
- Gharaghanipor, 2022, Physiological and transcriptome indicators of salt tolerance in wild and cultivated barley, Front. Plant Sci., 13, 10.3389/fpls.2022.819282 · DOI
- Hamamoto, 2015, HKT transporters mediate salt stress resistance in plants: from structure and function to the field, Curr. Opin. Biotechnol., 32, 113, 10.1016/j.copbio.2014.11.025 · DOI
- Han, 2015, Effects of nitrogen fertilization on the acidity and salinity of greenhouse soils, Environ. Sci. pollut. Res. Int., 22, 2976, 10.1007/s11356-014-3542-z · DOI
- Hazzouri, 2018, Mapping of HKT1;5 gene in barley using GWAS approach and its implication in salt tolerance mechanism, Front. Plant Sci., 9, 10.3389/fpls.2018.00156 · DOI · Paper page
- Houston, 2020, Barley sodium content is regulated by natural variants of the na+ transporter HvHKT1;5, Commun. Biol., 3, 258, 10.1038/s42003-020-0990-5 · DOI
- Huang, 2020, The HKT transporter HvHKT1;5 negatively regulates salt tolerance, Plant Physiol., 182, 584, 10.1104/pp.19.00882 · DOI
- Huang, 2009, Identification of QTLs associated with salinity tolerance at late growth stage in barley, Euphytica, 169, 187, 10.1007/s10681-009-9919-2 · DOI
- Hu, 2012, Overexpression of a wheat aquaporin gene, TaAQP8, enhances salt stress tolerance in transgenic tobacco, Plant Cell Physiol., 53, 2127, 10.1093/pcp/pcs154 · DOI
- Janz, 2012, Harnessing salt for woody biomass production, Tree Physiol., 32, 1, 10.1093/treephys/tpr127 · DOI
- Jayakodi, 2020, The barley pan-genome reveals the hidden legacy of mutation breeding, Nature, 588, 284, 10.1038/s41586-020-2947-8 · DOI · Paper page
- Jiang, 2010, How do vacuolar NHX exchangers function in plant salt tolerance, Plant Signal Behav., 5, 792, 10.4161/psb.5.7.11767 · DOI
- Jia, 2020, Overexpression of medicago sativa LEA4-4 can improve the salt, drought, and oxidation resistance of transgenic arabidopsis, PloS One, 15, e234085, 10.1371/journal.pone.0234085 · DOI
- Joshi, 2016, Ectopic expression of pokkali phosphoglycerate kinase-2 (OsPGK2-p) improves yield in tobacco plants under salinity stress, Plant Cell Rep., 35, 27, 10.1007/s00299-015-1864-z · DOI
- Kobayashi, 2017, OsHKT1;5 mediates na+ exclusion in the vasculature to protect leaf blades and reproductive tissues from salt toxicity in rice, Plant J., 91, 657, 10.1111/tpj.13595 · DOI
- Krausko, 2022, The absence of the AtSYT1 function elevates the adverse effect of salt stress on photosynthesis in arabidopsis, Int. J. Mol. Sci., 23, 10.3390/ijms23031751 · DOI
- Krebs, 2010, Arabidopsis V-ATPase activity at the tonoplast is required for efficient nutrient storage but not for sodium accumulation, Proc. Natl. Acad. Sci. U.S.A., 107, 3251, 10.1073/pnas.0913035107 · DOI
- Kumari, 2021, Regulation of salt-stressed sunflower (Helianthus annuus) seedling’s water status by the coordinated action of Na+/K+ accumulation, nitric oxide, and aquaporin expression, Funct. Plant Biol., 48, 573, 10.1071/FP20334 · DOI
- Kumari, 2009, Transcriptome map for seedling stage specific salinity stress response indicates a specific set of genes as candidate for saline tolerance in Oryza sativa l, Funct. Integr. Genomics, 9, 109, 10.1007/s10142-008-0088-5 · DOI
- Lee, 2019, Ionic stress enhances ER-PM connectivity via phosphoinositide-associated SYT1 contact site expansion in arabidopsis, Proc. Natl. Acad. Sci. U.S.A., 116, 1420, 10.1073/pnas.1818099116 · DOI
- Liu, 2017, QTLs for stomatal and photosynthetic traits related to salinity tolerance in barley, BMC Genomics, 18, 9, 10.1186/s12864-016-3380-0 · DOI
- Liu, 2013, Aquaporin OsPIP1;1 promotes rice salt resistance and seed germination, Plant Physiol. Biochem., 63, 151, 10.1016/j.plaphy.2012.11.018 · DOI
- Long, 2013, Association mapping of salt tolerance in barley (Hordeum vulgare l.), Theor. Appl. Genet., 126, 2335, 10.1007/s00122-013-2139-0 · DOI
- Lu, 2018, Genome-wide analysis of multidrug and toxic compound extrusion (MATE) family in gossypium raimondii and gossypium arboreum and its expression analysis under salt, cadmium, and drought stress, G3 (Bethesda), 8, 2483, 10.1534/g3.118.200232 · DOI
- Lu, 2019, Overexpression of cotton a DTX/MATE gene enhances drought, salt, and cold stress tolerance in transgenic arabidopsis, Front. Plant Sci., 10, 10.3389/fpls.2019.00299 · DOI
- Mano, 1997, Mapping quantitative trait loci for salt tolerance at germination and the seedling stage in barley (Hordeum vulgare l.), Euphytica, 94, 263, 10.1023/A:1002968207362 · DOI
- Mao, 2005, Automated genome annotation and pathway identification using the KEGG orthology (KO) as a controlled vocabulary, Bioinformatics, 21, 3787, 10.1093/bioinformatics/bti430 · DOI
- Mao, 2013, CYP709B3, a cytochrome P450 monooxygenase gene involved in salt tolerance in Arabidopsis thaliana, BMC Plant Biol., 13, 10.1186/1471-2229-13-169 · DOI
- Mascher, 2017, A chromosome conformation capture ordered sequence of the barley genome, Nature, 544, 427, 10.1038/nature22043 · DOI · Paper page
- McMorrow, 1990, Separation, purification, and comparative properties of chloroplast and cytoplasmic phosphoglycerate kinase from barley leaves, Plant Physiol., 93, 374, 10.1104/pp.93.2.374 · DOI
- Munns, 2008, Mechanisms of salinity tolerance, Annu. Rev. Plant Biol., 59, 651, 10.1146/annurev.arplant.59.032607.092911 · DOI · Paper page
- Mwando, 2020, Genome-wide association study of salinity tolerance during germination in barley (Hordeum vulgare l.), Front. Plant Sci., 11, 10.3389/fpls.2020.00118 · DOI
- Myo, 2020, Ectopic overexpression of a cotton plastidial na+ transporter GhBASS5 impairs salt tolerance in arabidopsis via increasing na+ loading and accumulation, Planta, 252, 41, 10.1007/s00425-020-03445-8 · DOI
- Nevo, 2010, Drought and salt tolerances in wild relatives for wheat and barley improvement, Plant Cell Environ., 33, 670, 10.1111/j.1365-3040.2009.02107.x · DOI
- Ning, 2011, The SINA E3 ligase OsDIS1 negatively regulates drought response in rice, Plant Physiol., 157, 242, 10.1104/pp.111.180893 · DOI
- Ning, 2011, OsDIS1-mediated stress response pathway in rice, Plant Signal Behav., 6, 1684, 10.4161/psb.6.11.17916 · DOI
- Nutan, 2018, A salt overly sensitive pathway member from brassica juncea BjSOS3 can functionally complement ΔAtsos3 in arabidopsis, Curr. Genomics, 19, 60, 10.2174/1389202918666170228133621 · DOI
- Ouertani, 2022, Effects of salt stress on transcriptional and physiological responses in barley leaves with contrasting salt tolerance, Int. J. Mol. Sci., 23, 10.3390/ijms23095006 · DOI
- Qiu, 2011, Evaluation of salinity tolerance and analysis of allelic function of HvHKT1 and HvHKT2 in Tibetan wild barley, Theor. Appl. Genet., 122, 695, 10.1007/s00122-010-1479-2 · DOI
- Ramamoorthy, 2017, Root traits confer grain yield advantages under terminal drought in chickpea (Cicer arietinum l.), Field Crops Res., 201, 146, 10.1016/j.fcr.2016.11.004 · DOI
- Ruiz, 1997, Citrus response to salinity: Growth and nutrient uptake, Tree Physiol, 17, 141, 10.1093/treephys/17.3.141 · DOI
- Ruiz-Lopez, 2021, Synaptotagmins at the endoplasmic reticulum-plasma membrane contact sites maintain diacylglycerol homeostasis during abiotic stress, Plant Cell, 33, 2431, 10.1093/plcell/koab122 · DOI
- Sawyer, 2008, X-Ray analysis of phosphoglycerate kinase 2, a sperm-specific isoform from mus musculus, Proteins, 71, 1134, 10.1002/prot.21801 · DOI
- Sbei, 2014, Detection of QTLs for salt tolerance in Asian barley (Hordeum vulgare l.) by association analysis with SNP markers, Breed Sci., 64, 378, 10.1270/jsbbs.64.378 · DOI
- Shabala, 2007, Expression of animal CED-9 anti-apoptotic gene in tobacco modifies plasma membrane ion fluxes in response to salinity and oxidative stress, Planta, 27, 189, 10.1007/s00425-007-0606-z · DOI
- Shavrukov, 2010, HvNax3–a locus controlling shoot sodium exclusion derived from wild barley (Hordeum vulgare ssp. spontaneum), Funct. Integr. Genomics, 10, 277, 10.1007/s10142-009-0153-8 · DOI
- Shi, 2014, Improvement of plant abiotic stress tolerance through modulation of the polyamine pathway, J. Integr. Plant Biol., 56, 114, 10.1111/jipb.12128 · DOI
- Shi, 2014, Overexpression of the receptor-like protein kinase genes AtRPK1 and OsRPK1 reduces the salt tolerance of arabidopsis thaliana, Plant Sci., 217, 10.1016/j.plantsci.2013.12.002 · DOI
- Slama, 2015, Diversity, distribution and roles of osmoprotective compounds accumulated in halophytes under abiotic stress, Ann. Bot., 115, 433, 10.1093/aob/mcu239 · DOI
- Sun, 2021, Genome-wide analysis of the Cytochrome P450 gene family involved in salt tolerance in Gossypium hirsutum, Front. Plant Sci., 12, 10.3389/fpls.2021.685054 · DOI
- Sun, 2019, A glycine max sodium/hydrogen exchanger enhances salt tolerance through maintaining higher na+ efflux rate and K+/Na+ ratio in arabidopsis, BMC Plant Biol., 19, 469, 10.1186/s12870-019-2084-4 · DOI
- Sun, 2018, Identification of SNPs and candidate genes associated with salt tolerance at the seedling stage in cotton (Gossypium hirsutum l.), Front. Plant Sci., 9, 10.3389/fpls.2018.01011 · DOI
- Sun, 2018, Ectopic expression of GsSRK in medicago sativa reveals its involvement in plant architecture and salt stress responses, Front. Plant Sci., 9, 10.3389/fpls.2018.00226 · DOI
- Sun, 2013, A glycine soja ABA-responsive receptor-like cytoplasmic kinase, GsRLCK, positively controls plant tolerance to salt and drought stresses, Planta, 237, 1527, 10.1007/s00425-013-1864-6 · DOI
- Sun, 2013, GsSRK, a G-type lectin s-receptor-like serine/threonine protein kinase, is a positive regulator of plant tolerance to salt stress, J. Plant Physiol., 170, 505, 10.1016/j.jplph.2012.11.017 · DOI
- Suzuki, 2016, OsHKT1;4-mediated na+ transport in stems contributes to na+exclusion from leaf blades of rice at the reproductive growth stage upon salt stress, BMC Plant Biol., 16, 22, 10.1186/s12870-016-0709-4 · DOI
- Tang, 2016, GAPIT version 2: An enhanced integrated tool for genomic association and prediction, Plant Genome, 9, 1, 10.3835/plantgenome2015.11.0120 · DOI
- Tu, 2021, GWAS and transcriptomic integrating analysis reveals key salt-responding genes controlling na+ content in barley roots, Plant Physiol. Biochem., 167, 596, 10.1016/j.plaphy.2021.08.038 · DOI
- van Bezouw, 2019, Shoot sodium exclusion in salt stressed barley (Hordeum vulgare l.) is determined by allele specific increased expression of HKT1;5, J. Plant Physiol., 241, 10.1016/j.jplph.2019.153029 · DOI
- Verma, 2016, Plant hormone-mediated regulation of stress responses, BMC Plant Biol., 16, 10.1186/s12870-016-0771-y · DOI
- Wang, 2020, The involvement of wheat U-box E3 ubiquitin ligase TaPUB1 in salt stress tolerance, J. Integr. Plant Biol., 62, 631, 10.1111/jipb.12842 · DOI
- Wege, 2021, A single residue deletion in the barley HKT1;5 P189 variant restores plasma membrane localisation but not na+ conductance, Biochim. Biophys. Acta Biomembr., 1863, 10.1016/j.bbamem.2021.183669 · DOI
- Wijmenga, 2021, From LD-based mapping to GWAS, Nat. Rev. Genet., 22, 480, 10.1038/s41576-021-00366-4 · DOI
- Xia, 2021, Genome-wide identification and analyses of Drought/Salt-responsive Cytochrome P450 genes in medicago truncatula, Int. J. Mol. Sci., 22, 10.3390/ijms22189957 · DOI
- Xin, 2021, Overexpression of the ginkgo biloba WD40 gene GbLWD1-like improves salt tolerance in transgenic populus, Plant Sci., 313, 10.1016/j.plantsci.2021.111092 · DOI
- Xue, 2017, A major QTL on chromosome 7HS controls the response of barley seedling to salt stress in the nure x tremois population, BMC Genet., 18, 79, 10.1186/s12863-017-0545-z · DOI
- Yang, 2009, Overexpression of SOS (Salt overly sensitive) genes increases salt tolerance in transgenic arabidopsis, Mol. Plant, 2, 22, 10.1093/mp/ssn058 · DOI
- Yemets, 2011, Nitric oxide signalling via cytoskeleton in plants, Plant Sci., 181, 545, 10.1016/j.plantsci.2011.04.017 · DOI
- Zhang, 2019, PopLDdecay: a fast and effective tool for linkage disequilibrium decay analysis based on variant call format files, Bioinformatics, 35, 1786, 10.1093/bioinformatics/bty875 · DOI
- Zhang, 2018, Na+/K+ balance and transport regulatory mechanisms in weedy and cultivated rice (Oryza sativa l.) under salt stress, BMC Plant Biol., 18, 375, 10.1186/s12870-018-1586-9 · DOI
- Zhang, 2014, A DTX/MATE-type transporter facilitates abscisic acid efflux and modulates ABA sensitivity and drought tolerance in arabidopsis, Mol. Plant, 7, 1522, 10.1093/mp/ssu063 · DOI
- Zhao, 2016, A putative pyruvate transporter TaBASS2 positively regulates salinity tolerance in wheat via modulation of ABI4 expression, BMC Plant Biol., 16, 109, 10.1186/s12870-016-0795-3 · DOI
- Zhou, 2014, Structural basis of the alternating-access mechanism in a bile acid transporter, Nature, 505, 569, 10.1038/nature12811 · DOI
- Zhu, 2017, Physiological and molecular mechanisms mediating xylem na+ loading in barley in the context of salinity stress tolerance, Plant Cell Environ., 40, 1009, 10.1111/pce.12727 · DOI
Cited by
Sorted by citations
Zong, J., Chen, P., Luo, Q., Gao, J., Qin, R., Wu, C., Lv, Q., Zhao, T., & Fu, Y. (2023) · International Journal of Molecular Sciences · doi:10.3390/ijms241814398 · Cited by 27
Metadata
- Authors
- Xu, T., Meng, S., Zhu, X., Di, J., Zhu, Y., Yang, X., & Yan, W.
- Affiliations
- Jiangsu Academy of Agricultural Sciences (CN)
- Corresponding author
- Yan, Wei
- Venue
- Frontiers in Plant Science
- Publisher
- Frontiers Media SA
- Published
- 2023-01-20
- Volume
- 13
- Pages
- 1004477-1004477
- ISSN
- 1664-462X (ISSN-L)
- PMC
- PMC9910287
- OpenAlex
- W4317538198
- Cited by
- 17
- References
- 1
- Citations by year
- 2026: 6 · 2025: 6 · 2024: 3 · 2023: 2
- FWCI
- 2.68
- Type
- journal article
- Language
- en
- Update notices
- corrigendum (2023-11-29)
- Open access
- gold
- doi.org
- Licence
- Locations
- Frontiers in Plant Science (publishedVersion, cc-by)
- PubMed Central (publishedVersion, cc-by)
- PubMed (publishedVersion)
- DOAJ (DOAJ: Directory of Open Access Journals) (submittedVersion, cc-by-sa)
- Funders
- Jiangsu Agricultural Science and Technology Innovation Fund
- National Natural Science Foundation of China
- Topics
- Life Sciences › Agricultural and Biological Sciences › Plant Science › Plant Stress Responses and Tolerance
- Life Sciences › Agricultural and Biological Sciences › Plant Science › Wheat and Barley Genetics and Pathology
- Life Sciences › Biochemistry, Genetics and Molecular Biology › Genetics › Genetic Mapping and Diversity in Plants and Animals
- Keywords
- barley, salt stress, salt tolerance, Na+/K+ balance, ion homeostasis, candidate genes, seedling stage, differentially expressed genes, transcriptome, aquaporins
About these checks
Registry, retraction, Cites and statistics results are computed, not judged, with one exception: a printed reference that no index lists is read once by a model before it counts as a citation error. Claims are extracted by a model and kept only when their quote appears verbatim in the text; each cited source is then checked, with a model’s help, for whether it says what the claim relies on. Those verdicts can be wrong — read the claim’s quote and the cited source before relying on one.
Statistics and arithmetic are recomputed, not judged.
Confidence bands are shown only for fields calibrated on our annotated test set. None is calibrated yet, so no band is shown.
What counts as a claim ›How we measure confidence ›How we check this ›
Are you an author, or do you see a problem with this page? Request a review
How to cite
Cite CoChat for the checks on this page, and the paper for its own findings.
- This page
- CoChat. (2026). Citation check: Integrated GWAS and transcriptomic analysis reveal the candidate salt-responding genes regulating Na(+)/K(+) balance in barley (Hordeum vulgare L.). https://app.cochat.ai/papers/10.3389/fpls.2022.1004477
- The paper
- Xu, T., Meng, S., Zhu, X., Di, J., Zhu, Y., Yang, X., & Yan, W. (2023). Integrated GWAS and transcriptomic analysis reveal the candidate salt-responding genes regulating Na(+)/K(+) balance in barley (Hordeum vulgare L.). Frontiers in Plant Science. https://doi.org/10.3389/fpls.2022.1004477
